Compare commits
10
Commits
| Author | SHA1 | Date | |
|---|---|---|---|
 mannilakash |
7d0373989f | ||
|
mannilakash
|
ac51dfeab7 | ||
|
mannilakash
|
99a5aa1722 | ||
|
mannilakash
|
5791bdd5e7 | ||
|
mannilakash
|
f7514bc938 | ||
|
mannilakash
|
2bbaf7d1eb | ||
 Alexander Holliday |
4222d39a8b | ||
|
Alex Holliday
|
fb69e29adf | ||
|
Alexander Holliday
|
0d90083e63 | ||
 Mayssaaa gloulou |
ec129e3604 |
No files matched your search
@@ -48,6 +48,10 @@ You can see the latest build of [Checkmate](https://checkmate-demo.bluewavelabs.
|
||||
|
||||
Usage instructions can be found [here](https://checkmate.so/docs).
|
||||
|
||||
## Prerequisites
|
||||
- [Docker](https://www.docker.com/) installed
|
||||
- [Git](https://git-scm.com/) installed
|
||||
|
||||
## Installation
|
||||
|
||||
See installation instructions in [Checkmate documentation portal](https://checkmate.so/docs).
|
||||
@@ -80,7 +84,7 @@ You can see the memory footprint of MongoDB and Redis on the same server (398Mb
|
||||
If you have any questions, suggestions or comments, you have several options:
|
||||
|
||||
- [Discord channel](https://discord.gg/NAb6H3UTjK) (preferred)
|
||||
- [GitHub Discussions](https://github.com/bluewave-labs/bluewave-uptime/discussions) (we check here from time to time)
|
||||
- [GitHub Discussions](https://github.com/bluewave-labs/Checkmate/discussions) (we check here from time to time)
|
||||
|
||||
Feel free to ask questions or share your ideas - we'd love to hear from you!
|
||||
|
||||
@@ -167,7 +171,7 @@ Here's how you can contribute:
|
||||
<img src="https://contrib.rocks/image?repo=bluewave-labs/checkmate" />
|
||||
</a>
|
||||
|
||||
[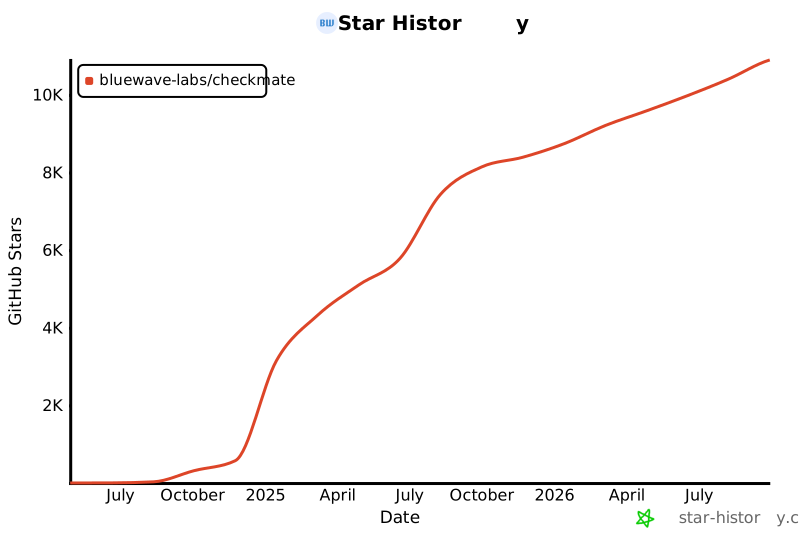](https://star-history.com/#bluewave-labs/bluewave-uptime&Date)
|
||||
[](https://star-history.com/#bluewave-labs/Checkmate&Date)
|
||||
|
||||
## Our sponsors
|
||||
|
||||
|
||||
@@ -3,7 +3,7 @@ import Stack from "@mui/material/Stack";
|
||||
import Box from "@mui/material/Box";
|
||||
import Typography from "@mui/material/Typography";
|
||||
|
||||
import { useTheme, type Theme } from "@mui/material/styles";
|
||||
import { useTheme } from "@mui/material/styles";
|
||||
import { useMemo, useState, useEffect } from "react";
|
||||
import { getInfraGaugeColor } from "@/Utils/MonitorUtils";
|
||||
|
||||
@@ -17,10 +17,6 @@ export const Gauge = ({
|
||||
strokeWidth = 15,
|
||||
precision = 1,
|
||||
unit = "%",
|
||||
// colorFn lets callers override the default color logic.
|
||||
// The Gauge was originally designed for metrics where higher values are worse (e.g., CPU usage).
|
||||
// PageSpeed scores are the opposite—higher is better—so a custom colorFn can be used to invert the behavior.
|
||||
colorFn,
|
||||
}: {
|
||||
isLoading?: boolean;
|
||||
progress?: number;
|
||||
@@ -28,7 +24,6 @@ export const Gauge = ({
|
||||
strokeWidth?: number;
|
||||
precision?: number;
|
||||
unit?: string;
|
||||
colorFn?: (val: number, theme: Theme) => string;
|
||||
}) => {
|
||||
const theme = useTheme();
|
||||
const progressWithinRange = Math.max(MINIMUM_VALUE, Math.min(progress, MAXIMUM_VALUE));
|
||||
@@ -53,8 +48,7 @@ export const Gauge = ({
|
||||
return () => clearTimeout(timer);
|
||||
}, [progress, circumference, strokeLength]);
|
||||
|
||||
const resolvedColorFn = colorFn ?? getInfraGaugeColor;
|
||||
const fillColor = resolvedColorFn(progressWithinRange, theme);
|
||||
const fillColor = getInfraGaugeColor(progressWithinRange, theme);
|
||||
|
||||
if (isLoading) {
|
||||
return;
|
||||
|
||||
@@ -1,12 +1,13 @@
|
||||
import type { Monitor } from "@/Types/Monitor";
|
||||
import Stack from "@mui/material/Stack";
|
||||
import Typography from "@mui/material/Typography";
|
||||
import { PulseDot, Dot } from "@/Components/design-elements";
|
||||
import { PulseDot, Dot, StrategyBadge } from "@/Components/design-elements";
|
||||
import { getStatusColor, formatUrl } from "@/Utils/MonitorUtils";
|
||||
import { useTheme } from "@mui/material/styles";
|
||||
import prettyMilliseconds from "pretty-ms";
|
||||
import { typographyLevels } from "@/Utils/Theme/Palette";
|
||||
import useMediaQuery from "@mui/material/useMediaQuery";
|
||||
import { LAYOUT } from "@/Utils/Theme/constants";
|
||||
export const MonitorStatus = ({ monitor }: { monitor: Monitor }) => {
|
||||
const theme = useTheme();
|
||||
const isSmall = useMediaQuery(theme.breakpoints.down("md"));
|
||||
@@ -28,7 +29,7 @@ export const MonitorStatus = ({ monitor }: { monitor: Monitor }) => {
|
||||
<Stack
|
||||
direction="row"
|
||||
alignItems={"center"}
|
||||
gap={theme.spacing(4)}
|
||||
gap={theme.spacing(LAYOUT.XS)}
|
||||
>
|
||||
<PulseDot color={getStatusColor(monitor.status, theme)} />
|
||||
<Typography
|
||||
@@ -41,6 +42,12 @@ export const MonitorStatus = ({ monitor }: { monitor: Monitor }) => {
|
||||
>
|
||||
{formatUrl(monitor?.url)}
|
||||
</Typography>
|
||||
{monitor.type === "pagespeed" && monitor.strategy && (
|
||||
<>
|
||||
<Dot />
|
||||
<StrategyBadge strategy={monitor.strategy} />
|
||||
</>
|
||||
)}
|
||||
{!isSmall && (
|
||||
<>
|
||||
<Dot />
|
||||
|
||||
@@ -0,0 +1,32 @@
|
||||
import Typography from "@mui/material/Typography";
|
||||
import { useTheme } from "@mui/material/styles";
|
||||
import { useTranslation } from "react-i18next";
|
||||
import type { PageSpeedStrategy } from "@/Types/Monitor";
|
||||
import { SPACING } from "@/Utils/Theme/constants";
|
||||
|
||||
interface StrategyBadgeProps {
|
||||
strategy: PageSpeedStrategy | undefined;
|
||||
variant?: "caption" | "body2";
|
||||
}
|
||||
|
||||
export const StrategyBadge = ({ strategy, variant = "body2" }: StrategyBadgeProps) => {
|
||||
const theme = useTheme();
|
||||
const { t } = useTranslation();
|
||||
|
||||
if (!strategy) {
|
||||
return null;
|
||||
}
|
||||
|
||||
return (
|
||||
<Typography
|
||||
variant={variant}
|
||||
px={SPACING.XXL}
|
||||
py={SPACING.SM}
|
||||
borderRadius={theme.shape.borderRadius}
|
||||
bgcolor={theme.palette.secondary.light}
|
||||
color={theme.palette.text.primary}
|
||||
>
|
||||
{t(`pages.pageSpeed.strategy.${strategy}`)}
|
||||
</Typography>
|
||||
);
|
||||
};
|
||||
@@ -21,3 +21,4 @@ export * from "./SplitBox";
|
||||
export * from "./TextLink";
|
||||
export * from "./OfflineBanner";
|
||||
export * from "./Avatar";
|
||||
export * from "./StrategyBadge";
|
||||
@@ -1,5 +1,6 @@
|
||||
import { useMemo } from "react";
|
||||
import { monitorSchema, type MonitorFormData } from "@/Validation/monitor";
|
||||
import { DefaultPageSpeedStrategy } from "@/Types/Monitor";
|
||||
import type { Monitor, MonitorType } from "@/Types/Monitor";
|
||||
|
||||
interface UseMonitorFormOptions {
|
||||
@@ -88,6 +89,7 @@ export const useMonitorForm = ({
|
||||
...base,
|
||||
type: "pagespeed",
|
||||
url: data?.url || "",
|
||||
strategy: data?.strategy ?? DefaultPageSpeedStrategy,
|
||||
};
|
||||
break;
|
||||
case "hardware":
|
||||
|
||||
@@ -35,7 +35,6 @@ export const useStatusPageForm = ({
|
||||
showUptimePercentage: data?.showUptimePercentage ?? true,
|
||||
showAdminLoginLink: data?.showAdminLoginLink ?? false,
|
||||
showInfrastructure: data?.showInfrastructure ?? false,
|
||||
showPageSpeed: data?.showPageSpeed ?? false,
|
||||
customCSS: data?.customCSS || "",
|
||||
logo: transformLogo(data?.logo),
|
||||
};
|
||||
|
||||
@@ -37,6 +37,7 @@ import {
|
||||
type MonitorType,
|
||||
type GamesMap,
|
||||
supportsGeoCheck,
|
||||
DefaultPageSpeedStrategy,
|
||||
} from "@/Types/Monitor";
|
||||
import type { Notification } from "@/Types/Notification";
|
||||
import type { MonitorFormData } from "@/Validation/monitor";
|
||||
@@ -51,6 +52,7 @@ interface GeneralSettingsConfig {
|
||||
showSecret: boolean;
|
||||
showGrpcServiceName: boolean;
|
||||
showIgnoreTls: boolean;
|
||||
showStrategy: boolean;
|
||||
}
|
||||
|
||||
const getGeneralSettingsConfig = (
|
||||
@@ -68,6 +70,7 @@ const getGeneralSettingsConfig = (
|
||||
showSecret: false,
|
||||
showGrpcServiceName: false,
|
||||
showIgnoreTls: false,
|
||||
showStrategy: false,
|
||||
},
|
||||
ping: {
|
||||
urlLabel: t("pages.createMonitor.form.general.option.host.label"),
|
||||
@@ -79,6 +82,7 @@ const getGeneralSettingsConfig = (
|
||||
showSecret: false,
|
||||
showGrpcServiceName: false,
|
||||
showIgnoreTls: false,
|
||||
showStrategy: false,
|
||||
},
|
||||
docker: {
|
||||
urlLabel: t("pages.createMonitor.form.general.option.container.label"),
|
||||
@@ -90,6 +94,7 @@ const getGeneralSettingsConfig = (
|
||||
showSecret: false,
|
||||
showGrpcServiceName: false,
|
||||
showIgnoreTls: false,
|
||||
showStrategy: false,
|
||||
},
|
||||
port: {
|
||||
urlLabel: t("pages.createMonitor.form.general.option.url.label"),
|
||||
@@ -101,6 +106,7 @@ const getGeneralSettingsConfig = (
|
||||
showSecret: false,
|
||||
showGrpcServiceName: false,
|
||||
showIgnoreTls: false,
|
||||
showStrategy: false,
|
||||
},
|
||||
game: {
|
||||
urlLabel: t("pages.createMonitor.form.general.option.url.label"),
|
||||
@@ -112,6 +118,7 @@ const getGeneralSettingsConfig = (
|
||||
showSecret: false,
|
||||
showGrpcServiceName: false,
|
||||
showIgnoreTls: false,
|
||||
showStrategy: false,
|
||||
},
|
||||
grpc: {
|
||||
urlLabel: t("pages.createMonitor.form.general.option.host.label"),
|
||||
@@ -123,6 +130,7 @@ const getGeneralSettingsConfig = (
|
||||
showSecret: false,
|
||||
showGrpcServiceName: true,
|
||||
showIgnoreTls: true,
|
||||
showStrategy: false,
|
||||
},
|
||||
pagespeed: {
|
||||
urlLabel: t("pages.createMonitor.form.general.option.url.label"),
|
||||
@@ -134,6 +142,7 @@ const getGeneralSettingsConfig = (
|
||||
showSecret: false,
|
||||
showGrpcServiceName: false,
|
||||
showIgnoreTls: false,
|
||||
showStrategy: true,
|
||||
},
|
||||
hardware: {
|
||||
urlLabel: t("pages.createMonitor.form.general.option.url.label"),
|
||||
@@ -145,6 +154,7 @@ const getGeneralSettingsConfig = (
|
||||
showSecret: true,
|
||||
showGrpcServiceName: false,
|
||||
showIgnoreTls: false,
|
||||
showStrategy: false,
|
||||
},
|
||||
websocket: {
|
||||
urlLabel: t("pages.createMonitor.form.general.option.wsUrl.label"),
|
||||
@@ -156,6 +166,7 @@ const getGeneralSettingsConfig = (
|
||||
showSecret: false,
|
||||
showGrpcServiceName: false,
|
||||
showIgnoreTls: true,
|
||||
showStrategy: false,
|
||||
},
|
||||
};
|
||||
return configs[type] || configs.http;
|
||||
@@ -382,6 +393,31 @@ const CreateMonitorPage = () => {
|
||||
/>
|
||||
)}
|
||||
|
||||
{/* Strategy field - only for pagespeed type */}
|
||||
{generalSettingsConfig.showStrategy && (
|
||||
<Controller
|
||||
name="strategy"
|
||||
control={control}
|
||||
render={({ field, fieldState }) => (
|
||||
<Select
|
||||
{...field}
|
||||
value={field.value ?? DefaultPageSpeedStrategy}
|
||||
fieldLabel={t(
|
||||
"pages.createMonitor.form.general.option.strategy.label"
|
||||
)}
|
||||
error={!!fieldState.error}
|
||||
>
|
||||
<MenuItem value="desktop">
|
||||
{t("pages.createMonitor.form.general.option.strategy.desktop")}
|
||||
</MenuItem>
|
||||
<MenuItem value="mobile">
|
||||
{t("pages.createMonitor.form.general.option.strategy.mobile")}
|
||||
</MenuItem>
|
||||
</Select>
|
||||
)}
|
||||
/>
|
||||
)}
|
||||
|
||||
{/* Port field - only for port and game types */}
|
||||
{generalSettingsConfig.showPort && (
|
||||
<Controller
|
||||
|
||||
@@ -1,7 +1,13 @@
|
||||
import Stack from "@mui/material/Stack";
|
||||
import Box from "@mui/material/Box";
|
||||
import Typography from "@mui/material/Typography";
|
||||
import { Table, Pagination, StatusLabel } from "@/Components/design-elements";
|
||||
import {
|
||||
Table,
|
||||
Pagination,
|
||||
StatusLabel,
|
||||
StrategyBadge,
|
||||
} from "@/Components/design-elements";
|
||||
import { LAYOUT } from "@/Utils/Theme/constants";
|
||||
import { HistogramPageSpeed } from "@/Components/monitors";
|
||||
import { ArrowDown, ArrowUp } from "lucide-react";
|
||||
import type { Header } from "@/Components/design-elements/Table";
|
||||
@@ -179,7 +185,19 @@ export const PageSpeedMonitorsTable = ({
|
||||
</Stack>
|
||||
),
|
||||
render: (row) => {
|
||||
return row.name;
|
||||
return (
|
||||
<Stack
|
||||
direction="row"
|
||||
alignItems="center"
|
||||
gap={LAYOUT.XS}
|
||||
>
|
||||
<Typography>{row.name}</Typography>
|
||||
<StrategyBadge
|
||||
strategy={row.strategy}
|
||||
variant="caption"
|
||||
/>
|
||||
</Stack>
|
||||
);
|
||||
},
|
||||
},
|
||||
{
|
||||
|
||||
@@ -28,7 +28,7 @@ import { useStatusPageForm } from "@/Hooks/useStatusPageForm";
|
||||
import type { StatusPageFormData } from "@/Validation/statusPage";
|
||||
import { useGet, usePost, usePut, useDelete } from "@/Hooks/UseApi";
|
||||
import type { Monitor } from "@/Types/Monitor";
|
||||
import type { StatusPageType, StatusPageResponse } from "@/Types/StatusPage";
|
||||
import type { MonitorDisplayType, StatusPageResponse } from "@/Types/StatusPage";
|
||||
import { getMonitorTypeLabel } from "@/Types/StatusPage";
|
||||
import timezones from "@/Utils/timezones.json";
|
||||
import { useNavigate, useParams } from "react-router-dom";
|
||||
@@ -37,17 +37,9 @@ import { HeaderConfigStatusControls } from "./Components/HeaderConfigStatusContr
|
||||
|
||||
const monitorsUrl = (() => {
|
||||
const params = new URLSearchParams();
|
||||
[
|
||||
"http",
|
||||
"ping",
|
||||
"port",
|
||||
"docker",
|
||||
"game",
|
||||
"grpc",
|
||||
"websocket",
|
||||
"hardware",
|
||||
"pagespeed",
|
||||
].forEach((type) => params.append("type", type));
|
||||
["http", "ping", "port", "docker", "game", "grpc", "websocket", "hardware"].forEach(
|
||||
(type) => params.append("type", type)
|
||||
);
|
||||
return `/monitors/team?${params.toString()}`;
|
||||
})();
|
||||
|
||||
@@ -67,9 +59,7 @@ const CreateStatusPage = () => {
|
||||
// Fetch existing status page data when configuring
|
||||
const { data: statusPageData, isLoading: isLoadingStatusPage } =
|
||||
useGet<StatusPageResponse>(
|
||||
isCreate
|
||||
? null
|
||||
: `/status-page/${url}?type=uptime&type=infrastructure&type=pagespeed`
|
||||
isCreate ? null : `/status-page/${url}?type=uptime&type=infrastructure`
|
||||
);
|
||||
|
||||
const { data: monitorsResponse } = useGet<Monitor[]>(monitorsUrl);
|
||||
@@ -101,16 +91,14 @@ const CreateStatusPage = () => {
|
||||
}, [defaults, reset]);
|
||||
|
||||
const watchedMonitorIds: string[] = form.watch("monitors") ?? [];
|
||||
const computedTypes: StatusPageType[] = useMemo(() => {
|
||||
const computedTypes: MonitorDisplayType[] = useMemo(() => {
|
||||
const selectedMonitors = (watchedMonitorIds ?? [])
|
||||
.map((id) => monitors.find((m) => m.id === id))
|
||||
.filter((m): m is Monitor => m !== undefined);
|
||||
|
||||
const typesSet = new Set<StatusPageType>();
|
||||
const typesSet = new Set<MonitorDisplayType>();
|
||||
selectedMonitors.forEach((m) => {
|
||||
if (m.type === "hardware") typesSet.add("infrastructure");
|
||||
else if (m.type === "pagespeed") typesSet.add("pagespeed");
|
||||
else typesSet.add("uptime");
|
||||
typesSet.add(m.type === "hardware" ? "infrastructure" : "uptime");
|
||||
});
|
||||
|
||||
return typesSet.size ? Array.from(typesSet) : ["uptime"];
|
||||
@@ -151,7 +139,6 @@ const CreateStatusPage = () => {
|
||||
fd.append("showUptimePercentage", String(data.showUptimePercentage));
|
||||
fd.append("showAdminLoginLink", String(data.showAdminLoginLink));
|
||||
fd.append("showInfrastructure", String(data.showInfrastructure));
|
||||
fd.append("showPageSpeed", String(data.showPageSpeed));
|
||||
|
||||
data.monitors.forEach((monitorId) => {
|
||||
fd.append("monitors[]", monitorId);
|
||||
@@ -488,21 +475,6 @@ const CreateStatusPage = () => {
|
||||
/>
|
||||
)}
|
||||
/>
|
||||
<Controller
|
||||
name="showPageSpeed"
|
||||
control={control}
|
||||
render={({ field }) => (
|
||||
<FormControlLabel
|
||||
control={
|
||||
<Checkbox
|
||||
checked={field.value}
|
||||
onChange={field.onChange}
|
||||
/>
|
||||
}
|
||||
label={t("pages.statusPages.form.features.option.showPageSpeed.label")}
|
||||
/>
|
||||
)}
|
||||
/>
|
||||
{/* <Controller
|
||||
name="showUptimePercentage"
|
||||
control={control}
|
||||
|
||||
@@ -6,7 +6,6 @@ import { HistogramResponseTime, HeatmapResponseTime } from "@/Components/common"
|
||||
import { StatusLabel, BaseBox } from "@/Components/design-elements";
|
||||
import { SwitchComponent } from "@/Components/inputs";
|
||||
import { InfrastructureMetrics } from "@/Pages/StatusPage/Status/Components/InfrastructureMetrics";
|
||||
import { PageSpeedMetrics } from "@/Pages/StatusPage/Status/Components/PageSpeedMetrics";
|
||||
|
||||
import { useTheme, type Theme } from "@mui/material/styles";
|
||||
import { useSelector } from "react-redux";
|
||||
@@ -27,12 +26,8 @@ interface MonitorsListProps {
|
||||
}
|
||||
|
||||
const getMonitorBadgeStyles = (monitorType: string, theme: Theme) => {
|
||||
const monitorColors: Record<string, string> = {
|
||||
hardware: theme.palette.info.light,
|
||||
pagespeed: theme.palette.warning.light,
|
||||
};
|
||||
|
||||
const bg = monitorColors[monitorType] || theme.palette.success.light;
|
||||
const bg =
|
||||
monitorType === "hardware" ? theme.palette.info.light : theme.palette.success.light;
|
||||
return {
|
||||
backgroundColor: bg,
|
||||
color: theme.palette.background.paper,
|
||||
@@ -110,12 +105,6 @@ const MonitorContent = ({
|
||||
return <InfrastructureMetrics monitor={monitor} />;
|
||||
}
|
||||
|
||||
if (monitor.type === "pagespeed") {
|
||||
return statusPage.showPageSpeed === false ? null : (
|
||||
<PageSpeedMetrics monitor={monitor} />
|
||||
);
|
||||
}
|
||||
|
||||
if (statusPage.showCharts === false) return null;
|
||||
|
||||
const checks = monitor.checks?.slice().reverse() ?? [];
|
||||
|
||||
@@ -1,122 +0,0 @@
|
||||
import Typography from "@mui/material/Typography";
|
||||
import { Gauge } from "@/Components/design-elements";
|
||||
import { useTheme } from "@mui/material/styles";
|
||||
import { useTranslation } from "react-i18next";
|
||||
import type { Monitor } from "@/Types/Monitor";
|
||||
import type { CheckSnapshot } from "@/Types/Check";
|
||||
import Grid from "@mui/material/Grid";
|
||||
import Box from "@mui/material/Box";
|
||||
import { LAYOUT, SPACING } from "@/Utils/Theme/constants";
|
||||
import { getPageSpeedGaugeColor } from "@/Utils/MonitorUtils";
|
||||
|
||||
const GAUGE_RADIUS = 60;
|
||||
const GAUGE_STROKE_WIDTH = 12;
|
||||
|
||||
interface StatusPageMonitor extends Monitor {
|
||||
checks?: Monitor["recentChecks"];
|
||||
}
|
||||
|
||||
interface MetricConfig {
|
||||
key: string;
|
||||
label: string;
|
||||
progress: number;
|
||||
}
|
||||
|
||||
const MetricItem = ({ label, progress }: MetricConfig) => {
|
||||
const theme = useTheme();
|
||||
return (
|
||||
<Grid
|
||||
size={{ xs: 12, md: 3 }}
|
||||
display="flex"
|
||||
flexDirection="column"
|
||||
alignItems="center"
|
||||
textAlign="center"
|
||||
gap={theme.spacing(SPACING.LG)}
|
||||
padding={theme.spacing(LAYOUT.XS)}
|
||||
sx={{
|
||||
borderRight: { xs: "none", md: `1px solid ${theme.palette.divider}` },
|
||||
borderBottom: { xs: `1px solid ${theme.palette.divider}`, md: "none" },
|
||||
"&:last-child": {
|
||||
borderRight: "none",
|
||||
borderBottom: "none",
|
||||
paddingBottom: theme.spacing(SPACING.LG),
|
||||
},
|
||||
}}
|
||||
>
|
||||
<Box
|
||||
display="flex"
|
||||
flexDirection="column"
|
||||
alignItems="center"
|
||||
>
|
||||
<Gauge
|
||||
progress={progress}
|
||||
radius={GAUGE_RADIUS}
|
||||
strokeWidth={GAUGE_STROKE_WIDTH}
|
||||
colorFn={getPageSpeedGaugeColor}
|
||||
/>
|
||||
<Typography variant="body2">{label}</Typography>
|
||||
</Box>
|
||||
</Grid>
|
||||
);
|
||||
};
|
||||
|
||||
const buildMetrics = (check: CheckSnapshot, t: (key: string) => string): MetricConfig[] =>
|
||||
[
|
||||
{
|
||||
key: "performance",
|
||||
label: t("pages.statusPages.monitorsList.pagespeed.performance"),
|
||||
progress: check.performance,
|
||||
},
|
||||
{
|
||||
key: "accessibility",
|
||||
label: t("pages.statusPages.monitorsList.pagespeed.accessibility"),
|
||||
progress: check.accessibility,
|
||||
},
|
||||
{
|
||||
key: "bestPractices",
|
||||
label: t("pages.statusPages.monitorsList.pagespeed.bestPractices"),
|
||||
progress: check.bestPractices,
|
||||
},
|
||||
{
|
||||
key: "seo",
|
||||
label: t("pages.statusPages.monitorsList.pagespeed.seo"),
|
||||
progress: check.seo,
|
||||
},
|
||||
].filter((m): m is MetricConfig => m.progress !== undefined);
|
||||
|
||||
export const PageSpeedMetrics = ({ monitor }: { monitor: StatusPageMonitor }) => {
|
||||
const theme = useTheme();
|
||||
const { t } = useTranslation();
|
||||
|
||||
const latestCheck = monitor.recentChecks?.[0] ?? monitor.checks?.[0];
|
||||
|
||||
if (!latestCheck) {
|
||||
return (
|
||||
<Typography
|
||||
variant="body2"
|
||||
color={theme.palette.text.secondary}
|
||||
>
|
||||
{t("pages.statusPages.monitorsList.noData")}
|
||||
</Typography>
|
||||
);
|
||||
}
|
||||
|
||||
const metrics = buildMetrics(latestCheck, t);
|
||||
|
||||
return (
|
||||
<Grid
|
||||
container
|
||||
alignItems="center"
|
||||
padding={theme.spacing(LAYOUT.LG)}
|
||||
flex={1}
|
||||
>
|
||||
{metrics.map((metric) => (
|
||||
<MetricItem
|
||||
key={metric.key}
|
||||
label={metric.label}
|
||||
progress={metric.progress}
|
||||
/>
|
||||
))}
|
||||
</Grid>
|
||||
);
|
||||
};
|
||||
@@ -23,9 +23,7 @@ const StatusPageView = () => {
|
||||
const isSmall = useMediaQuery(theme.breakpoints.down("md"));
|
||||
const isPublic = location.pathname.startsWith("/status/public");
|
||||
|
||||
const apiUrl = url
|
||||
? `/status-page/${url}?type=uptime&type=infrastructure&type=pagespeed`
|
||||
: null;
|
||||
const apiUrl = url ? `/status-page/${url}?type=uptime&type=infrastructure` : null;
|
||||
|
||||
const { data, isLoading, error } = useGet<StatusPageResponse>(
|
||||
apiUrl,
|
||||
|
||||
@@ -38,6 +38,10 @@ export type MonitorStatus = (typeof MonitorStatuses)[number];
|
||||
|
||||
export type MonitorMatchMethod = "equal" | "include" | "regex" | "";
|
||||
|
||||
export const PageSpeedStrategies = ["desktop", "mobile"] as const;
|
||||
export type PageSpeedStrategy = (typeof PageSpeedStrategies)[number];
|
||||
export const DefaultPageSpeedStrategy: PageSpeedStrategy = "desktop";
|
||||
|
||||
export interface Monitor {
|
||||
id: string;
|
||||
userId: string;
|
||||
@@ -72,6 +76,7 @@ export interface Monitor {
|
||||
selectedDisks: string[];
|
||||
gameId?: string;
|
||||
grpcServiceName?: string;
|
||||
strategy?: PageSpeedStrategy;
|
||||
group: string | null;
|
||||
geoCheckEnabled?: boolean;
|
||||
geoCheckLocations?: GeoContinent[];
|
||||
|
||||
@@ -1,6 +1,5 @@
|
||||
import type { Monitor, MonitorType } from "@/Types/Monitor";
|
||||
export const StatusPageTypes = ["uptime", "infrastructure", "pagespeed"] as const;
|
||||
export type StatusPageType = (typeof StatusPageTypes)[number];
|
||||
export type MonitorDisplayType = "uptime" | "infrastructure";
|
||||
|
||||
export const MONITOR_TYPE_KEYS: Partial<Record<MonitorType, string>> = {
|
||||
http: "pages.common.monitors.monitorTypes.optionHttp",
|
||||
@@ -26,7 +25,7 @@ export interface StatusPage {
|
||||
id: string;
|
||||
userId: string;
|
||||
teamId: string;
|
||||
type: StatusPageType[];
|
||||
type: MonitorDisplayType[];
|
||||
companyName: string;
|
||||
url: string;
|
||||
timezone?: string;
|
||||
@@ -43,7 +42,6 @@ export interface StatusPage {
|
||||
showUptimePercentage: boolean;
|
||||
showAdminLoginLink: boolean;
|
||||
showInfrastructure: boolean;
|
||||
showPageSpeed: boolean;
|
||||
customCSS: string;
|
||||
createdAt: string;
|
||||
updatedAt: string;
|
||||
|
||||
@@ -78,12 +78,6 @@ export const getPageSpeedPalette = (score: number): PaletteKey => {
|
||||
else return "error";
|
||||
};
|
||||
|
||||
export const getPageSpeedGaugeColor = (val: number, theme: any) => {
|
||||
if (val >= 90) return theme.palette.success.main;
|
||||
else if (val >= 50) return theme.palette.warning.light;
|
||||
else return theme.palette.error.light;
|
||||
};
|
||||
|
||||
export const formatUrl = (url: string, maxLength: number = 55) => {
|
||||
if (!url) return "";
|
||||
|
||||
|
||||
@@ -1,5 +1,6 @@
|
||||
import { z } from "zod";
|
||||
import { GeoContinents } from "@/Types/GeoCheck";
|
||||
import { PageSpeedStrategies } from "@/Types/Monitor";
|
||||
|
||||
// URL schema with custom error message
|
||||
const urlSchema = z.url({ message: "Please enter a valid URL" });
|
||||
@@ -89,6 +90,7 @@ const grpcSchema = baseSchema.extend({
|
||||
const pagespeedSchema = baseSchema.extend({
|
||||
type: z.literal("pagespeed"),
|
||||
url: urlSchema,
|
||||
strategy: z.enum(PageSpeedStrategies),
|
||||
});
|
||||
|
||||
// Hardware/Infrastructure monitor schema
|
||||
|
||||
@@ -1,5 +1,4 @@
|
||||
import { z } from "zod";
|
||||
import { StatusPageTypes } from "@/Types/StatusPage";
|
||||
|
||||
export const statusPageSchema = z.object({
|
||||
companyName: z
|
||||
@@ -15,7 +14,9 @@ export const statusPageSchema = z.object({
|
||||
"URL can only contain lowercase letters, numbers, and hyphens"
|
||||
),
|
||||
timezone: z.string().optional(),
|
||||
type: z.array(z.enum(StatusPageTypes)).min(1, "At least one type is required"),
|
||||
type: z
|
||||
.array(z.enum(["uptime", "infrastructure"]))
|
||||
.min(1, "At least one type is required"),
|
||||
color: z.string().min(1, "Color is required"),
|
||||
monitors: z.array(z.string()).min(1, "At least one monitor is required"),
|
||||
isPublished: z.boolean(),
|
||||
@@ -23,7 +24,6 @@ export const statusPageSchema = z.object({
|
||||
showUptimePercentage: z.boolean(),
|
||||
showAdminLoginLink: z.boolean(),
|
||||
showInfrastructure: z.boolean(),
|
||||
showPageSpeed: z.boolean(),
|
||||
customCSS: z.string().optional(),
|
||||
logo: z
|
||||
.object({
|
||||
|
||||
@@ -324,7 +324,6 @@ const statusPageValidation = joi.object({
|
||||
showCharts: joi.boolean(),
|
||||
showAdminLoginLink: joi.boolean(),
|
||||
showInfrastructure: joi.boolean(),
|
||||
showPageSpeed: joi.boolean(),
|
||||
});
|
||||
|
||||
const settingsValidation = joi.object({
|
||||
|
||||
@@ -503,6 +503,11 @@
|
||||
"wsUrl": {
|
||||
"label": "WebSocket URL",
|
||||
"placeholder": "wss://example.com/socket"
|
||||
},
|
||||
"strategy": {
|
||||
"label": "Strategy",
|
||||
"desktop": "Desktop",
|
||||
"mobile": "Mobile"
|
||||
}
|
||||
},
|
||||
"title": "General settings",
|
||||
@@ -968,6 +973,10 @@
|
||||
}
|
||||
},
|
||||
"pageSpeed": {
|
||||
"strategy": {
|
||||
"desktop": "Desktop",
|
||||
"mobile": "Mobile"
|
||||
},
|
||||
"charts": {
|
||||
"common": {
|
||||
"cls": "Cumulative Layout Shift (CLS)",
|
||||
@@ -1202,13 +1211,6 @@
|
||||
"used": "Used",
|
||||
"total": "Total"
|
||||
},
|
||||
"pagespeed": {
|
||||
"title": "PageSpeed",
|
||||
"performance": "Performance",
|
||||
"accessibility": "Accessibility",
|
||||
"bestPractices": "Best Practices",
|
||||
"seo": "SEO"
|
||||
},
|
||||
"uptime": {
|
||||
"title": "Uptime",
|
||||
"responseTime": "Response time"
|
||||
@@ -1307,9 +1309,6 @@
|
||||
},
|
||||
"showInfrastructure": {
|
||||
"label": "Show infrastructure metrics"
|
||||
},
|
||||
"showPageSpeed": {
|
||||
"label": "Show PageSpeed scores"
|
||||
}
|
||||
}
|
||||
}
|
||||
|
||||
@@ -3631,6 +3631,12 @@
|
||||
"type": "string",
|
||||
"default": ""
|
||||
},
|
||||
"strategy": {
|
||||
"type": "string",
|
||||
"enum": ["desktop", "mobile"],
|
||||
"default": "desktop",
|
||||
"description": "PageSpeed analysis strategy"
|
||||
},
|
||||
"selectedDisks": {
|
||||
"type": "array",
|
||||
"items": {
|
||||
@@ -3737,6 +3743,11 @@
|
||||
"grpcServiceName": {
|
||||
"type": "string"
|
||||
},
|
||||
"strategy": {
|
||||
"type": "string",
|
||||
"enum": ["desktop", "mobile"],
|
||||
"description": "PageSpeed analysis strategy"
|
||||
},
|
||||
"selectedDisks": {
|
||||
"type": "array",
|
||||
"items": {
|
||||
|
||||
@@ -1,15 +0,0 @@
|
||||
import type { Pool } from "pg";
|
||||
|
||||
export const addShowPageSpeedToStatusPages = async (pool: Pool) => {
|
||||
await pool.query(`
|
||||
ALTER TABLE status_pages
|
||||
ADD COLUMN IF NOT EXISTS show_page_speed BOOLEAN DEFAULT FALSE;
|
||||
`);
|
||||
};
|
||||
|
||||
export const dropShowPageSpeedFromStatusPages = async (pool: Pool) => {
|
||||
await pool.query(`
|
||||
ALTER TABLE status_pages
|
||||
DROP COLUMN IF EXISTS show_page_speed;
|
||||
`);
|
||||
};
|
||||
@@ -0,0 +1,15 @@
|
||||
import type { Pool } from "pg";
|
||||
|
||||
export const addStrategyToMonitors = async (pool: Pool) => {
|
||||
await pool.query(`
|
||||
ALTER TABLE monitors
|
||||
ADD COLUMN IF NOT EXISTS strategy TEXT DEFAULT NULL;
|
||||
`);
|
||||
};
|
||||
|
||||
export const dropStrategyFromMonitors = async (pool: Pool) => {
|
||||
await pool.query(`
|
||||
ALTER TABLE monitors
|
||||
DROP COLUMN IF EXISTS strategy;
|
||||
`);
|
||||
};
|
||||
@@ -21,7 +21,7 @@ import { createStatusPages, dropStatusPages } from "./0018_create_status_pages.j
|
||||
import { createAppSettings, dropAppSettings } from "./0019_create_app_settings.js";
|
||||
import { createContinuousAggregates, dropContinuousAggregates } from "./0020_create_continuous_aggregates.js";
|
||||
import { createRetentionCompression, dropRetentionCompression } from "./0021_create_retention_compression.js";
|
||||
import { addShowPageSpeedToStatusPages, dropShowPageSpeedFromStatusPages } from "./0022_add_show_page_speed_to_status_pages.js";
|
||||
import { addStrategyToMonitors, dropStrategyFromMonitors } from "./0022_add_strategy_to_monitors.js";
|
||||
|
||||
const SERVICE_NAME = "TimescaleDB Migrations";
|
||||
|
||||
@@ -53,7 +53,7 @@ const migrations: MigrationEntry[] = [
|
||||
{ name: "0019_create_app_settings", up: createAppSettings, down: dropAppSettings },
|
||||
{ name: "0020_create_continuous_aggregates", up: createContinuousAggregates, down: dropContinuousAggregates },
|
||||
{ name: "0021_create_retention_compression", up: createRetentionCompression, down: dropRetentionCompression },
|
||||
{ name: "0022_add_show_page_speed_to_status_pages", up: addShowPageSpeedToStatusPages, down: dropShowPageSpeedFromStatusPages },
|
||||
{ name: "0022_add_strategy_to_monitors", up: addStrategyToMonitors, down: dropStrategyFromMonitors },
|
||||
];
|
||||
|
||||
const ensureMigrationsTable = async (pool: Pool) => {
|
||||
|
||||
@@ -1,6 +1,6 @@
|
||||
import { Schema, model, Types } from "mongoose";
|
||||
import type { Monitor, MonitorMatchMethod, CheckSnapshot } from "@/types/monitor.js";
|
||||
import { MonitorTypes, MonitorStatuses } from "@/types/monitor.js";
|
||||
import { MonitorTypes, MonitorStatuses, PageSpeedStrategies } from "@/types/monitor.js";
|
||||
import type {
|
||||
CheckAudits,
|
||||
CheckCaptureInfo,
|
||||
@@ -330,6 +330,10 @@ const MonitorSchema = new Schema<MonitorDocument>(
|
||||
type: String,
|
||||
default: "",
|
||||
},
|
||||
strategy: {
|
||||
type: String,
|
||||
enum: PageSpeedStrategies,
|
||||
},
|
||||
group: {
|
||||
type: String,
|
||||
trim: true,
|
||||
|
||||
@@ -104,10 +104,6 @@ const StatusPageSchema = new Schema<StatusPageDocument>(
|
||||
type: Boolean,
|
||||
default: false,
|
||||
},
|
||||
showPageSpeed: {
|
||||
type: Boolean,
|
||||
default: false,
|
||||
},
|
||||
customCSS: {
|
||||
type: String,
|
||||
default: "",
|
||||
|
||||
@@ -386,6 +386,7 @@ class MongoMonitorsRepository implements IMonitorsRepository {
|
||||
selectedDisks: doc.selectedDisks ?? [],
|
||||
gameId: doc.gameId ?? undefined,
|
||||
grpcServiceName: doc.grpcServiceName ?? undefined,
|
||||
strategy: doc.strategy ?? undefined,
|
||||
group: doc.group ?? null,
|
||||
recentChecks: (doc.recentChecks ?? []).map((check: CheckSnapshotDocument) => this.toCheckSnapshot(check)),
|
||||
geoCheckEnabled: doc.geoCheckEnabled ?? false,
|
||||
@@ -445,6 +446,7 @@ class MongoMonitorsRepository implements IMonitorsRepository {
|
||||
selectedDisks: doc.selectedDisks ?? [],
|
||||
gameId: doc.gameId ?? undefined,
|
||||
grpcServiceName: doc.grpcServiceName ?? undefined,
|
||||
strategy: doc.strategy ?? undefined,
|
||||
group: doc.group ?? null,
|
||||
recentChecks: (doc.recentChecks ?? []).map((check: CheckSnapshotDocument) => this.toCheckSnapshot(check)),
|
||||
geoCheckEnabled: doc.geoCheckEnabled ?? false,
|
||||
|
||||
@@ -1,5 +1,6 @@
|
||||
import type { Pool } from "pg";
|
||||
import type { Monitor, MonitorsSummary, MonitorStatus, MonitorType, MonitorMatchMethod, GeoContinent } from "@/types/monitor.js";
|
||||
import type { Monitor, MonitorsSummary, MonitorStatus, MonitorType, MonitorMatchMethod, GeoContinent, PageSpeedStrategy } from "@/types/monitor.js";
|
||||
|
||||
import type { IMonitorsRepository, TeamQueryConfig, SummaryConfig } from "./IMonitorsRepository.js";
|
||||
import { AppError } from "@/utils/AppError.js";
|
||||
|
||||
@@ -36,6 +37,7 @@ interface MonitorRow {
|
||||
selected_disks: string[] | null;
|
||||
game_id: string | null;
|
||||
grpc_service_name: string | null;
|
||||
strategy: PageSpeedStrategy | null;
|
||||
monitor_group: string | null;
|
||||
geo_check_enabled: boolean;
|
||||
geo_check_locations: GeoContinent[] | null;
|
||||
@@ -49,7 +51,7 @@ const MONITOR_COLUMNS = `id, user_id, team_id, name, description, type, status,
|
||||
interval_ms, is_active, status_window, status_window_size, status_window_threshold, uptime_percentage,
|
||||
cpu_alert_threshold, cpu_alert_counter, memory_alert_threshold, memory_alert_counter,
|
||||
disk_alert_threshold, disk_alert_counter, temp_alert_threshold, temp_alert_counter, selected_disks,
|
||||
game_id, grpc_service_name, monitor_group, geo_check_enabled, geo_check_locations, geo_check_interval_ms,
|
||||
game_id, grpc_service_name, strategy, monitor_group, geo_check_enabled, geo_check_locations, geo_check_interval_ms,
|
||||
created_at, updated_at`;
|
||||
|
||||
export class TimescaleMonitorsRepository implements IMonitorsRepository {
|
||||
@@ -62,8 +64,8 @@ export class TimescaleMonitorsRepository implements IMonitorsRepository {
|
||||
interval_ms, is_active, status_window, status_window_size, status_window_threshold,
|
||||
cpu_alert_threshold, cpu_alert_counter, memory_alert_threshold, memory_alert_counter,
|
||||
disk_alert_threshold, disk_alert_counter, temp_alert_threshold, temp_alert_counter, selected_disks,
|
||||
game_id, grpc_service_name, monitor_group, geo_check_enabled, geo_check_locations, geo_check_interval_ms)
|
||||
VALUES ($1,$2,$3,$4,$5,$6,$7,$8,$9,$10,$11,$12,$13,$14,$15,$16,$17,$18,$19,$20,$21,$22,$23,$24,$25,$26,$27,$28,$29,$30,$31,$32,$33,$34)
|
||||
game_id, grpc_service_name, strategy, monitor_group, geo_check_enabled, geo_check_locations, geo_check_interval_ms)
|
||||
VALUES ($1,$2,$3,$4,$5,$6,$7,$8,$9,$10,$11,$12,$13,$14,$15,$16,$17,$18,$19,$20,$21,$22,$23,$24,$25,$26,$27,$28,$29,$30,$31,$32,$33,$34,$35)
|
||||
RETURNING ${MONITOR_COLUMNS}`,
|
||||
[
|
||||
userId,
|
||||
@@ -96,6 +98,7 @@ export class TimescaleMonitorsRepository implements IMonitorsRepository {
|
||||
monitor.selectedDisks ?? [],
|
||||
monitor.gameId ?? null,
|
||||
monitor.grpcServiceName ?? null,
|
||||
monitor.strategy ?? null,
|
||||
monitor.group ?? null,
|
||||
monitor.geoCheckEnabled ?? false,
|
||||
monitor.geoCheckLocations ?? [],
|
||||
@@ -594,6 +597,7 @@ export class TimescaleMonitorsRepository implements IMonitorsRepository {
|
||||
["selectedDisks", "selected_disks"],
|
||||
["gameId", "game_id"],
|
||||
["grpcServiceName", "grpc_service_name"],
|
||||
["strategy", "strategy"],
|
||||
["group", "monitor_group"],
|
||||
["geoCheckEnabled", "geo_check_enabled"],
|
||||
["geoCheckLocations", "geo_check_locations"],
|
||||
@@ -1033,6 +1037,7 @@ export class TimescaleMonitorsRepository implements IMonitorsRepository {
|
||||
selectedDisks: row.selected_disks ?? [],
|
||||
gameId: row.game_id ?? undefined,
|
||||
grpcServiceName: row.grpc_service_name ?? undefined,
|
||||
strategy: row.strategy ?? undefined,
|
||||
group: row.monitor_group,
|
||||
geoCheckEnabled: row.geo_check_enabled,
|
||||
geoCheckLocations: row.geo_check_locations ?? [],
|
||||
|
||||
@@ -58,7 +58,6 @@ class MongoStatusPagesRepository implements IStatusPagesRepository {
|
||||
showUptimePercentage: doc.showUptimePercentage,
|
||||
showAdminLoginLink: doc.showAdminLoginLink,
|
||||
showInfrastructure: doc.showInfrastructure,
|
||||
showPageSpeed: doc.showPageSpeed,
|
||||
customCSS: doc.customCSS,
|
||||
createdAt: this.toDateString(doc.createdAt),
|
||||
updatedAt: this.toDateString(doc.updatedAt),
|
||||
|
||||
@@ -26,7 +26,6 @@ interface StatusPageRow {
|
||||
show_uptime_percentage: boolean;
|
||||
show_admin_login_link: boolean;
|
||||
show_infrastructure: boolean;
|
||||
show_page_speed: boolean;
|
||||
custom_css: string | null;
|
||||
created_at: Date;
|
||||
updated_at: Date;
|
||||
@@ -34,7 +33,7 @@ interface StatusPageRow {
|
||||
|
||||
const COLUMNS = `id, user_id, team_id, types, company_name, url, timezone, color,
|
||||
logo_data, logo_content_type, is_published, show_charts, show_uptime_percentage,
|
||||
show_admin_login_link, show_infrastructure, show_page_speed, custom_css, created_at, updated_at`;
|
||||
show_admin_login_link, show_infrastructure, custom_css, created_at, updated_at`;
|
||||
|
||||
export class TimescaleStatusPagesRepository implements IStatusPagesRepository {
|
||||
constructor(private pool: Pool) {}
|
||||
@@ -43,8 +42,8 @@ export class TimescaleStatusPagesRepository implements IStatusPagesRepository {
|
||||
const result = await this.pool.query<StatusPageRow>(
|
||||
`INSERT INTO status_pages (user_id, team_id, types, company_name, url, timezone, color,
|
||||
logo_data, logo_content_type, is_published, show_charts, show_uptime_percentage,
|
||||
show_admin_login_link, show_infrastructure, show_page_speed, custom_css)
|
||||
VALUES ($1,$2,$3,$4,$5,$6,$7,$8,$9,$10,$11,$12,$13,$14,$15,$16)
|
||||
show_admin_login_link, show_infrastructure, custom_css)
|
||||
VALUES ($1,$2,$3,$4,$5,$6,$7,$8,$9,$10,$11,$12,$13,$14,$15)
|
||||
RETURNING ${COLUMNS}`,
|
||||
[
|
||||
userId,
|
||||
@@ -61,7 +60,6 @@ export class TimescaleStatusPagesRepository implements IStatusPagesRepository {
|
||||
data.showUptimePercentage ?? false,
|
||||
data.showAdminLoginLink ?? false,
|
||||
data.showInfrastructure ?? false,
|
||||
data.showPageSpeed ?? false,
|
||||
data.customCSS ?? null,
|
||||
]
|
||||
);
|
||||
@@ -130,7 +128,6 @@ export class TimescaleStatusPagesRepository implements IStatusPagesRepository {
|
||||
["showUptimePercentage", "show_uptime_percentage"],
|
||||
["showAdminLoginLink", "show_admin_login_link"],
|
||||
["showInfrastructure", "show_infrastructure"],
|
||||
["showPageSpeed", "show_page_speed"],
|
||||
["customCSS", "custom_css"],
|
||||
];
|
||||
|
||||
@@ -255,7 +252,6 @@ export class TimescaleStatusPagesRepository implements IStatusPagesRepository {
|
||||
showUptimePercentage: row.show_uptime_percentage,
|
||||
showAdminLoginLink: row.show_admin_login_link,
|
||||
showInfrastructure: row.show_infrastructure,
|
||||
showPageSpeed: row.show_page_speed,
|
||||
customCSS: row.custom_css ?? "",
|
||||
createdAt: row.created_at.toISOString(),
|
||||
updatedAt: row.updated_at.toISOString(),
|
||||
|
||||
@@ -146,7 +146,8 @@ export class SuperSimpleQueue implements ISuperSimpleQueue {
|
||||
|
||||
deleteJob = async (monitor: Monitor) => {
|
||||
this.scheduler.removeJob(monitor.id);
|
||||
this.scheduler.removeJob(`${monitor.id}-geo`);
|
||||
const geoJob = await this.scheduler.getJob(`${monitor.id}-geo`);
|
||||
if (geoJob) await this.scheduler.removeJob(`${monitor.id}-geo`);
|
||||
};
|
||||
|
||||
pauseJob = async (monitor: Monitor) => {
|
||||
@@ -154,7 +155,9 @@ export class SuperSimpleQueue implements ISuperSimpleQueue {
|
||||
if (result === false) {
|
||||
throw new Error("Failed to pause monitor");
|
||||
}
|
||||
await this.scheduler.pauseJob(`${monitor.id}-geo`);
|
||||
const geoJob = await this.scheduler.getJob(`${monitor.id}-geo`);
|
||||
if (geoJob) await this.scheduler.removeJob(`${monitor.id}-geo`);
|
||||
|
||||
this.logger.debug({
|
||||
message: `Paused monitor ${monitor.id}`,
|
||||
service: SERVICE_NAME,
|
||||
@@ -177,31 +180,35 @@ export class SuperSimpleQueue implements ISuperSimpleQueue {
|
||||
});
|
||||
};
|
||||
|
||||
private syncGeoJob = async (monitor: Monitor) => {
|
||||
const geoJobId = `${monitor.id}-geo`;
|
||||
const existingGeoJob = await this.scheduler.getJob(geoJobId);
|
||||
|
||||
// If geoChecks have been disabled, or the monitor type doesn't support them, remove
|
||||
if (!monitor.geoCheckEnabled || !supportsGeoCheck(monitor.type)) {
|
||||
if (existingGeoJob) this.scheduler.removeJob(geoJobId);
|
||||
return;
|
||||
}
|
||||
|
||||
// If the job exists, update it
|
||||
if (existingGeoJob) {
|
||||
this.scheduler.updateJob(geoJobId, { repeat: monitor.geoCheckInterval, active: monitor.isActive, data: monitor });
|
||||
return;
|
||||
}
|
||||
|
||||
// Otherwise, create it
|
||||
this.scheduler.addJob({
|
||||
id: geoJobId,
|
||||
template: "geo-check-job",
|
||||
repeat: monitor.geoCheckInterval,
|
||||
active: monitor.isActive,
|
||||
data: monitor,
|
||||
});
|
||||
};
|
||||
|
||||
updateJob = async (monitor: Monitor) => {
|
||||
this.scheduler.updateJob(monitor.id, { repeat: monitor.interval, data: monitor });
|
||||
|
||||
// Handle geo check job lifecycle
|
||||
const geoJobId = `${monitor.id}-geo`;
|
||||
if (monitor.geoCheckEnabled && supportsGeoCheck(monitor.type)) {
|
||||
// Check if geo job exists
|
||||
const existingGeoJob = await this.scheduler.getJob(geoJobId);
|
||||
if (existingGeoJob) {
|
||||
// Update existing geo job
|
||||
this.scheduler.updateJob(geoJobId, { repeat: monitor.geoCheckInterval, active: monitor.isActive, data: monitor });
|
||||
} else {
|
||||
// Create new geo job
|
||||
this.scheduler.addJob({
|
||||
id: geoJobId,
|
||||
template: "geo-check-job",
|
||||
repeat: monitor.geoCheckInterval,
|
||||
active: monitor.isActive,
|
||||
data: monitor,
|
||||
});
|
||||
}
|
||||
} else {
|
||||
// Remove geo job if disabled or monitor type changed
|
||||
this.scheduler.removeJob(geoJobId);
|
||||
}
|
||||
await this.syncGeoJob(monitor);
|
||||
};
|
||||
|
||||
shutdown = async () => {
|
||||
|
||||
@@ -1,6 +1,6 @@
|
||||
import { IStatusProvider } from "@/service/infrastructure/network/IStatusProvider.js";
|
||||
import { MonitorStatusResponse, PageSpeedStatusPayload } from "@/types/network.js";
|
||||
import { Monitor, MonitorType } from "@/types/monitor.js";
|
||||
import { Monitor, MonitorType, DefaultPageSpeedStrategy } from "@/types/monitor.js";
|
||||
import { HttpProvider } from "@/service/infrastructure/network/HttpProvider.js";
|
||||
import { ISettingsService } from "@/service/system/settingsService.js";
|
||||
import { ILogger } from "@/utils/logger.js";
|
||||
@@ -19,14 +19,15 @@ export class PageSpeedProvider implements IStatusProvider<PageSpeedStatusPayload
|
||||
}
|
||||
|
||||
async handle(monitor: Monitor): Promise<MonitorStatusResponse<PageSpeedStatusPayload>> {
|
||||
const { url } = monitor;
|
||||
const { url, strategy } = monitor;
|
||||
try {
|
||||
if (!url) throw new Error("URL is required for PageSpeed monitor");
|
||||
const dbSettings = await this.settingsService.getDBSettings();
|
||||
const apiKey = dbSettings?.pagespeedApiKey;
|
||||
const resolvedStrategy = strategy ?? DefaultPageSpeedStrategy;
|
||||
let pageSpeedUrl = `https://pagespeedonline.googleapis.com/pagespeedonline/v5/runPagespeed?url=${encodeURIComponent(
|
||||
url
|
||||
)}&category=seo&category=accessibility&category=best-practices&category=performance`;
|
||||
)}&strategy=${encodeURIComponent(resolvedStrategy)}&category=seo&category=accessibility&category=best-practices&category=performance`;
|
||||
|
||||
if (apiKey) {
|
||||
pageSpeedUrl += `&key=${apiKey}`;
|
||||
|
||||
@@ -249,6 +249,9 @@ export class StatusService implements IStatusService {
|
||||
};
|
||||
}
|
||||
|
||||
// With a full window, a single raw check must not change monitor.status; only the sliding-window threshold can trigger a transition.
|
||||
newStatus = monitor.status;
|
||||
|
||||
// Check if threshold has been met
|
||||
const failures = monitor.statusWindow.filter((s) => s === false).length;
|
||||
const failureRate = (failures / monitor.statusWindow.length) * 100;
|
||||
|
||||
@@ -6,6 +6,10 @@ export type { GeoContinent } from "@/types/geoCheck.js";
|
||||
export const MonitorTypes = ["http", "ping", "pagespeed", "hardware", "docker", "port", "game", "grpc", "websocket", "unknown"] as const;
|
||||
export type MonitorType = (typeof MonitorTypes)[number];
|
||||
|
||||
export const PageSpeedStrategies = ["desktop", "mobile"] as const;
|
||||
export type PageSpeedStrategy = (typeof PageSpeedStrategies)[number];
|
||||
export const DefaultPageSpeedStrategy: PageSpeedStrategy = "desktop";
|
||||
|
||||
export const GeoCheckSupportedTypes: readonly MonitorType[] = ["http", "ping"] as const;
|
||||
export const supportsGeoCheck = (type: MonitorType): boolean => GeoCheckSupportedTypes.includes(type);
|
||||
|
||||
@@ -49,6 +53,7 @@ export interface Monitor {
|
||||
selectedDisks: string[];
|
||||
gameId?: string;
|
||||
grpcServiceName?: string;
|
||||
strategy?: PageSpeedStrategy;
|
||||
group: string | null;
|
||||
geoCheckEnabled?: boolean;
|
||||
geoCheckLocations?: GeoContinent[];
|
||||
|
||||
@@ -1,4 +1,4 @@
|
||||
export const StatusPageTypes = ["uptime", "infrastructure", "pagespeed"] as const;
|
||||
export const StatusPageTypes = ["uptime", "infrastructure"] as const;
|
||||
export type StatusPageType = (typeof StatusPageTypes)[number];
|
||||
|
||||
export interface StatusPageLogo {
|
||||
@@ -29,7 +29,6 @@ export interface StatusPage {
|
||||
showUptimePercentage: boolean;
|
||||
showAdminLoginLink: boolean;
|
||||
showInfrastructure: boolean;
|
||||
showPageSpeed: boolean;
|
||||
customCSS: string;
|
||||
createdAt: string;
|
||||
updatedAt: string;
|
||||
|
||||
@@ -1,7 +1,7 @@
|
||||
import { z } from "zod";
|
||||
import { booleanCoercion } from "./shared.js";
|
||||
import { GeoContinents } from "@/types/geoCheck.js";
|
||||
import { MonitorMatchMethods, MonitorTypes } from "@/types/monitor.js";
|
||||
import { MonitorMatchMethods, MonitorTypes, PageSpeedStrategies, DefaultPageSpeedStrategy } from "@/types/monitor.js";
|
||||
|
||||
export const getMonitorByIdParamValidation = z.object({
|
||||
monitorId: z.string().min(1, "Monitor ID is required"),
|
||||
@@ -73,6 +73,7 @@ export const createMonitorBodyValidation = z.object({
|
||||
matchMethod: z.union([z.enum(MonitorMatchMethods), z.literal("")]).optional(),
|
||||
gameId: z.union([z.string(), z.literal("")]).optional(),
|
||||
grpcServiceName: z.union([z.string(), z.literal("")]).default(""),
|
||||
strategy: z.enum(PageSpeedStrategies).optional(),
|
||||
selectedDisks: z.array(z.string()).optional(),
|
||||
group: z.union([z.string().max(50).trim(), z.null(), z.literal("")]).optional(),
|
||||
geoCheckEnabled: z.boolean().optional(),
|
||||
@@ -102,6 +103,7 @@ export const editMonitorBodyValidation = z.object({
|
||||
tempAlertThreshold: z.number().optional(),
|
||||
gameId: z.union([z.string(), z.literal("")]).optional(),
|
||||
grpcServiceName: z.union([z.string(), z.literal("")]).optional(),
|
||||
strategy: z.enum(PageSpeedStrategies).optional(),
|
||||
selectedDisks: z.array(z.string()).optional(),
|
||||
group: z.union([z.string().max(50).trim(), z.null(), z.literal("")]).optional(),
|
||||
geoCheckEnabled: z.boolean().optional(),
|
||||
@@ -156,6 +158,7 @@ const importedMonitorSchema = z.object({
|
||||
selectedDisks: z.array(z.string()).default([]),
|
||||
gameId: z.union([z.string(), z.literal("")]).optional(),
|
||||
grpcServiceName: z.union([z.string(), z.literal("")]).default(""),
|
||||
strategy: z.enum(PageSpeedStrategies).default(DefaultPageSpeedStrategy),
|
||||
group: z.union([z.string().max(50).trim(), z.null()]).default(null),
|
||||
geoCheckEnabled: z.boolean().default(false),
|
||||
geoCheckLocations: z.array(z.enum(GeoContinents)).default([]),
|
||||
|
||||
@@ -32,7 +32,6 @@ export const createStatusPageBodyValidation = z
|
||||
showUptimePercentage: booleanCoercion,
|
||||
showAdminLoginLink: booleanCoercion.optional(),
|
||||
showInfrastructure: booleanCoercion.optional(),
|
||||
showPageSpeed: booleanCoercion.optional(),
|
||||
removeLogo: z.union([z.literal("true"), z.literal("false")]).optional(),
|
||||
})
|
||||
.strip();
|
||||
|
||||
Reference in new issue
Block a user