Compare commits
19
Commits
| Author | SHA1 | Date | |
|---|---|---|---|
 gorkem-bwl |
f85903adc9 | ||
|
gorkem-bwl
|
a7895cce32 | ||
|
gorkem-bwl
|
8e4e9dd87c | ||
|
gorkem-bwl
|
0d25973efb | ||
|
gorkem-bwl
|
e69f40fdd0 | ||
|
gorkem-bwl
|
9aa2594df7 | ||
 ashu130698 |
9027707c92 | ||
|
ashu130698
|
9e69d863df | ||
|
ashu130698
|
c740fb1aca | ||
|
ashu130698
|
3c05b9df98 | ||
|
ashu130698
|
d5d79a1eda | ||
|
ashu130698
|
2097bc477a | ||
|
ashu130698
|
744d8c8dcf | ||
|
ashu130698
|
7a5ee6ba05 | ||
|
ashu130698
|
eeee6db94e | ||
|
ashu130698
|
656c04d0e4 | ||
|
ashu130698
|
010ef9661f | ||
|
ashu130698
|
ff0ef928a6 | ||
|
ashu130698
|
eb29a725c2 |
No files matched your search
@@ -68,23 +68,19 @@ VITE_APP_LOG_LEVEL="debug"
|
||||
### Backend Layers
|
||||
```
|
||||
server/src/
|
||||
├── api/ # HTTP layer
|
||||
│ ├── controllers/ # Route handlers (authController, monitorController, etc.)
|
||||
│ ├── middleware/ # verifyJWT, rateLimiter, sanitization, responseHandler
|
||||
│ ├── routes/ # API route definitions
|
||||
│ └── validation/ # Zod request-payload schemas
|
||||
├── domain/ # Business logic + data access, one folder per entity
|
||||
│ ├── monitors/ # e.g. monitor.service.ts, monitor.repository.ts, monitor.type.ts
|
||||
│ ├── checks/
|
||||
│ ├── incidents/
|
||||
│ └── … # users, teams, status-pages, notifications, etc.
|
||||
├── service/ # Cross-cutting services (e.g. infrastructure/)
|
||||
├── config/ # App config wiring (controllers, routes, services, envValidation)
|
||||
├── controllers/ # Route handlers (authController, monitorController, etc.)
|
||||
├── service/ # Business logic
|
||||
│ ├── business/ # Core monitoring logic
|
||||
│ ├── infrastructure/ # Server/system utilities
|
||||
│ └── system/ # App-level settings
|
||||
├── db/
|
||||
│ └── migration/ # Database migrations (run on startup)
|
||||
├── templates/ # Email/notification templates
|
||||
├── types/ # Shared const tuples + derived types
|
||||
└── utils/ # Shared utilities
|
||||
│ ├── models/ # Mongoose schemas (Monitor, Check, Incident, User, etc.)
|
||||
│ ├── migration/ # Database migrations (run on startup)
|
||||
│ └── modules/ # Database-specific modules
|
||||
├── middleware/v1/ # verifyJWT, rateLimiter, sanitization, responseHandler
|
||||
├── routes/v1/ # API route definitions
|
||||
├── validation/ # Joi input validation schemas
|
||||
└── repositories/ # Data access layer
|
||||
```
|
||||
|
||||
### Frontend Structure
|
||||
|
||||
@@ -151,7 +151,6 @@ LOG_LEVEL="debug"
|
||||
- `ORIGIN`: Origin for CORS purposes
|
||||
- `TOKEN_TTL`: Token time to live (in vercel/ms format)
|
||||
- `LOG_LEVEL`: Debug level (debug, info, warn, error)
|
||||
- `QUEUE_TYPE`: Job queue implementation (`superSimpleQueue` or `lessSimpleQueue`, optional, default: `superSimpleQueue`)
|
||||
|
||||
Start the backend server:
|
||||
|
||||
|
||||
+172
@@ -0,0 +1,172 @@
|
||||
<p align=center> <a href="https://trendshift.io/repositories/12443" target="_blank"><img src="https://trendshift.io/api/badge/repositories/12443" alt="bluewave-labs%2Fcheckmate | Trendshift" style="width: 250px; height: 55px;" width="250" height="55"/></a></p>
|
||||
|
||||

|
||||

|
||||

|
||||

|
||||

|
||||

|
||||

|
||||
[](https://www.bestpractices.dev/projects/9901)
|
||||
[](https://deepwiki.com/bluewave-labs/checkmate)
|
||||
|
||||
<h1 align="center"><a href="https://bluewavelabs.ca" target="_blank">Checkmate</a></h1>
|
||||
|
||||
<p align="center"><strong>Una aplicación de código abierto para monitoreo de infraestructura y tiempo de actividad</strong></p>
|
||||
|
||||
<img width="1660" alt="image" src="https://github.com/user-attachments/assets/b748f36d-a271-4965-ad0a-18bf153bbee7" />
|
||||
|
||||
Este repositorio contiene tanto el frontend como el backend de Checkmate, una herramienta de monitoreo de código abierto y autoalojada para rastrear hardware de servidores, tiempo de actividad, tiempos de respuesta e incidentes en tiempo real con visualizaciones atractivas. Checkmate revisa regularmente si un servidor o sitio web es accesible y funciona de manera óptima, proporcionando alertas e informes en tiempo real sobre la disponibilidad, el tiempo de inactividad y el tiempo de respuesta de los servicios monitoreados.
|
||||
|
||||
Checkmate también tiene un agente llamado [Capture](https://github.com/bluewave-labs/capture), para recuperar datos de servidores remotos. Aunque Capture no es obligatorio para ejecutar Checkmate, proporciona información adicional sobre el estado de la CPU, RAM, disco y temperatura de tus servidores.
|
||||
|
||||
Checkmate ha sido probado con más de 1000 monitores activos sin problemas ni cuellos de botella de rendimiento.
|
||||
|
||||
**Si deseas patrocinar una función, [visita este enlace](https://checkmate.so/sponsored-features).**
|
||||
|
||||
## 📚 Tabla de contenidos
|
||||
|
||||
- [📦 Demo](#demo)
|
||||
- [🔗 Guía del usuario](#guía-del-usuario)
|
||||
- [🛠️ Instalación](#instalación)
|
||||
- [🏁 Traducciones](#traducciones)
|
||||
- [🚀 Rendimiento](#rendimiento)
|
||||
- [💚 Preguntas e ideas](#preguntas-e-ideas)
|
||||
- [🧩 Características](#características)
|
||||
- [🏗️ Capturas de pantalla](#capturas-de-pantalla)
|
||||
- [🏗️ Tecnologías](#tecnologías)
|
||||
- [🔗 Enlaces útiles](#enlaces-útiles)
|
||||
- [🤝 Contribuciones](#contribuciones)
|
||||
- [💰 Patrocinadores](#patrocinadores)
|
||||
|
||||
...
|
||||
|
||||
**[Texto truncado para mantener la longitud del mensaje manejable]**
|
||||
|
||||
## Demo
|
||||
|
||||
Puedes ver la última versión de [Checkmate](https://checkmate-demo.bluewavelabs.ca/) en acción. El usuario es uptimedemo@demo.com y la contraseña es Demouser1! (ten en cuenta que actualizamos el servidor de demostración de vez en cuando, así que si no funciona para ti, por favor contáctanos en el canal de Discusiones).
|
||||
|
||||
## Guía del usuario
|
||||
|
||||
Las instrucciones de uso se pueden encontrar [aquí](https://checkmate.so/docs). Todavía está en desarrollo y parte de la información puede estar desactualizada ya que continuamente añadimos funciones cada semana. ¡Ten por seguro que estamos haciendo lo mejor posible! :)
|
||||
|
||||
## Instalación
|
||||
|
||||
Consulta las instrucciones de instalación en el [portal de documentación de Checkmate](https://checkmate.so/docs/getting-started/installation).
|
||||
|
||||
Alternativamente, también puedes usar [Coolify](https://coolify.io/), [Elestio](https://elest.io/open-source/checkmate), [K8s](./charts/helm/checkmate/INSTALLATION.md) o [Pikapods](https://www.pikapods.com/) para desplegar rápidamente una instancia de Checkmate. Si deseas monitorear tu infraestructura de servidores, necesitarás el agente [Capture](https://github.com/bluewave-labs/capture). El repositorio de Capture también contiene las instrucciones de instalación.
|
||||
|
||||
## Traducciones
|
||||
|
||||
Si deseas usar Checkmate en tu idioma, por favor [ve a esta página](https://poeditor.com/join/project/lRUoGZFCsJ) y regístrate para el idioma al que te gustaría traducir Checkmate.
|
||||
|
||||
## Rendimiento
|
||||
|
||||
Gracias a extensas optimizaciones, Checkmate opera con un uso de memoria excepcionalmente bajo, requiriendo recursos mínimos de memoria y CPU. Aquí está el uso de memoria de una instancia de Node.js ejecutándose en un servidor que monitorea 323 servidores cada minuto:
|
||||
|
||||

|
||||
|
||||
También puedes ver el consumo de memoria de MongoDB y Redis en el mismo servidor (398Mb y 15Mb) para la misma cantidad de servidores:
|
||||
|
||||

|
||||
|
||||
## Preguntas e Ideas
|
||||
|
||||
Si tienes alguna pregunta, sugerencia o comentario, tienes varias opciones:
|
||||
|
||||
- [Canal de Discord](https://discord.gg/NAb6H3UTjK)
|
||||
- [Discusiones en GitHub](https://github.com/bluewave-labs/checkmate/discussions)
|
||||
- [Grupo en Reddit](https://www.reddit.com/r/CheckmateMonitoring/)
|
||||
|
||||
¡No dudes en hacer preguntas o compartir tus ideas, nos encantaría saber de ti!
|
||||
|
||||
## Características
|
||||
|
||||
- Completamente de código abierto, desplegable en tus propios servidores o dispositivos personales (por ejemplo, Raspberry Pi 4 o 5)
|
||||
- Monitoreo de sitios web
|
||||
- Monitoreo de velocidad de carga
|
||||
- Monitoreo de infraestructura (memoria, uso de disco, rendimiento de CPU, etc) - requiere el agente [Capture](https://github.com/bluewave-labs/capture)
|
||||
- Monitoreo de Docker
|
||||
- Monitoreo con ping
|
||||
- Monitoreo de certificados SSL
|
||||
- Monitoreo de puertos
|
||||
- Incidentes en una sola vista
|
||||
- Páginas de estado
|
||||
- Notificaciones por correo, Webhooks, Discord, Telegram, Slack
|
||||
- Mantenimiento programado
|
||||
- Monitoreo de consultas JSON
|
||||
- Soporte para múltiples idiomas
|
||||
|
||||
**Hoja de ruta a corto plazo:** ([Milestone 2.2](https://github.com/bluewave-labs/Checkmate/milestone/8))
|
||||
|
||||
- Mejores notificaciones
|
||||
- Monitoreo de red
|
||||
- ...y algunas funciones más
|
||||
|
||||
## Capturas de pantalla
|
||||
|
||||
<p>
|
||||
<img width="1628" alt="image" src="https://github.com/user-attachments/assets/2eff6464-0738-4a32-9312-26e1e8e86275" />
|
||||
</p>
|
||||
<p>
|
||||
<img width="1656" alt="image" src="https://github.com/user-attachments/assets/616c3563-c2a7-4ee4-af6c-7e6068955d1a" />
|
||||
</p>
|
||||
<p>
|
||||
<img width="1652" alt="image" src="https://github.com/user-attachments/assets/7912d7cf-0d0e-4f26-aa5c-2ad7170b5c99" />
|
||||
</p>
|
||||
<p>
|
||||
<img width="1652" alt="image" src="https://github.com/user-attachments/assets/08c2c6ac-3a2f-44d1-a229-d1746a3f9d16" />
|
||||
</p>
|
||||
|
||||
## Tecnologías
|
||||
|
||||
- [ReactJs](https://react.dev/)
|
||||
- [MUI (framework de React)](https://mui.com/)
|
||||
- [Node.js](https://nodejs.org/en)
|
||||
- [MongoDB](https://mongodb.com)
|
||||
- [Recharts](https://recharts.org)
|
||||
- ¡Y muchos otros componentes de código abierto!
|
||||
|
||||
## Enlaces útiles
|
||||
|
||||
- Si deseas apoyarnos, por favor considera darle una ⭐ y haz clic en "watch".
|
||||
- ¿Tienes una pregunta o sugerencia para la hoja de ruta? Revisa nuestro [canal de Discord](https://discord.gg/NAb6H3UTjK) o el foro de [Discusiones](https://github.com/bluewave-labs/checkmate/discussions).
|
||||
- ¿Quieres saber cuándo hay una nueva versión? Usa [Newreleases](https://newreleases.io/), un servicio gratuito para seguir lanzamientos.
|
||||
- Mira un video de instalación y uso de Checkmate [aquí](https://www.youtube.com/watch?v=GfFOc0xHIwY)
|
||||
|
||||
## Contribuciones
|
||||
|
||||
Somos [Alex](http://github.com/ajhollid) (líder de equipo), [Vishnu](http://github.com/vishnusn77), [Mohadeseh](http://github.com/mohicody), [Gorkem](http://github.com/gorkem-bwl/), [Owaise](http://github.com/Owaiseimdad), [Aryaman](https://github.com/Br0wnHammer) y [Mert](https://github.com/mertssmnoglu), ayudando a personas y empresas a monitorear su infraestructura y servidores.
|
||||
|
||||
Nos enorgullecemos de construir conexiones fuertes con contribuyentes de todos los niveles. A pesar de ser un proyecto joven, Checkmate ya ha ganado más de 7000 estrellas y ha atraído a más de 90 contribuyentes de todo el mundo.
|
||||
|
||||
Nuestro repositorio ha sido marcado con estrella por empleados de **Google, Microsoft, Intel, Cisco, Tencent, Electronic Arts, ByteDance, JP Morgan Chase, Deloitte, Accenture, Foxconn, Broadcom, China Telecom, Barclays, Capgemini, Wipro, Cloudflare, Dassault Systèmes y NEC**, ¡así que no te detengas — participa, contribuye y aprende con nosotros!
|
||||
|
||||
Cómo contribuir:
|
||||
|
||||
0. Dale una estrella al repositorio :)
|
||||
1. Revisa la [guía para contribuidores](https://github.com/bluewave-labs/Checkmate/blob/develop/CONTRIBUTING.md). Se anima a los nuevos a revisar las etiquetas `good-first-issue`.
|
||||
2. Consulta la [estructura del proyecto](https://deepwiki.com/bluewave-labs/Checkmate#system-architecture) y la [visión general](https://deepwiki.com/bluewave-labs/Checkmate#overview).
|
||||
3. Lee una estructura detallada de [Checkmate](https://deepwiki.com/bluewave-labs/Checkmate) si deseas profundizar en la arquitectura.
|
||||
4. Abre un issue si crees que has encontrado un error.
|
||||
5. Revisa los issues con la etiqueta `good-first-issue` si eres nuevo.
|
||||
6. Haz un pull request para añadir nuevas funciones, mejoras o correcciones.
|
||||
|
||||
<a href="https://github.com/bluewave-labs/checkmate/graphs/contributors">
|
||||
<img src="https://contrib.rocks/image?repo=bluewave-labs/checkmate" />
|
||||
</a>
|
||||
|
||||
[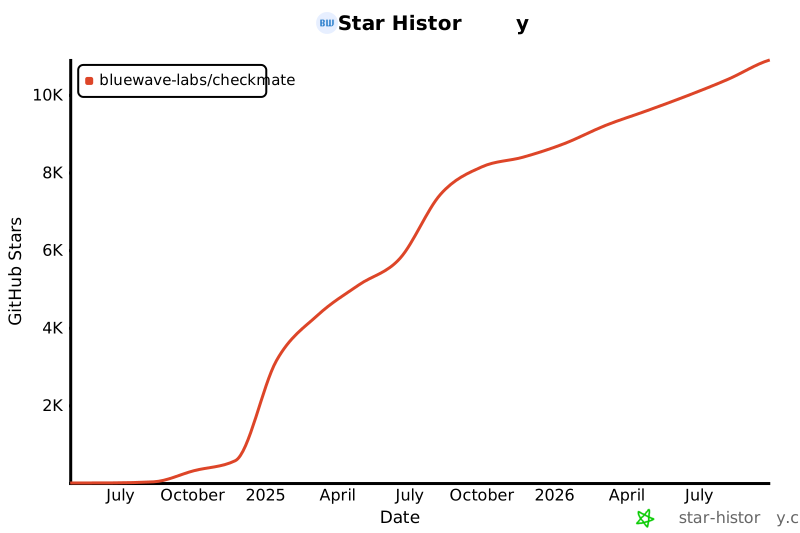](https://star-history.com/#bluewave-labs/bluewave-uptime&Date)
|
||||
|
||||
## Patrocinadores
|
||||
|
||||
Gracias a [Gitbook](https://gitbook.io/) por darnos una cuenta gratuita para su plataforma de documentación, y a [Poeditor](https://poeditor.com/) por proporcionarnos una cuenta gratuita para servicios de traducción. Si deseas patrocinar Checkmate, por favor envía un correo a hello@bluewavelabs.ca
|
||||
|
||||
Si deseas patrocinar una función, [visita esta página](https://checkmate.so/sponsored-features).
|
||||
|
||||
También puedes revisar otros proyectos de BlueWave orientados a desarrolladores y contribuidores:
|
||||
|
||||
- [VerifyWise](https://github.com/bluewave-labs/verifywise), la primera plataforma de gobernanza de IA de código abierto.
|
||||
- [DataRoom](https://github.com/bluewave-labs/bluewave-dataroom), una aplicación de intercambio de archivos seguro, también conocida como dataroom.
|
||||
- [Guidefox](https://github.com/bluewave-labs/guidefox), una app que ayuda a nuevos usuarios a aprender a usar tu producto mediante pistas, tours, popups y banners.
|
||||
@@ -1,25 +1,5 @@
|
||||
<p align=center> <a href="https://trendshift.io/repositories/12443" target="_blank"><img src="https://trendshift.io/api/badge/repositories/12443" alt="bluewave-labs%2Fcheckmate | Trendshift" style="width: 250px; height: 55px;" width="250" height="55"/></a></p>
|
||||
|
||||
<p align="center">
|
||||
🇺🇸 <a href="README.md">English</a> |
|
||||
🇸🇦 <a href="docs/translations/README.ar.md">العربية</a> |
|
||||
🇪🇸 <a href="docs/translations/README.ca.md">Català</a> |
|
||||
🇨🇿 <a href="docs/translations/README.cs.md">Čeština</a> |
|
||||
🇩🇪 <a href="docs/translations/README.de.md">Deutsch</a> |
|
||||
🇪🇸 <a href="docs/translations/README.es.md">Español</a> |
|
||||
🇫🇮 <a href="docs/translations/README.fi.md">Suomi</a> |
|
||||
🇫🇷 <a href="docs/translations/README.fr.md">Français</a> |
|
||||
🇯🇵 <a href="docs/translations/README.ja.md">日本語</a> |
|
||||
🇧🇷 <a href="docs/translations/README.pt-BR.md">Português (Brasil)</a> |
|
||||
🇷🇺 <a href="docs/translations/README.ru.md">Русский</a> |
|
||||
🇹🇭 <a href="docs/translations/README.th.md">ไทย</a> |
|
||||
🇹🇷 <a href="docs/translations/README.tr.md">Türkçe</a> |
|
||||
🇺🇦 <a href="docs/translations/README.uk.md">Українська</a> |
|
||||
🇻🇳 <a href="docs/translations/README.vi.md">Tiếng Việt</a> |
|
||||
🇨🇳 <a href="docs/translations/README.zh-CN.md">简体中文</a> |
|
||||
🇹🇼 <a href="docs/translations/README.zh-TW.md">繁體中文</a>
|
||||
</p>
|
||||
|
||||
|
||||

|
||||

|
||||

|
||||
@@ -60,14 +40,12 @@ Checkmate has been stress-tested with 1000+ active monitors without any particul
|
||||
- [🤝 Contributing](#contributing)
|
||||
|
||||
|
||||
<a id="demo"></a>
|
||||
## Demo
|
||||
|
||||
You can see the latest build of [Checkmate](https://demo.checkmate.so/) in action.
|
||||
|
||||
The username is demouser@demo.com and the password is Demouser1! (just a note that we update the demo server from time to time, so if it doesn't work for you, please ping us on the Discussions channel).
|
||||
|
||||
<a id="users-guide"></a>
|
||||
## User's guide
|
||||
|
||||
Usage instructions can be found [here](https://checkmate.so/docs).
|
||||
@@ -76,7 +54,6 @@ Usage instructions can be found [here](https://checkmate.so/docs).
|
||||
- [Docker](https://www.docker.com/) installed
|
||||
- [Git](https://git-scm.com/) installed
|
||||
|
||||
<a id="installation"></a>
|
||||
## Installation
|
||||
|
||||
See installation instructions in [Checkmate documentation portal](https://checkmate.so/docs).
|
||||
@@ -89,7 +66,6 @@ If you need to monitor internal HTTPS endpoints with certificates from private C
|
||||
|
||||
For more documentation, see the [docs directory](./docs/).
|
||||
|
||||
<a id="performance"></a>
|
||||
## Performance
|
||||
|
||||
Thanks to extensive optimizations, Checkmate operates with an exceptionally small memory footprint, requiring minimal memory and CPU resources. Here’s the memory usage of a Node.js instance running on a server that monitors 323 servers every minute:
|
||||
@@ -100,7 +76,6 @@ You can see the memory footprint of MongoDB and Redis on the same server (398Mb
|
||||
|
||||

|
||||
|
||||
<a id="questions--ideas"></a>
|
||||
## Questions & Ideas
|
||||
|
||||
If you have any questions, suggestions or comments, you have several options:
|
||||
@@ -110,7 +85,6 @@ If you have any questions, suggestions or comments, you have several options:
|
||||
|
||||
Feel free to ask questions or share your ideas - we'd love to hear from you!
|
||||
|
||||
<a id="features"></a>
|
||||
## Features
|
||||
|
||||
- Completely open source, deployable on your servers or home devices (e.g Raspberry Pi 4 or 5)
|
||||
@@ -135,7 +109,6 @@ Feel free to ask questions or share your ideas - we'd love to hear from you!
|
||||
5. Upon a state change: an incident is either created or resolved, depending on the monitor's current status
|
||||
6. Notifications are triggered based on configuration
|
||||
|
||||
<a id="screenshots"></a>
|
||||
## Screenshots
|
||||
|
||||
<p>
|
||||
@@ -153,7 +126,6 @@ Feel free to ask questions or share your ideas - we'd love to hear from you!
|
||||
|
||||
|
||||
|
||||
<a id="tech-stack"></a>
|
||||
## Tech stack
|
||||
|
||||
- [ReactJs](https://react.dev/)
|
||||
@@ -163,7 +135,6 @@ Feel free to ask questions or share your ideas - we'd love to hear from you!
|
||||
- [Recharts](https://recharts.org)
|
||||
- Lots of other open source components!
|
||||
|
||||
<a id="a-few-links"></a>
|
||||
## A few links
|
||||
|
||||
- If you would like to support us, please consider giving it a ⭐ and click on "watch".
|
||||
@@ -171,7 +142,6 @@ Feel free to ask questions or share your ideas - we'd love to hear from you!
|
||||
- Need a ping when there's a new release? Use [Newreleases](https://newreleases.io/), a free service to track releases.
|
||||
- Watch a Checkmate [installation and usage video](https://www.youtube.com/watch?v=GfFOc0xHIwY)
|
||||
|
||||
<a id="contributing"></a>
|
||||
## Contributing
|
||||
|
||||
We are [Alex](http://github.com/ajhollid) (team lead), [Gorkem](http://github.com/gorkem-bwl/), [Aryaman](https://github.com/Br0wnHammer), [Mert](https://github.com/mertssmnoglu) and [Karen](https://github.com/karenvicent) helping individuals and businesses monitor their infra and servers.
|
||||
|
||||
Generated
+4
-236
@@ -1,12 +1,12 @@
|
||||
{
|
||||
"name": "client",
|
||||
"version": "3.8.1",
|
||||
"version": "3.7.1",
|
||||
"lockfileVersion": 3,
|
||||
"requires": true,
|
||||
"packages": {
|
||||
"": {
|
||||
"name": "client",
|
||||
"version": "3.8.1",
|
||||
"version": "3.7.1",
|
||||
"dependencies": {
|
||||
"@emotion/react": "^11.13.3",
|
||||
"@emotion/styled": "^11.13.0",
|
||||
@@ -57,7 +57,6 @@
|
||||
"eslint-plugin-react-hooks": "^5.0.0",
|
||||
"eslint-plugin-react-refresh": "^0.4.6",
|
||||
"lint-staged": "^16.2.7",
|
||||
"mongoose": "9.6.2",
|
||||
"prettier": "^3.3.3",
|
||||
"typescript": "5.9.3",
|
||||
"vite": "^6.4.2"
|
||||
@@ -85,7 +84,6 @@
|
||||
"node_modules/@babel/core": {
|
||||
"version": "7.29.0",
|
||||
"license": "MIT",
|
||||
"peer": true,
|
||||
"dependencies": {
|
||||
"@babel/code-frame": "^7.29.0",
|
||||
"@babel/generator": "^7.29.0",
|
||||
@@ -356,7 +354,6 @@
|
||||
"node_modules/@emotion/react": {
|
||||
"version": "11.14.0",
|
||||
"license": "MIT",
|
||||
"peer": true,
|
||||
"dependencies": {
|
||||
"@babel/runtime": "^7.18.3",
|
||||
"@emotion/babel-plugin": "^11.13.5",
|
||||
@@ -394,7 +391,6 @@
|
||||
"node_modules/@emotion/styled": {
|
||||
"version": "11.14.1",
|
||||
"license": "MIT",
|
||||
"peer": true,
|
||||
"dependencies": {
|
||||
"@babel/runtime": "^7.18.3",
|
||||
"@emotion/babel-plugin": "^11.13.5",
|
||||
@@ -1111,16 +1107,6 @@
|
||||
"supercluster": "^8.0.1"
|
||||
}
|
||||
},
|
||||
"node_modules/@mongodb-js/saslprep": {
|
||||
"version": "1.4.11",
|
||||
"resolved": "https://registry.npmjs.org/@mongodb-js/saslprep/-/saslprep-1.4.11.tgz",
|
||||
"integrity": "sha512-o9rAHc0IpIjuPSxRutWpE1F62x7n+4mVS4rCNHkzhIUMQcc18bb6xEq5wd2NdN0WjepIyXIppRshYI2kQDOZVA==",
|
||||
"dev": true,
|
||||
"license": "MIT",
|
||||
"dependencies": {
|
||||
"sparse-bitfield": "^3.0.3"
|
||||
}
|
||||
},
|
||||
"node_modules/@mui/core-downloads-tracker": {
|
||||
"version": "7.3.7",
|
||||
"license": "MIT",
|
||||
@@ -1174,7 +1160,6 @@
|
||||
"node_modules/@mui/material": {
|
||||
"version": "7.3.7",
|
||||
"license": "MIT",
|
||||
"peer": true,
|
||||
"dependencies": {
|
||||
"@babel/runtime": "^7.28.4",
|
||||
"@mui/core-downloads-tracker": "^7.3.7",
|
||||
@@ -1279,7 +1264,6 @@
|
||||
"node_modules/@mui/system": {
|
||||
"version": "7.3.7",
|
||||
"license": "MIT",
|
||||
"peer": true,
|
||||
"dependencies": {
|
||||
"@babel/runtime": "^7.28.4",
|
||||
"@mui/private-theming": "^7.3.7",
|
||||
@@ -2320,7 +2304,6 @@
|
||||
"version": "24.5.2",
|
||||
"devOptional": true,
|
||||
"license": "MIT",
|
||||
"peer": true,
|
||||
"dependencies": {
|
||||
"undici-types": "~7.12.0"
|
||||
}
|
||||
@@ -2336,7 +2319,6 @@
|
||||
"node_modules/@types/react": {
|
||||
"version": "18.3.27",
|
||||
"license": "MIT",
|
||||
"peer": true,
|
||||
"dependencies": {
|
||||
"@types/prop-types": "*",
|
||||
"csstype": "^3.2.2"
|
||||
@@ -2370,23 +2352,6 @@
|
||||
"version": "0.0.6",
|
||||
"license": "MIT"
|
||||
},
|
||||
"node_modules/@types/webidl-conversions": {
|
||||
"version": "7.0.3",
|
||||
"resolved": "https://registry.npmjs.org/@types/webidl-conversions/-/webidl-conversions-7.0.3.tgz",
|
||||
"integrity": "sha512-CiJJvcRtIgzadHCYXw7dqEnMNRjhGZlYK05Mj9OyktqV8uVT8fD2BFOB7S1uwBE3Kj2Z+4UyPmFw/Ixgw/LAlA==",
|
||||
"dev": true,
|
||||
"license": "MIT"
|
||||
},
|
||||
"node_modules/@types/whatwg-url": {
|
||||
"version": "13.0.0",
|
||||
"resolved": "https://registry.npmjs.org/@types/whatwg-url/-/whatwg-url-13.0.0.tgz",
|
||||
"integrity": "sha512-N8WXpbE6Wgri7KUSvrmQcqrMllKZ9uxkYWMt+mCSGwNc0Hsw9VQTW7ApqI4XNrx6/SaM2QQJCzMPDEXE058s+Q==",
|
||||
"dev": true,
|
||||
"license": "MIT",
|
||||
"dependencies": {
|
||||
"@types/webidl-conversions": "*"
|
||||
}
|
||||
},
|
||||
"node_modules/@typescript-eslint/eslint-plugin": {
|
||||
"version": "7.18.0",
|
||||
"resolved": "https://registry.npmjs.org/@typescript-eslint/eslint-plugin/-/eslint-plugin-7.18.0.tgz",
|
||||
@@ -2427,7 +2392,6 @@
|
||||
"integrity": "sha512-4Z+L8I2OqhZV8qA132M4wNL30ypZGYOQVBfMgxDH/K5UX0PNqTu1c6za9ST5r9+tavvHiTWmBnKzpCJ/GlVFtg==",
|
||||
"dev": true,
|
||||
"license": "BSD-2-Clause",
|
||||
"peer": true,
|
||||
"dependencies": {
|
||||
"@typescript-eslint/scope-manager": "7.18.0",
|
||||
"@typescript-eslint/types": "7.18.0",
|
||||
@@ -2708,7 +2672,6 @@
|
||||
"version": "8.15.0",
|
||||
"dev": true,
|
||||
"license": "MIT",
|
||||
"peer": true,
|
||||
"bin": {
|
||||
"acorn": "bin/acorn"
|
||||
},
|
||||
@@ -3043,7 +3006,6 @@
|
||||
}
|
||||
],
|
||||
"license": "MIT",
|
||||
"peer": true,
|
||||
"dependencies": {
|
||||
"baseline-browser-mapping": "^2.9.0",
|
||||
"caniuse-lite": "^1.0.30001759",
|
||||
@@ -3058,16 +3020,6 @@
|
||||
"node": "^6 || ^7 || ^8 || ^9 || ^10 || ^11 || ^12 || >=13.7"
|
||||
}
|
||||
},
|
||||
"node_modules/bson": {
|
||||
"version": "7.2.0",
|
||||
"resolved": "https://registry.npmjs.org/bson/-/bson-7.2.0.tgz",
|
||||
"integrity": "sha512-YCEo7KjMlbNlyHhz7zAZNDpIpQbd+wOEHJYezv0nMYTn4x31eIUM2yomNNubclAt63dObUzKHWsBLJ9QcZNSnQ==",
|
||||
"dev": true,
|
||||
"license": "Apache-2.0",
|
||||
"engines": {
|
||||
"node": ">=20.19.0"
|
||||
}
|
||||
},
|
||||
"node_modules/bytewise": {
|
||||
"version": "1.1.0",
|
||||
"resolved": "https://registry.npmjs.org/bytewise/-/bytewise-1.1.0.tgz",
|
||||
@@ -3485,8 +3437,7 @@
|
||||
},
|
||||
"node_modules/dayjs": {
|
||||
"version": "1.11.13",
|
||||
"license": "MIT",
|
||||
"peer": true
|
||||
"license": "MIT"
|
||||
},
|
||||
"node_modules/debug": {
|
||||
"version": "4.4.3",
|
||||
@@ -3881,7 +3832,6 @@
|
||||
"version": "8.57.1",
|
||||
"dev": true,
|
||||
"license": "MIT",
|
||||
"peer": true,
|
||||
"dependencies": {
|
||||
"@eslint-community/eslint-utils": "^4.2.0",
|
||||
"@eslint-community/regexpp": "^4.6.1",
|
||||
@@ -4677,7 +4627,6 @@
|
||||
}
|
||||
],
|
||||
"license": "MIT",
|
||||
"peer": true,
|
||||
"dependencies": {
|
||||
"@babel/runtime": "^7.27.6"
|
||||
},
|
||||
@@ -5273,16 +5222,6 @@
|
||||
"node": ">=4.0"
|
||||
}
|
||||
},
|
||||
"node_modules/kareem": {
|
||||
"version": "3.3.0",
|
||||
"resolved": "https://registry.npmjs.org/kareem/-/kareem-3.3.0.tgz",
|
||||
"integrity": "sha512-kpSuLD3/7RenBnjnJdOHXCKC8dTd1JzeOiJhN0necWWci6cC+qX+VuwPnMVgb+a4+KNJSfgqahpnfWaeDXCimw==",
|
||||
"dev": true,
|
||||
"license": "Apache-2.0",
|
||||
"engines": {
|
||||
"node": ">=18.0.0"
|
||||
}
|
||||
},
|
||||
"node_modules/kdbush": {
|
||||
"version": "4.0.2",
|
||||
"resolved": "https://registry.npmjs.org/kdbush/-/kdbush-4.0.2.tgz",
|
||||
@@ -5473,7 +5412,6 @@
|
||||
"resolved": "https://registry.npmjs.org/maplibre-gl/-/maplibre-gl-5.19.0.tgz",
|
||||
"integrity": "sha512-REhYUN8gNP3HlcIZS6QU2uy8iovl31cXsrNDkCcqWSQbCkcpdYLczqDz5PVIwNH42UQNyvukjes/RoHPDrOUmQ==",
|
||||
"license": "BSD-3-Clause",
|
||||
"peer": true,
|
||||
"dependencies": {
|
||||
"@mapbox/geojson-rewind": "^0.5.2",
|
||||
"@mapbox/jsonlint-lines-primitives": "^2.0.2",
|
||||
@@ -5513,13 +5451,6 @@
|
||||
"node": ">= 0.4"
|
||||
}
|
||||
},
|
||||
"node_modules/memory-pager": {
|
||||
"version": "1.5.0",
|
||||
"resolved": "https://registry.npmjs.org/memory-pager/-/memory-pager-1.5.0.tgz",
|
||||
"integrity": "sha512-ZS4Bp4r/Zoeq6+NLJpP+0Zzm0pR8whtGPf1XExKLJBAczGMnSi3It14OiNCStjQjM6NU1okjQGSxgEZN8eBYKg==",
|
||||
"dev": true,
|
||||
"license": "MIT"
|
||||
},
|
||||
"node_modules/merge2": {
|
||||
"version": "1.4.1",
|
||||
"resolved": "https://registry.npmjs.org/merge2/-/merge2-1.4.1.tgz",
|
||||
@@ -5609,109 +5540,6 @@
|
||||
"url": "https://github.com/sponsors/ljharb"
|
||||
}
|
||||
},
|
||||
"node_modules/mongodb": {
|
||||
"version": "7.2.0",
|
||||
"resolved": "https://registry.npmjs.org/mongodb/-/mongodb-7.2.0.tgz",
|
||||
"integrity": "sha512-F/2+BMZtLVhY30ioZp0dAmZ+IRZMBqI+nrv6t5+9/1AIwCa8sMRC3jBf81lpxMhnZgqq8CoUD503Z1oZWq1/sw==",
|
||||
"dev": true,
|
||||
"license": "Apache-2.0",
|
||||
"dependencies": {
|
||||
"@mongodb-js/saslprep": "^1.3.0",
|
||||
"bson": "^7.2.0",
|
||||
"mongodb-connection-string-url": "^7.0.0"
|
||||
},
|
||||
"engines": {
|
||||
"node": ">=20.19.0"
|
||||
},
|
||||
"peerDependencies": {
|
||||
"@aws-sdk/credential-providers": "^3.806.0",
|
||||
"@mongodb-js/zstd": "^7.0.0",
|
||||
"gcp-metadata": "^7.0.1",
|
||||
"kerberos": "^7.0.0",
|
||||
"mongodb-client-encryption": ">=7.0.0 <7.1.0",
|
||||
"snappy": "^7.3.2",
|
||||
"socks": "^2.8.6"
|
||||
},
|
||||
"peerDependenciesMeta": {
|
||||
"@aws-sdk/credential-providers": {
|
||||
"optional": true
|
||||
},
|
||||
"@mongodb-js/zstd": {
|
||||
"optional": true
|
||||
},
|
||||
"gcp-metadata": {
|
||||
"optional": true
|
||||
},
|
||||
"kerberos": {
|
||||
"optional": true
|
||||
},
|
||||
"mongodb-client-encryption": {
|
||||
"optional": true
|
||||
},
|
||||
"snappy": {
|
||||
"optional": true
|
||||
},
|
||||
"socks": {
|
||||
"optional": true
|
||||
}
|
||||
}
|
||||
},
|
||||
"node_modules/mongodb-connection-string-url": {
|
||||
"version": "7.0.1",
|
||||
"resolved": "https://registry.npmjs.org/mongodb-connection-string-url/-/mongodb-connection-string-url-7.0.1.tgz",
|
||||
"integrity": "sha512-h0AZ9A7IDVwwHyMxmdMXKy+9oNlF0zFoahHiX3vQ8e3KFcSP3VmsmfvtRSuLPxmyv2vjIDxqty8smTgie/SNRQ==",
|
||||
"dev": true,
|
||||
"license": "Apache-2.0",
|
||||
"dependencies": {
|
||||
"@types/whatwg-url": "^13.0.0",
|
||||
"whatwg-url": "^14.1.0"
|
||||
},
|
||||
"engines": {
|
||||
"node": ">=20.19.0"
|
||||
}
|
||||
},
|
||||
"node_modules/mongoose": {
|
||||
"version": "9.6.2",
|
||||
"resolved": "https://registry.npmjs.org/mongoose/-/mongoose-9.6.2.tgz",
|
||||
"integrity": "sha512-7m8HntjkoRnwEmuPC0kdlwcZXJOQf4twumFj+PNzg/anqqZE2Er7hQslqyzy07mP3JcFjoTSgH5765PyqOXsxw==",
|
||||
"dev": true,
|
||||
"license": "MIT",
|
||||
"dependencies": {
|
||||
"kareem": "3.3.0",
|
||||
"mongodb": "~7.2",
|
||||
"mpath": "0.9.0",
|
||||
"mquery": "6.0.0",
|
||||
"ms": "2.1.3",
|
||||
"sift": "17.1.3"
|
||||
},
|
||||
"engines": {
|
||||
"node": ">=20.19.0"
|
||||
},
|
||||
"funding": {
|
||||
"type": "opencollective",
|
||||
"url": "https://opencollective.com/mongoose"
|
||||
}
|
||||
},
|
||||
"node_modules/mpath": {
|
||||
"version": "0.9.0",
|
||||
"resolved": "https://registry.npmjs.org/mpath/-/mpath-0.9.0.tgz",
|
||||
"integrity": "sha512-ikJRQTk8hw5DEoFVxHG1Gn9T/xcjtdnOKIU1JTmGjZZlg9LST2mBLmcX3/ICIbgJydT2GOc15RnNy5mHmzfSew==",
|
||||
"dev": true,
|
||||
"license": "MIT",
|
||||
"engines": {
|
||||
"node": ">=4.0.0"
|
||||
}
|
||||
},
|
||||
"node_modules/mquery": {
|
||||
"version": "6.0.0",
|
||||
"resolved": "https://registry.npmjs.org/mquery/-/mquery-6.0.0.tgz",
|
||||
"integrity": "sha512-b2KQNsmgtkscfeDgkYMcWGn9vZI9YoXh802VDEwE6qc50zxBFQ0Oo8ROkawbPAsXCY1/Z1yp0MagqsZStPWJjw==",
|
||||
"dev": true,
|
||||
"license": "MIT",
|
||||
"engines": {
|
||||
"node": ">=20.19.0"
|
||||
}
|
||||
},
|
||||
"node_modules/ms": {
|
||||
"version": "2.1.3",
|
||||
"license": "MIT"
|
||||
@@ -6250,7 +6078,6 @@
|
||||
"node_modules/react-dom": {
|
||||
"version": "18.3.1",
|
||||
"license": "MIT",
|
||||
"peer": true,
|
||||
"dependencies": {
|
||||
"loose-envify": "^1.1.0",
|
||||
"scheduler": "^0.23.2"
|
||||
@@ -6262,7 +6089,6 @@
|
||||
"node_modules/react-hook-form": {
|
||||
"version": "7.71.1",
|
||||
"license": "MIT",
|
||||
"peer": true,
|
||||
"engines": {
|
||||
"node": ">=18.0.0"
|
||||
},
|
||||
@@ -6462,8 +6288,7 @@
|
||||
},
|
||||
"node_modules/redux": {
|
||||
"version": "5.0.1",
|
||||
"license": "MIT",
|
||||
"peer": true
|
||||
"license": "MIT"
|
||||
},
|
||||
"node_modules/redux-persist": {
|
||||
"version": "6.0.0",
|
||||
@@ -6613,7 +6438,6 @@
|
||||
"resolved": "https://registry.npmjs.org/rollup/-/rollup-4.59.0.tgz",
|
||||
"integrity": "sha512-2oMpl67a3zCH9H79LeMcbDhXW/UmWG/y2zuqnF2jQq5uq9TbM9TVyXvA4+t+ne2IIkBdrLpAaRQAvo7YI/Yyeg==",
|
||||
"license": "MIT",
|
||||
"peer": true,
|
||||
"dependencies": {
|
||||
"@types/estree": "1.0.8"
|
||||
},
|
||||
@@ -6889,13 +6713,6 @@
|
||||
"url": "https://github.com/sponsors/ljharb"
|
||||
}
|
||||
},
|
||||
"node_modules/sift": {
|
||||
"version": "17.1.3",
|
||||
"resolved": "https://registry.npmjs.org/sift/-/sift-17.1.3.tgz",
|
||||
"integrity": "sha512-Rtlj66/b0ICeFzYTuNvX/EF1igRbbnGSvEyT79McoZa/DeGhMyC5pWKOEsZKnpkqtSeovd5FL/bjHWC3CIIvCQ==",
|
||||
"dev": true,
|
||||
"license": "MIT"
|
||||
},
|
||||
"node_modules/signal-exit": {
|
||||
"version": "4.1.0",
|
||||
"resolved": "https://registry.npmjs.org/signal-exit/-/signal-exit-4.1.0.tgz",
|
||||
@@ -7006,16 +6823,6 @@
|
||||
"node": ">=0.10.0"
|
||||
}
|
||||
},
|
||||
"node_modules/sparse-bitfield": {
|
||||
"version": "3.0.3",
|
||||
"resolved": "https://registry.npmjs.org/sparse-bitfield/-/sparse-bitfield-3.0.3.tgz",
|
||||
"integrity": "sha512-kvzhi7vqKTfkh0PZU+2D2PIllw2ymqJKujUcyPMd9Y75Nv4nPbGJZXNhxsgdQab2BmlDct1YnfQCguEvHr7VsQ==",
|
||||
"dev": true,
|
||||
"license": "MIT",
|
||||
"dependencies": {
|
||||
"memory-pager": "^1.0.2"
|
||||
}
|
||||
},
|
||||
"node_modules/split-string": {
|
||||
"version": "3.1.0",
|
||||
"resolved": "https://registry.npmjs.org/split-string/-/split-string-3.1.0.tgz",
|
||||
@@ -7329,19 +7136,6 @@
|
||||
"node": ">=8.0"
|
||||
}
|
||||
},
|
||||
"node_modules/tr46": {
|
||||
"version": "5.1.1",
|
||||
"resolved": "https://registry.npmjs.org/tr46/-/tr46-5.1.1.tgz",
|
||||
"integrity": "sha512-hdF5ZgjTqgAntKkklYw0R03MG2x/bSzTtkxmIRw/sTNV8YXsCJ1tfLAX23lhxhHJlEf3CRCOCGGWw3vI3GaSPw==",
|
||||
"dev": true,
|
||||
"license": "MIT",
|
||||
"dependencies": {
|
||||
"punycode": "^2.3.1"
|
||||
},
|
||||
"engines": {
|
||||
"node": ">=18"
|
||||
}
|
||||
},
|
||||
"node_modules/ts-api-utils": {
|
||||
"version": "1.4.3",
|
||||
"resolved": "https://registry.npmjs.org/ts-api-utils/-/ts-api-utils-1.4.3.tgz",
|
||||
@@ -7455,7 +7249,6 @@
|
||||
"version": "5.9.3",
|
||||
"devOptional": true,
|
||||
"license": "Apache-2.0",
|
||||
"peer": true,
|
||||
"bin": {
|
||||
"tsc": "bin/tsc",
|
||||
"tsserver": "bin/tsserver"
|
||||
@@ -7591,7 +7384,6 @@
|
||||
"resolved": "https://registry.npmjs.org/vite/-/vite-6.4.2.tgz",
|
||||
"integrity": "sha512-2N/55r4JDJ4gdrCvGgINMy+HH3iRpNIz8K6SFwVsA+JbQScLiC+clmAxBgwiSPgcG9U15QmvqCGWzMbqda5zGQ==",
|
||||
"license": "MIT",
|
||||
"peer": true,
|
||||
"dependencies": {
|
||||
"esbuild": "^0.25.0",
|
||||
"fdir": "^6.4.4",
|
||||
@@ -7680,30 +7472,6 @@
|
||||
"node": ">=0.10.0"
|
||||
}
|
||||
},
|
||||
"node_modules/webidl-conversions": {
|
||||
"version": "7.0.0",
|
||||
"resolved": "https://registry.npmjs.org/webidl-conversions/-/webidl-conversions-7.0.0.tgz",
|
||||
"integrity": "sha512-VwddBukDzu71offAQR975unBIGqfKZpM+8ZX6ySk8nYhVoo5CYaZyzt3YBvYtRtO+aoGlqxPg/B87NGVZ/fu6g==",
|
||||
"dev": true,
|
||||
"license": "BSD-2-Clause",
|
||||
"engines": {
|
||||
"node": ">=12"
|
||||
}
|
||||
},
|
||||
"node_modules/whatwg-url": {
|
||||
"version": "14.2.0",
|
||||
"resolved": "https://registry.npmjs.org/whatwg-url/-/whatwg-url-14.2.0.tgz",
|
||||
"integrity": "sha512-De72GdQZzNTUBBChsXueQUnPKDkg/5A5zp7pFDuQAj5UFoENpiACU0wlCvzpAGnTkj++ihpKwKyYewn/XNUbKw==",
|
||||
"dev": true,
|
||||
"license": "MIT",
|
||||
"dependencies": {
|
||||
"tr46": "^5.1.0",
|
||||
"webidl-conversions": "^7.0.0"
|
||||
},
|
||||
"engines": {
|
||||
"node": ">=18"
|
||||
}
|
||||
},
|
||||
"node_modules/which": {
|
||||
"version": "2.0.2",
|
||||
"dev": true,
|
||||
|
||||
+2
-3
@@ -1,7 +1,7 @@
|
||||
{
|
||||
"name": "client",
|
||||
"private": true,
|
||||
"version": "3.8.1",
|
||||
"version": "3.7.1",
|
||||
"type": "module",
|
||||
"scripts": {
|
||||
"dev": "vite",
|
||||
@@ -14,7 +14,7 @@
|
||||
"format-check": "prettier --check ."
|
||||
},
|
||||
"lint-staged": {
|
||||
"**/*": "prettier --write --ignore-unknown"
|
||||
"**/*": "prettier --write"
|
||||
},
|
||||
"dependencies": {
|
||||
"@emotion/react": "^11.13.3",
|
||||
@@ -66,7 +66,6 @@
|
||||
"eslint-plugin-react-hooks": "^5.0.0",
|
||||
"eslint-plugin-react-refresh": "^0.4.6",
|
||||
"lint-staged": "^16.2.7",
|
||||
"mongoose": "9.6.2",
|
||||
"prettier": "^3.3.3",
|
||||
"typescript": "5.9.3",
|
||||
"vite": "^6.4.2"
|
||||
|
||||
@@ -35,7 +35,7 @@ const calculateResponseTimeStats = (checks: CheckSnapshot[]): ResponseTimeStats
|
||||
}
|
||||
|
||||
const responseTimes = validChecks.map((check) => check.originalResponseTime);
|
||||
const max = Math.round(Math.max(...responseTimes));
|
||||
const max = Math.max(...responseTimes);
|
||||
const avg = Math.round(
|
||||
responseTimes.reduce((sum, time) => sum + time, 0) / responseTimes.length
|
||||
);
|
||||
@@ -73,20 +73,14 @@ export const HistogramResponseTime = ({
|
||||
<Stack
|
||||
justifyContent="center"
|
||||
alignItems={statsPosition === "left" ? "flex-end" : "flex-start"}
|
||||
width={110}
|
||||
minWidth={70}
|
||||
pr={statsPosition === "left" ? theme.spacing(8) : 0}
|
||||
pl={statsPosition === "right" ? theme.spacing(8) : 0}
|
||||
>
|
||||
<Typography
|
||||
variant="body2"
|
||||
noWrap
|
||||
>
|
||||
<Typography variant="body2">
|
||||
{t("common.charts.histogram.avg", { value: stats.avg })}
|
||||
</Typography>
|
||||
<Typography
|
||||
variant="body2"
|
||||
noWrap
|
||||
>
|
||||
<Typography variant="body2">
|
||||
{t("common.charts.histogram.max", { value: stats.max })}
|
||||
</Typography>
|
||||
</Stack>
|
||||
|
||||
@@ -1,36 +1,30 @@
|
||||
import { BaseChart } from "@/Components/design-elements";
|
||||
import Stack from "@mui/material/Stack";
|
||||
import Box, { type BoxProps } from "@mui/material/Box";
|
||||
import Box from "@mui/material/Box";
|
||||
import Typography from "@mui/material/Typography";
|
||||
|
||||
import { useTheme } from "@mui/material/styles";
|
||||
import { forwardRef, useMemo, useState, useEffect } from "react";
|
||||
import { useMemo, useState, useEffect } from "react";
|
||||
import { getInfraGaugeColor } from "@/Utils/MonitorUtils";
|
||||
|
||||
const MINIMUM_VALUE = 0;
|
||||
const MAXIMUM_VALUE = 100;
|
||||
|
||||
interface GaugeProps extends Omit<BoxProps, "color"> {
|
||||
export const Gauge = ({
|
||||
isLoading = false,
|
||||
progress = 0,
|
||||
radius = 70,
|
||||
strokeWidth = 15,
|
||||
precision = 1,
|
||||
unit = "%",
|
||||
}: {
|
||||
isLoading?: boolean;
|
||||
progress?: number;
|
||||
radius?: number;
|
||||
strokeWidth?: number;
|
||||
precision?: number;
|
||||
unit?: string;
|
||||
}
|
||||
|
||||
export const Gauge = forwardRef<HTMLDivElement, GaugeProps>(function Gauge(
|
||||
{
|
||||
isLoading = false,
|
||||
progress = 0,
|
||||
radius = 70,
|
||||
strokeWidth = 15,
|
||||
precision = 1,
|
||||
unit = "%",
|
||||
...rest
|
||||
},
|
||||
ref
|
||||
) {
|
||||
}) => {
|
||||
const theme = useTheme();
|
||||
const progressWithinRange = Math.max(MINIMUM_VALUE, Math.min(progress, MAXIMUM_VALUE));
|
||||
|
||||
@@ -57,19 +51,17 @@ export const Gauge = forwardRef<HTMLDivElement, GaugeProps>(function Gauge(
|
||||
const fillColor = getInfraGaugeColor(progressWithinRange, theme);
|
||||
|
||||
if (isLoading) {
|
||||
return null;
|
||||
return;
|
||||
}
|
||||
|
||||
return (
|
||||
<Box
|
||||
ref={ref}
|
||||
display={"inline-block"}
|
||||
position={"relative"}
|
||||
width={radius}
|
||||
height={radius}
|
||||
bgcolor={theme.palette.background.paper}
|
||||
borderRadius={"50%"}
|
||||
{...rest}
|
||||
>
|
||||
<svg
|
||||
viewBox={`0 0 ${totalSize} ${totalSize}`}
|
||||
@@ -113,7 +105,7 @@ export const Gauge = forwardRef<HTMLDivElement, GaugeProps>(function Gauge(
|
||||
</Typography>
|
||||
</Box>
|
||||
);
|
||||
});
|
||||
};
|
||||
|
||||
export const DetailGauge = ({
|
||||
title,
|
||||
|
||||
@@ -93,20 +93,3 @@ export const ValueLabel = ({ value, text }: { value: ValueType; text: string })
|
||||
</BaseBox>
|
||||
);
|
||||
};
|
||||
|
||||
export const ColoredLabel = ({ text, color }: { text: string; color: string }) => {
|
||||
const theme = useTheme();
|
||||
|
||||
return (
|
||||
<BaseBox
|
||||
sx={{
|
||||
width: "fit-content",
|
||||
padding: theme.spacing(1, 3),
|
||||
color: color,
|
||||
borderColor: color,
|
||||
}}
|
||||
>
|
||||
<Typography>{text}</Typography>
|
||||
</BaseBox>
|
||||
);
|
||||
};
|
||||
@@ -1,42 +0,0 @@
|
||||
import Stack from "@mui/material/Stack";
|
||||
import Box from "@mui/material/Box";
|
||||
import { useTheme, alpha } from "@mui/material/styles";
|
||||
import { LAYOUT } from "@/Utils/Theme/constants";
|
||||
|
||||
interface StepProgressProps {
|
||||
steps: number;
|
||||
current: number;
|
||||
}
|
||||
|
||||
export const StepProgress = ({ steps, current }: StepProgressProps) => {
|
||||
const theme = useTheme();
|
||||
const activeBg = `linear-gradient(135deg, ${theme.palette.primary.light} 0%, ${theme.palette.primary.main} 100%)`;
|
||||
const completedBg = `linear-gradient(135deg, ${alpha(theme.palette.primary.light, 0.5)} 0%, ${alpha(theme.palette.primary.main, 0.5)} 100%)`;
|
||||
|
||||
const getSegmentBackground = (index: number) => {
|
||||
if (index < current) return completedBg;
|
||||
if (index === current) return activeBg;
|
||||
return theme.palette.divider;
|
||||
};
|
||||
|
||||
return (
|
||||
<Stack
|
||||
direction="row"
|
||||
gap={theme.spacing(LAYOUT.XS)}
|
||||
width="100%"
|
||||
>
|
||||
{Array.from({ length: steps }).map((_, index) => (
|
||||
<Box
|
||||
key={index}
|
||||
flex={1}
|
||||
height={theme.spacing(LAYOUT.XXS)}
|
||||
borderRadius={theme.shape.borderRadius}
|
||||
sx={{
|
||||
background: getSegmentBackground(index),
|
||||
transition: "background 0.2s ease",
|
||||
}}
|
||||
/>
|
||||
))}
|
||||
</Stack>
|
||||
);
|
||||
};
|
||||
@@ -142,7 +142,7 @@ export function DataTable<
|
||||
>
|
||||
<Typography
|
||||
component="div"
|
||||
color={theme.palette.text.primary}
|
||||
color={theme.palette.text.secondary}
|
||||
>
|
||||
{header.mobileLabel ?? header.content}
|
||||
</Typography>
|
||||
|
||||
@@ -6,11 +6,7 @@ import type { TooltipProps } from "@mui/material/Tooltip";
|
||||
|
||||
type StyledTooltipProps = TooltipProps;
|
||||
|
||||
export const Tooltip = ({
|
||||
placement = "top",
|
||||
slotProps,
|
||||
...props
|
||||
}: StyledTooltipProps) => {
|
||||
export const Tooltip = ({ placement = "top", ...props }: StyledTooltipProps) => {
|
||||
const theme = useTheme();
|
||||
|
||||
return (
|
||||
@@ -31,7 +27,6 @@ export const Tooltip = ({
|
||||
boxShadow: theme.shadows[6],
|
||||
},
|
||||
},
|
||||
...slotProps,
|
||||
}}
|
||||
>
|
||||
{props.children}
|
||||
|
||||
@@ -27,4 +27,3 @@ export * from "./OfflineBanner";
|
||||
export * from "./Avatar";
|
||||
export * from "./StatusCodeLabel";
|
||||
export * from "./StrategyBadge";
|
||||
export * from "./StepProgress";
|
||||
@@ -14,19 +14,17 @@ type AutoCompleteInputProps = Omit<
|
||||
renderInput?: AutocompleteProps<any, boolean, boolean, boolean>["renderInput"];
|
||||
fieldLabel?: string;
|
||||
required?: boolean;
|
||||
renderOptionContent?: (option: any) => React.ReactNode;
|
||||
};
|
||||
|
||||
export const AutoCompleteInput = ({
|
||||
fieldLabel,
|
||||
required,
|
||||
renderInput,
|
||||
renderOptionContent,
|
||||
...props
|
||||
}: AutoCompleteInputProps) => {
|
||||
const theme = useTheme();
|
||||
const multiple = props.multiple;
|
||||
const { renderOption: customRenderOption, ...autocompleteProps } = props;
|
||||
|
||||
const defaultRenderInput = (params: any) => (
|
||||
<TextField
|
||||
{...params}
|
||||
@@ -36,7 +34,7 @@ export const AutoCompleteInput = ({
|
||||
|
||||
const autocomplete = (
|
||||
<Autocomplete
|
||||
{...autocompleteProps}
|
||||
{...props}
|
||||
disableCloseOnSelect={!!multiple}
|
||||
popupIcon={
|
||||
<ChevronDown
|
||||
@@ -48,28 +46,24 @@ export const AutoCompleteInput = ({
|
||||
renderInput={renderInput || defaultRenderInput}
|
||||
getOptionKey={(option) => option.id}
|
||||
renderTags={() => null}
|
||||
renderOption={
|
||||
customRenderOption ||
|
||||
((props, option, { selected }) => {
|
||||
const { key, ...optionProps } = props;
|
||||
return (
|
||||
<ListItem
|
||||
key={key}
|
||||
{...optionProps}
|
||||
renderOption={(props, option, { selected }) => {
|
||||
const { key, ...optionProps } = props;
|
||||
return (
|
||||
<ListItem
|
||||
key={key}
|
||||
{...optionProps}
|
||||
>
|
||||
<Stack
|
||||
direction={"row"}
|
||||
alignItems={"center"}
|
||||
gap={theme.spacing(2)}
|
||||
>
|
||||
<Stack
|
||||
direction={"row"}
|
||||
alignItems={"center"}
|
||||
gap={theme.spacing(2)}
|
||||
width="100%"
|
||||
>
|
||||
{multiple && <Checkbox checked={selected} />}
|
||||
{renderOptionContent ? renderOptionContent(option) : option.name}
|
||||
</Stack>
|
||||
</ListItem>
|
||||
);
|
||||
})
|
||||
}
|
||||
{multiple && <Checkbox checked={selected} />}
|
||||
{option.name}
|
||||
</Stack>
|
||||
</ListItem>
|
||||
);
|
||||
}}
|
||||
sx={{
|
||||
"&.MuiAutocomplete-root .MuiAutocomplete-input": {
|
||||
padding: `0 ${theme.spacing(5)}`,
|
||||
|
||||
@@ -1,7 +1,7 @@
|
||||
import { forwardRef } from "react";
|
||||
import Checkbox from "@mui/material/Checkbox";
|
||||
import type { CheckboxProps } from "@mui/material/Checkbox";
|
||||
import { Square, SquareCheck, SquareMinus } from "lucide-react";
|
||||
import { Square, SquareCheck } from "lucide-react";
|
||||
import { useTheme } from "@mui/material/styles";
|
||||
|
||||
type CheckboxInputProps = CheckboxProps & {
|
||||
@@ -34,15 +34,9 @@ export const CheckboxInput = forwardRef<HTMLInputElement, CheckboxInputProps>(
|
||||
strokeWidth={1.5}
|
||||
/>
|
||||
}
|
||||
indeterminateIcon={
|
||||
<SquareMinus
|
||||
size={16}
|
||||
strokeWidth={1.5}
|
||||
/>
|
||||
}
|
||||
sx={{
|
||||
color: theme.palette.text.secondary,
|
||||
"&.Mui-checked, &.MuiCheckbox-indeterminate": {
|
||||
"&.Mui-checked": {
|
||||
color: theme.palette.primary.main,
|
||||
},
|
||||
"&:hover": { backgroundColor: "transparent" },
|
||||
|
||||
@@ -0,0 +1,138 @@
|
||||
import React, { useState, useEffect } from "react";
|
||||
import { useTranslation } from "react-i18next";
|
||||
import { useTheme } from "@mui/material/styles";
|
||||
import { Dialog, Select, RadioWithDescription } from "@/Components/inputs";
|
||||
import { SPACING, LAYOUT } from "@/Utils/Theme/constants";
|
||||
import Stack from "@mui/material/Stack";
|
||||
import RadioGroup from "@mui/material/RadioGroup";
|
||||
import MenuItem from "@mui/material/MenuItem";
|
||||
import Typography from "@mui/material/Typography";
|
||||
import Alert from "@mui/material/Alert";
|
||||
import { useGet, usePatch } from "@/Hooks/UseApi";
|
||||
import type { Notification } from "@/Types/Notification";
|
||||
|
||||
interface BulkEditNotificationsModalProps {
|
||||
open: boolean;
|
||||
onClose: () => void;
|
||||
selectedMonitors: string[];
|
||||
onComplete: (success: boolean) => void;
|
||||
}
|
||||
|
||||
export const BulkEditNotificationsModal: React.FC<BulkEditNotificationsModalProps> = ({
|
||||
open,
|
||||
onClose,
|
||||
selectedMonitors,
|
||||
onComplete,
|
||||
}) => {
|
||||
const { t } = useTranslation();
|
||||
const theme = useTheme();
|
||||
|
||||
const [action, setAction] = useState<"add" | "remove" | "set">("add");
|
||||
const [notificationIds, setNotificationIds] = useState<string[]>([]);
|
||||
|
||||
// Fetch available notifications
|
||||
const { data: notifications } = useGet<Notification[]>(
|
||||
"/notifications/team",
|
||||
undefined,
|
||||
{
|
||||
keepPreviousData: true,
|
||||
}
|
||||
);
|
||||
|
||||
const { patch, loading: isPatching, error } = usePatch();
|
||||
|
||||
// Reset state when modal opens
|
||||
useEffect(() => {
|
||||
if (open) {
|
||||
setAction("add");
|
||||
setNotificationIds([]);
|
||||
}
|
||||
}, [open]);
|
||||
|
||||
const handleConfirm = async () => {
|
||||
const res = await patch("/monitors/notifications", {
|
||||
monitorIds: selectedMonitors,
|
||||
notificationIds,
|
||||
action,
|
||||
});
|
||||
|
||||
onComplete(!!res);
|
||||
};
|
||||
|
||||
// Prevent submitting empty arrays unless the action is 'set'
|
||||
const isMissingSelection = action !== "set" && notificationIds.length === 0;
|
||||
|
||||
return (
|
||||
<Dialog
|
||||
open={open}
|
||||
title={t("pages.common.monitors.bulkEdit.title")}
|
||||
onCancel={onClose}
|
||||
onConfirm={isMissingSelection ? undefined : handleConfirm}
|
||||
loading={isPatching}
|
||||
maxWidth="sm"
|
||||
fullWidth
|
||||
>
|
||||
<Stack
|
||||
spacing={theme.spacing(LAYOUT.XS)}
|
||||
mt={theme.spacing(SPACING.LG)}
|
||||
>
|
||||
{error && <Alert severity="error">{error}</Alert>}
|
||||
<Typography variant="body1">
|
||||
{t("pages.common.monitors.bulkEdit.selectedText", {
|
||||
count: selectedMonitors.length,
|
||||
})}
|
||||
</Typography>
|
||||
|
||||
<RadioGroup
|
||||
value={action}
|
||||
onChange={(e) => {
|
||||
const val = e.target.value;
|
||||
if (val === "add" || val === "remove" || val === "set") {
|
||||
setAction(val);
|
||||
}
|
||||
}}
|
||||
>
|
||||
<RadioWithDescription
|
||||
value="add"
|
||||
label={t("pages.common.monitors.bulkEdit.actionAdd")}
|
||||
description={t("pages.common.monitors.bulkEdit.actionAddDesc")}
|
||||
/>
|
||||
<RadioWithDescription
|
||||
value="remove"
|
||||
label={t("pages.common.monitors.bulkEdit.actionRemove")}
|
||||
description={t("pages.common.monitors.bulkEdit.actionRemoveDesc")}
|
||||
/>
|
||||
<RadioWithDescription
|
||||
value="set"
|
||||
label={t("pages.common.monitors.bulkEdit.actionSet")}
|
||||
description={t("pages.common.monitors.bulkEdit.actionSetDesc")}
|
||||
/>
|
||||
</RadioGroup>
|
||||
|
||||
<Select
|
||||
multiple
|
||||
value={notificationIds}
|
||||
onChange={(e) => {
|
||||
const val = e.target.value;
|
||||
if (typeof val === "string") {
|
||||
setNotificationIds(val.split(","));
|
||||
} else if (Array.isArray(val)) {
|
||||
setNotificationIds(val.filter((v) => typeof v === "string"));
|
||||
}
|
||||
}}
|
||||
fieldLabel={t("pages.common.monitors.bulkEdit.selectLabel")}
|
||||
placeholder={t("pages.common.monitors.bulkEdit.selectPlaceholder")}
|
||||
>
|
||||
{notifications?.map((n) => (
|
||||
<MenuItem
|
||||
key={n.id}
|
||||
value={n.id}
|
||||
>
|
||||
{n.notificationName} ({n.type.toUpperCase()})
|
||||
</MenuItem>
|
||||
))}
|
||||
</Select>
|
||||
</Stack>
|
||||
</Dialog>
|
||||
);
|
||||
};
|
||||
@@ -1,11 +1,9 @@
|
||||
import Stack from "@mui/material/Stack";
|
||||
import { Select, Autocomplete, Button, TextField } from "@/Components/inputs";
|
||||
import { ColoredLabel } from "@/Components/design-elements";
|
||||
import { Select, Button } from "@/Components/inputs";
|
||||
import MenuItem from "@mui/material/MenuItem";
|
||||
import useMediaQuery from "@mui/material/useMediaQuery";
|
||||
|
||||
import type { MonitorType } from "@/Types/Monitor";
|
||||
import type { Tag } from "@/Types/Tag";
|
||||
import { Typography, useTheme } from "@mui/material";
|
||||
import { useTranslation } from "react-i18next";
|
||||
|
||||
@@ -30,34 +28,22 @@ export const ControlsFilter = ({
|
||||
setSelectedStatus,
|
||||
selectedState,
|
||||
setSelectedState,
|
||||
tagOptions,
|
||||
selectedTags,
|
||||
setSelectedTags,
|
||||
onClearFilters,
|
||||
}: {
|
||||
showTypes?: boolean;
|
||||
selectedTypes?: MonitorType[];
|
||||
setSelectedTypes?: React.Dispatch<React.SetStateAction<MonitorType[]>>;
|
||||
selectedStatus?: string;
|
||||
setSelectedStatus?: React.Dispatch<React.SetStateAction<string>>;
|
||||
selectedState?: string;
|
||||
setSelectedState?: React.Dispatch<React.SetStateAction<string>>;
|
||||
tagOptions?: Tag[];
|
||||
selectedTags?: string[];
|
||||
setSelectedTags?: React.Dispatch<React.SetStateAction<string[]>>;
|
||||
selectedStatus: string;
|
||||
setSelectedStatus: React.Dispatch<React.SetStateAction<string>>;
|
||||
selectedState: string;
|
||||
setSelectedState: React.Dispatch<React.SetStateAction<string>>;
|
||||
onClearFilters: () => void;
|
||||
}) => {
|
||||
const theme = useTheme();
|
||||
const { t } = useTranslation();
|
||||
const isSmall = useMediaQuery(theme.breakpoints.down("md"));
|
||||
const isFilterActive =
|
||||
(selectedTypes?.length ?? 0) > 0 ||
|
||||
Boolean(selectedStatus) ||
|
||||
Boolean(selectedState) ||
|
||||
(selectedTags?.length ?? 0) > 0;
|
||||
const selectedTagObjects = (tagOptions ?? []).filter((tag) =>
|
||||
(selectedTags ?? []).includes(tag.id)
|
||||
);
|
||||
(selectedTypes?.length ?? 0) > 0 || selectedStatus !== "" || selectedState !== "";
|
||||
return (
|
||||
<Stack
|
||||
direction={isSmall ? "column" : "row"}
|
||||
@@ -80,68 +66,34 @@ export const ControlsFilter = ({
|
||||
))}
|
||||
</Select>
|
||||
)}
|
||||
{setSelectedStatus && (
|
||||
<Select
|
||||
placeholder="Status"
|
||||
value={selectedStatus ?? ""}
|
||||
onChange={(e) => setSelectedStatus(e.target.value)}
|
||||
>
|
||||
{statuses.map((status) => (
|
||||
<MenuItem
|
||||
key={status}
|
||||
value={status}
|
||||
>
|
||||
<Typography textTransform={"capitalize"}>{status}</Typography>
|
||||
</MenuItem>
|
||||
))}
|
||||
</Select>
|
||||
)}
|
||||
{setSelectedState && (
|
||||
<Select
|
||||
placeholder="State"
|
||||
value={selectedState ?? ""}
|
||||
onChange={(e) => setSelectedState(e.target.value)}
|
||||
>
|
||||
{states.map((state) => (
|
||||
<MenuItem
|
||||
key={state}
|
||||
value={state}
|
||||
>
|
||||
<Typography textTransform={"capitalize"}>{state}</Typography>
|
||||
</MenuItem>
|
||||
))}
|
||||
</Select>
|
||||
)}
|
||||
{tagOptions && setSelectedTags && (
|
||||
<Autocomplete
|
||||
multiple
|
||||
options={tagOptions}
|
||||
value={selectedTagObjects}
|
||||
getOptionLabel={(option) => option.name}
|
||||
onChange={(_: unknown, newValue: Tag[]) => {
|
||||
setSelectedTags(newValue.map((tag) => tag.id));
|
||||
}}
|
||||
isOptionEqualToValue={(option, value) => option.id === value.id}
|
||||
renderOptionContent={(option) => (
|
||||
<ColoredLabel
|
||||
text={option.name}
|
||||
color={option.color}
|
||||
/>
|
||||
)}
|
||||
renderInput={(params) => (
|
||||
<TextField
|
||||
{...params}
|
||||
placeholder={t("common.table.headers.tags")}
|
||||
/>
|
||||
)}
|
||||
slotProps={{
|
||||
popper: {
|
||||
sx: { width: "fit-content !important", minWidth: 280 },
|
||||
},
|
||||
}}
|
||||
sx={{ minWidth: 180 }}
|
||||
/>
|
||||
)}
|
||||
<Select
|
||||
placeholder="Status"
|
||||
value={selectedStatus}
|
||||
onChange={(e) => setSelectedStatus(e.target.value)}
|
||||
>
|
||||
{statuses.map((status) => (
|
||||
<MenuItem
|
||||
key={status}
|
||||
value={status}
|
||||
>
|
||||
<Typography textTransform={"capitalize"}>{status}</Typography>
|
||||
</MenuItem>
|
||||
))}
|
||||
</Select>
|
||||
<Select
|
||||
placeholder="State"
|
||||
value={selectedState}
|
||||
onChange={(e) => setSelectedState(e.target.value)}
|
||||
>
|
||||
{states.map((state) => (
|
||||
<MenuItem
|
||||
key={state}
|
||||
value={state}
|
||||
>
|
||||
<Typography textTransform={"capitalize"}>{state}</Typography>
|
||||
</MenuItem>
|
||||
))}
|
||||
</Select>
|
||||
{isFilterActive && (
|
||||
<Button
|
||||
variant="contained"
|
||||
|
||||
@@ -15,3 +15,4 @@ export * from "./charts/HistogramPageSpeedDetailsTooltip";
|
||||
export * from "./charts/HistogramInfrastructure";
|
||||
export * from "./HeaderMonitorsSummary";
|
||||
export * from "./BulkActionsBar";
|
||||
export * from "./BulkEditNotificationsModal";
|
||||
@@ -17,7 +17,6 @@ import {
|
||||
User,
|
||||
Lock,
|
||||
Users,
|
||||
Tag,
|
||||
} from "lucide-react";
|
||||
|
||||
export const getMenu = (t: Function) => {
|
||||
@@ -42,11 +41,6 @@ export const getMenu = (t: Function) => {
|
||||
path: "notifications",
|
||||
icon: <Icon icon={Bell} />,
|
||||
},
|
||||
{
|
||||
name: t("components.sidebar.menu.tags"),
|
||||
path: "tags",
|
||||
icon: <Icon icon={Tag} />,
|
||||
},
|
||||
{
|
||||
name: t("components.sidebar.menu.checks"),
|
||||
path: "checks",
|
||||
|
||||
@@ -20,8 +20,6 @@ export const useToast = () => {
|
||||
showToast(msg, { ...opts, type: "error" });
|
||||
const toastInfo = (msg: string, opts?: ToastOptions) =>
|
||||
showToast(msg, { ...opts, type: "info" });
|
||||
const toastWarning = (msg: string, opts?: ToastOptions) =>
|
||||
showToast(msg, { ...opts, type: "warning" });
|
||||
|
||||
return { showToast, toastSuccess, toastError, toastInfo, toastWarning };
|
||||
return { showToast, toastSuccess, toastError, toastInfo };
|
||||
};
|
||||
@@ -9,10 +9,7 @@ import type { Monitor } from "@/Types/Monitor";
|
||||
interface ApiResponse {
|
||||
success: boolean;
|
||||
msg: string;
|
||||
data: {
|
||||
monitors: Monitor[];
|
||||
failedCount: number;
|
||||
};
|
||||
data: Monitor[];
|
||||
}
|
||||
|
||||
interface UseBulkMonitorActionsReturn {
|
||||
@@ -28,7 +25,7 @@ export const useBulkMonitorActions = (
|
||||
page?: number
|
||||
): UseBulkMonitorActionsReturn => {
|
||||
const [selectedRows, setSelectedRows] = useState<string[]>([]);
|
||||
const { toastSuccess, toastError, toastInfo, toastWarning } = useToast();
|
||||
const { toastSuccess, toastError, toastInfo } = useToast();
|
||||
const { t } = useTranslation();
|
||||
|
||||
// Clear selection when page changes
|
||||
@@ -43,21 +40,13 @@ export const useBulkMonitorActions = (
|
||||
pause,
|
||||
});
|
||||
|
||||
const affectedCount = res.data?.data?.monitors?.length ?? 0;
|
||||
const failedCount = res.data?.data?.failedCount ?? 0;
|
||||
const affectedCount = res.data?.data?.length ?? 0;
|
||||
|
||||
if (affectedCount === 0) {
|
||||
const key = pause
|
||||
? "pages.common.monitors.bulkPause.alreadyPaused"
|
||||
: "pages.common.monitors.bulkPause.alreadyRunning";
|
||||
toastInfo(t(key, { count: selectedRows.length }));
|
||||
} else if (failedCount > 0) {
|
||||
toastWarning(
|
||||
t("pages.common.monitors.bulkPause.partialFailure", {
|
||||
successCount: affectedCount,
|
||||
failedCount,
|
||||
})
|
||||
);
|
||||
} else {
|
||||
const key = pause
|
||||
? "pages.common.monitors.bulkPause.paused"
|
||||
|
||||
+110
-125
@@ -13,143 +13,128 @@ const getBaseDefaults = (data?: Monitor | null) => ({
|
||||
description: data?.description || "",
|
||||
interval: data?.interval || 60000,
|
||||
notifications: data?.notifications || [],
|
||||
tags: data?.tags || [],
|
||||
statusWindowSize: data?.statusWindowSize || 5,
|
||||
statusWindowThreshold: data?.statusWindowThreshold || 60,
|
||||
});
|
||||
|
||||
// Geo-check defaults — only http and ping support geo checks.
|
||||
const getGeoCheckDefaults = (data?: Monitor | null) => ({
|
||||
geoCheckEnabled: data?.geoCheckEnabled ?? false,
|
||||
geoCheckLocations: data?.geoCheckLocations || [],
|
||||
geoCheckInterval: data?.geoCheckInterval || 300000,
|
||||
});
|
||||
|
||||
export const getMonitorDefaults = (
|
||||
type: MonitorType,
|
||||
data: Monitor | null = null
|
||||
): MonitorFormData => {
|
||||
const base = getBaseDefaults(data);
|
||||
|
||||
let defaults: MonitorFormData;
|
||||
|
||||
switch (type) {
|
||||
case "http":
|
||||
defaults = {
|
||||
...base,
|
||||
...getGeoCheckDefaults(data),
|
||||
type: "http",
|
||||
url: data?.url || "",
|
||||
ignoreTlsErrors: data?.ignoreTlsErrors || false,
|
||||
useAdvancedMatching: data?.useAdvancedMatching || false,
|
||||
matchMethod: data?.matchMethod || "",
|
||||
expectedValue: data?.expectedValue || "",
|
||||
jsonPath: data?.jsonPath || "",
|
||||
};
|
||||
break;
|
||||
case "ping":
|
||||
defaults = {
|
||||
...base,
|
||||
...getGeoCheckDefaults(data),
|
||||
type: "ping",
|
||||
url: data?.url || "",
|
||||
};
|
||||
break;
|
||||
case "port":
|
||||
defaults = {
|
||||
...base,
|
||||
type: "port",
|
||||
url: data?.url || "",
|
||||
port: data?.port || 80,
|
||||
};
|
||||
break;
|
||||
case "docker":
|
||||
defaults = {
|
||||
...base,
|
||||
type: "docker",
|
||||
url: data?.url || "",
|
||||
};
|
||||
break;
|
||||
case "game":
|
||||
defaults = {
|
||||
...base,
|
||||
type: "game",
|
||||
url: data?.url || "",
|
||||
port: data?.port || 27015,
|
||||
gameId: data?.gameId || "",
|
||||
};
|
||||
break;
|
||||
case "grpc":
|
||||
defaults = {
|
||||
...base,
|
||||
type: "grpc",
|
||||
url: data?.url || "",
|
||||
port: data?.port || 50051,
|
||||
grpcServiceName: data?.grpcServiceName || "",
|
||||
ignoreTlsErrors: data?.ignoreTlsErrors || false,
|
||||
};
|
||||
break;
|
||||
case "pagespeed":
|
||||
defaults = {
|
||||
...base,
|
||||
type: "pagespeed",
|
||||
url: data?.url || "",
|
||||
strategy: data?.strategy ?? DefaultPageSpeedStrategy,
|
||||
};
|
||||
break;
|
||||
case "hardware":
|
||||
defaults = {
|
||||
...base,
|
||||
type: "hardware",
|
||||
url: data?.url || "",
|
||||
secret: data?.secret || "",
|
||||
cpuAlertThreshold: data?.cpuAlertThreshold ?? 100,
|
||||
memoryAlertThreshold: data?.memoryAlertThreshold ?? 100,
|
||||
diskAlertThreshold: data?.diskAlertThreshold ?? 100,
|
||||
tempAlertThreshold: data?.tempAlertThreshold ?? 100,
|
||||
selectedDisks: data?.selectedDisks || [],
|
||||
};
|
||||
break;
|
||||
case "websocket":
|
||||
defaults = {
|
||||
...base,
|
||||
type: "websocket",
|
||||
url: data?.url || "",
|
||||
ignoreTlsErrors: data?.ignoreTlsErrors || false,
|
||||
};
|
||||
break;
|
||||
case "dns":
|
||||
defaults = {
|
||||
...base,
|
||||
type: "dns",
|
||||
url: data?.url || "",
|
||||
dnsServer: data?.dnsServer || "",
|
||||
dnsRecordType: data?.dnsRecordType || "A",
|
||||
};
|
||||
break;
|
||||
default:
|
||||
defaults = {
|
||||
...base,
|
||||
...getGeoCheckDefaults(data),
|
||||
type: "http",
|
||||
url: "",
|
||||
ignoreTlsErrors: false,
|
||||
useAdvancedMatching: false,
|
||||
matchMethod: "",
|
||||
expectedValue: "",
|
||||
jsonPath: "",
|
||||
};
|
||||
}
|
||||
|
||||
return defaults;
|
||||
};
|
||||
|
||||
export const useMonitorForm = ({
|
||||
data = null,
|
||||
defaultType = "http",
|
||||
}: UseMonitorFormOptions = {}) => {
|
||||
return useMemo(() => {
|
||||
const type = data?.type || defaultType;
|
||||
return { schema: monitorSchema, defaults: getMonitorDefaults(type, data) };
|
||||
const base = getBaseDefaults(data);
|
||||
|
||||
let defaults: MonitorFormData;
|
||||
|
||||
switch (type) {
|
||||
case "http":
|
||||
defaults = {
|
||||
...base,
|
||||
type: "http",
|
||||
url: data?.url || "",
|
||||
ignoreTlsErrors: data?.ignoreTlsErrors || false,
|
||||
useAdvancedMatching: data?.useAdvancedMatching || false,
|
||||
matchMethod: data?.matchMethod || "",
|
||||
expectedValue: data?.expectedValue || "",
|
||||
jsonPath: data?.jsonPath || "",
|
||||
};
|
||||
break;
|
||||
case "ping":
|
||||
defaults = {
|
||||
...base,
|
||||
type: "ping",
|
||||
url: data?.url || "",
|
||||
};
|
||||
break;
|
||||
case "port":
|
||||
defaults = {
|
||||
...base,
|
||||
type: "port",
|
||||
url: data?.url || "",
|
||||
port: data?.port || 80,
|
||||
};
|
||||
break;
|
||||
case "docker":
|
||||
defaults = {
|
||||
...base,
|
||||
type: "docker",
|
||||
url: data?.url || "",
|
||||
};
|
||||
break;
|
||||
case "game":
|
||||
defaults = {
|
||||
...base,
|
||||
type: "game",
|
||||
url: data?.url || "",
|
||||
port: data?.port || 27015,
|
||||
gameId: data?.gameId || "",
|
||||
};
|
||||
break;
|
||||
case "grpc":
|
||||
defaults = {
|
||||
...base,
|
||||
type: "grpc",
|
||||
url: data?.url || "",
|
||||
port: data?.port || 50051,
|
||||
grpcServiceName: data?.grpcServiceName || "",
|
||||
ignoreTlsErrors: data?.ignoreTlsErrors || false,
|
||||
};
|
||||
break;
|
||||
case "pagespeed":
|
||||
defaults = {
|
||||
...base,
|
||||
type: "pagespeed",
|
||||
url: data?.url || "",
|
||||
strategy: data?.strategy ?? DefaultPageSpeedStrategy,
|
||||
};
|
||||
break;
|
||||
case "hardware":
|
||||
defaults = {
|
||||
...base,
|
||||
type: "hardware",
|
||||
url: data?.url || "",
|
||||
secret: data?.secret || "",
|
||||
cpuAlertThreshold: data?.cpuAlertThreshold ?? 100,
|
||||
memoryAlertThreshold: data?.memoryAlertThreshold ?? 100,
|
||||
diskAlertThreshold: data?.diskAlertThreshold ?? 100,
|
||||
tempAlertThreshold: data?.tempAlertThreshold ?? 100,
|
||||
selectedDisks: data?.selectedDisks || [],
|
||||
};
|
||||
break;
|
||||
case "websocket":
|
||||
defaults = {
|
||||
...base,
|
||||
type: "websocket",
|
||||
url: data?.url || "",
|
||||
ignoreTlsErrors: data?.ignoreTlsErrors || false,
|
||||
};
|
||||
break;
|
||||
case "dns":
|
||||
defaults = {
|
||||
...base,
|
||||
type: "dns",
|
||||
url: data?.url || "",
|
||||
dnsServer: data?.dnsServer || "",
|
||||
dnsRecordType: data?.dnsRecordType || "A",
|
||||
};
|
||||
break;
|
||||
default:
|
||||
defaults = {
|
||||
...base,
|
||||
type: "http",
|
||||
url: "",
|
||||
ignoreTlsErrors: false,
|
||||
useAdvancedMatching: false,
|
||||
matchMethod: "",
|
||||
expectedValue: "",
|
||||
jsonPath: "",
|
||||
};
|
||||
}
|
||||
|
||||
return { schema: monitorSchema, defaults };
|
||||
}, [data, defaultType]);
|
||||
};
|
||||
@@ -78,14 +78,6 @@ function buildDefaults(data: Notification | null): NotificationFormData {
|
||||
accessToken: data.accessToken || "",
|
||||
};
|
||||
}
|
||||
if (data?.type === "ntfy") {
|
||||
return {
|
||||
type: "ntfy",
|
||||
notificationName: data.notificationName || "",
|
||||
address: data.address || "",
|
||||
topic: data.topic || "",
|
||||
};
|
||||
}
|
||||
// Default: email (covers both data === null and data.type === "email")
|
||||
return {
|
||||
type: "email",
|
||||
|
||||
@@ -31,7 +31,6 @@ export const useStatusPageForm = ({
|
||||
const defaults: StatusPageFormData = {
|
||||
companyName: data?.companyName || "",
|
||||
url: data?.url || generateDefaultUrl(),
|
||||
customDomain: data?.customDomain ?? null,
|
||||
timezone: resolveTimezone(data?.timezone),
|
||||
type: data?.type || ["uptime"],
|
||||
color: data?.color || "#13715B",
|
||||
|
||||
@@ -1,18 +0,0 @@
|
||||
import { useMemo } from "react";
|
||||
import { tagSchema, type TagFormData } from "@/Validation/tag";
|
||||
import type { Tag } from "@/Types/Tag";
|
||||
|
||||
interface UseTagsFormOptions {
|
||||
data?: Tag | null;
|
||||
}
|
||||
|
||||
export const useTagsForm = ({ data }: UseTagsFormOptions) => {
|
||||
return useMemo(() => {
|
||||
const defaults: TagFormData = {
|
||||
name: data?.name ?? "",
|
||||
color: data?.color ?? "#13715B",
|
||||
};
|
||||
|
||||
return { schema: tagSchema, defaults };
|
||||
}, [data]);
|
||||
};
|
||||
File diff suppressed because it is too large.
Load diff
@@ -1,14 +1,7 @@
|
||||
import Box from "@mui/material/Box";
|
||||
import Stack from "@mui/material/Stack";
|
||||
import Typography from "@mui/material/Typography";
|
||||
import {
|
||||
Table,
|
||||
Pagination,
|
||||
StatusLabel,
|
||||
Gauge,
|
||||
ColoredLabel,
|
||||
} from "@/Components/design-elements";
|
||||
import { SPACING } from "@/Utils/Theme/constants";
|
||||
import { Table, Pagination, StatusLabel, Gauge } from "@/Components/design-elements";
|
||||
import type { Header } from "@/Components/design-elements/Table";
|
||||
import { ActionsMenu, type ActionMenuItem } from "@/Components/actions-menu";
|
||||
import { ArrowUp, ArrowDown } from "lucide-react";
|
||||
@@ -20,12 +13,10 @@ import { useNavigate } from "react-router-dom";
|
||||
import { usePost } from "@/Hooks/UseApi";
|
||||
|
||||
import type { Monitor } from "@/Types/Monitor";
|
||||
import type { Tag } from "@/Types/Tag";
|
||||
import { Checkbox } from "@/Components/inputs";
|
||||
|
||||
interface InfraMonitorsTableProps {
|
||||
monitors: Monitor[];
|
||||
tags: Tag[];
|
||||
refetch: () => void;
|
||||
setSelectedMonitor: (monitor: Monitor | null) => void;
|
||||
sortField: string;
|
||||
@@ -43,7 +34,6 @@ interface InfraMonitorsTableProps {
|
||||
|
||||
export const InfraMonitorsTable = ({
|
||||
monitors,
|
||||
tags,
|
||||
refetch,
|
||||
setSelectedMonitor,
|
||||
sortField,
|
||||
@@ -277,32 +267,6 @@ export const InfraMonitorsTable = ({
|
||||
return <Gauge progress={diskUsage} />;
|
||||
},
|
||||
},
|
||||
{
|
||||
id: "tags",
|
||||
content: t("common.table.headers.tags"),
|
||||
render: (row) => {
|
||||
if (row.tags.length === 0) return "-";
|
||||
return (
|
||||
<Stack
|
||||
justifyContent={"center"}
|
||||
direction={isSmall ? "column" : "row"}
|
||||
gap={theme.spacing(SPACING.LG)}
|
||||
>
|
||||
{row.tags.map((tagId) => {
|
||||
const fullTag = tags.find((t) => t.id === tagId);
|
||||
if (!fullTag) return null;
|
||||
return (
|
||||
<ColoredLabel
|
||||
key={fullTag.id}
|
||||
text={fullTag.name}
|
||||
color={fullTag.color}
|
||||
/>
|
||||
);
|
||||
})}
|
||||
</Stack>
|
||||
);
|
||||
},
|
||||
},
|
||||
|
||||
{
|
||||
id: "actions",
|
||||
|
||||
@@ -1,7 +1,6 @@
|
||||
import Stack from "@mui/material/Stack";
|
||||
import Typography from "@mui/material/Typography";
|
||||
import useMediaQuery from "@mui/material/useMediaQuery";
|
||||
import { MonitorBasePageWithStates, ColoredLabel } from "@/Components/design-elements";
|
||||
import { MonitorBasePageWithStates } from "@/Components/design-elements";
|
||||
import { HeaderCreate } from "@/Components/common";
|
||||
import {
|
||||
ControlsFilter,
|
||||
@@ -14,9 +13,7 @@ import { Play, Pause } from "lucide-react";
|
||||
import { useGet, useDelete } from "@/Hooks/UseApi";
|
||||
import { useIsAdmin } from "@/Hooks/useIsAdmin";
|
||||
import type { Monitor, MonitorsWithChecksResponse } from "@/Types/Monitor";
|
||||
import type { Tag } from "@/Types/Tag";
|
||||
import { useTheme } from "@mui/material";
|
||||
import { SPACING } from "@/Utils/Theme/constants";
|
||||
import { useState, useCallback, useMemo } from "react";
|
||||
import { useTranslation } from "react-i18next";
|
||||
import { useSelector, useDispatch } from "react-redux";
|
||||
@@ -41,15 +38,12 @@ const InfrastructureMonitors = () => {
|
||||
// Local state
|
||||
const [selectedStatus, setSelectedStatus] = useState<string>("");
|
||||
const [selectedState, setSelectedState] = useState<string>("");
|
||||
const [selectedTags, setSelectedTags] = useState<string[]>([]);
|
||||
const [search, setSearch] = useState<string>("");
|
||||
const [page, setPage] = useState<number>(0);
|
||||
const [sortField, setSortField] = useState<string>("");
|
||||
const [sortOrder, setSortOrder] = useState<"asc" | "desc">("asc");
|
||||
const [selectedMonitor, setSelectedMonitor] = useState<Monitor | null>(null);
|
||||
|
||||
const { data: tags } = useGet<Tag[]>("/tags/team");
|
||||
|
||||
const isDialogOpen = Boolean(selectedMonitor);
|
||||
|
||||
const debouncedSearch = useDebounce<string>(search, 300);
|
||||
@@ -57,7 +51,6 @@ const InfrastructureMonitors = () => {
|
||||
const handleClearFilters = useCallback(() => {
|
||||
setSelectedStatus("");
|
||||
setSelectedState("");
|
||||
setSelectedTags([]);
|
||||
setSearch("");
|
||||
}, []);
|
||||
|
||||
@@ -88,7 +81,6 @@ const InfrastructureMonitors = () => {
|
||||
const monitorsWithChecksUrl = useMemo(() => {
|
||||
const params = new URLSearchParams();
|
||||
params.append("type", "hardware");
|
||||
selectedTags.forEach((tagId) => params.append("tags", tagId));
|
||||
params.append("limit", "1");
|
||||
if (page !== undefined) params.append("page", String(page));
|
||||
if (rowsPerPage) params.append("rowsPerPage", String(rowsPerPage));
|
||||
@@ -96,7 +88,7 @@ const InfrastructureMonitors = () => {
|
||||
if (field) params.append("field", field);
|
||||
if (sortOrder) params.append("order", sortOrder);
|
||||
return `/monitors/team/with-checks?${params.toString()}`;
|
||||
}, [page, rowsPerPage, filter, field, sortOrder, selectedTags]);
|
||||
}, [page, rowsPerPage, filter, field, sortOrder]);
|
||||
|
||||
const {
|
||||
data: monitorsWithChecksData,
|
||||
@@ -122,9 +114,7 @@ const InfrastructureMonitors = () => {
|
||||
} = useBulkMonitorActions(refetch, page);
|
||||
|
||||
// Check if any filters are active
|
||||
const hasActiveFilters = Boolean(
|
||||
selectedStatus || selectedState || selectedTags.length > 0 || search
|
||||
);
|
||||
const hasActiveFilters = Boolean(selectedStatus || selectedState || search);
|
||||
|
||||
// Show empty state only when there are truly no monitors (not just filtered out)
|
||||
const effectiveTotalCount =
|
||||
@@ -175,9 +165,6 @@ const InfrastructureMonitors = () => {
|
||||
setSelectedStatus={setSelectedStatus}
|
||||
selectedState={selectedState}
|
||||
setSelectedState={setSelectedState}
|
||||
tagOptions={tags ?? []}
|
||||
selectedTags={selectedTags}
|
||||
setSelectedTags={setSelectedTags}
|
||||
onClearFilters={handleClearFilters}
|
||||
/>
|
||||
<TextField
|
||||
@@ -189,30 +176,6 @@ const InfrastructureMonitors = () => {
|
||||
/>
|
||||
</Stack>
|
||||
|
||||
{selectedTags.length > 0 && (
|
||||
<Stack
|
||||
direction={isSmall ? "column" : "row"}
|
||||
alignItems={isSmall ? "flex-start" : "center"}
|
||||
flexWrap="wrap"
|
||||
gap={theme.spacing(SPACING.XL)}
|
||||
>
|
||||
<Typography color={theme.palette.text.secondary}>
|
||||
{t("pages.uptime.filters.activeTags")}
|
||||
</Typography>
|
||||
{selectedTags.map((tagId) => {
|
||||
const tag = tags?.find((t) => t.id === tagId);
|
||||
if (!tag) return null;
|
||||
return (
|
||||
<ColoredLabel
|
||||
key={tag.id}
|
||||
text={tag.name}
|
||||
color={tag.color}
|
||||
/>
|
||||
);
|
||||
})}
|
||||
</Stack>
|
||||
)}
|
||||
|
||||
{!isLoading && (
|
||||
<BulkActionsBar
|
||||
selectedCount={selectedRows.length}
|
||||
@@ -237,7 +200,6 @@ const InfrastructureMonitors = () => {
|
||||
|
||||
<InfraMonitorsTable
|
||||
monitors={monitorsWithChecksData?.monitors || []}
|
||||
tags={tags ?? []}
|
||||
refetch={refetch}
|
||||
setSelectedMonitor={setSelectedMonitor}
|
||||
sortField={sortField}
|
||||
|
||||
@@ -1,15 +1,12 @@
|
||||
import Stack from "@mui/material/Stack";
|
||||
import Typography from "@mui/material/Typography";
|
||||
import { Stats } from "@/Pages/Logs/components/Stats";
|
||||
import { MongoStats } from "@/Pages/Logs/components/MongoStats";
|
||||
import { MongoCollectionStats } from "./components/MongoCollectionStats";
|
||||
import { StatGauges } from "@/Pages/Logs/components/StatGauges";
|
||||
|
||||
import { useTheme } from "@mui/material";
|
||||
import { useTranslation } from "react-i18next";
|
||||
import { useGet } from "@/Hooks/UseApi";
|
||||
import type { Diagnostics } from "@/Types/Diagnostics";
|
||||
import { LAYOUT, SPACING } from "@/Utils/Theme/constants";
|
||||
|
||||
export const TabDiagnostics = () => {
|
||||
const theme = useTheme();
|
||||
@@ -22,12 +19,12 @@ export const TabDiagnostics = () => {
|
||||
} = useGet<Diagnostics>("/diagnostic/system", {}, { refreshInterval: 5000 });
|
||||
|
||||
return (
|
||||
<Stack gap={theme.spacing(LAYOUT.XL)}>
|
||||
<Stack gap={theme.spacing(LAYOUT.XS)}>
|
||||
<Stack gap={theme.spacing(SPACING.SM)}>
|
||||
<Stack gap={theme.spacing(12)}>
|
||||
<Stack gap={theme.spacing(4)}>
|
||||
<Stack gap={theme.spacing(1)}>
|
||||
<Typography
|
||||
variant="eyebrow"
|
||||
color={theme.palette.text.secondary}
|
||||
color="text.secondary"
|
||||
>
|
||||
{t("pages.logs.diagnostics.sections.runtimeStats.title")}
|
||||
</Typography>
|
||||
@@ -37,11 +34,11 @@ export const TabDiagnostics = () => {
|
||||
</Stack>
|
||||
<Stats diagnostics={diagnostics} />
|
||||
</Stack>
|
||||
<Stack gap={theme.spacing(LAYOUT.XS)}>
|
||||
<Stack gap={theme.spacing(SPACING.SM)}>
|
||||
<Stack gap={theme.spacing(4)}>
|
||||
<Stack gap={theme.spacing(1)}>
|
||||
<Typography
|
||||
variant="eyebrow"
|
||||
color={theme.palette.text.secondary}
|
||||
color="text.secondary"
|
||||
>
|
||||
{t("pages.logs.diagnostics.sections.memoryCpu.title")}
|
||||
</Typography>
|
||||
@@ -51,30 +48,6 @@ export const TabDiagnostics = () => {
|
||||
</Stack>
|
||||
<StatGauges diagnostics={diagnostics} />
|
||||
</Stack>
|
||||
<Stack gap={theme.spacing(LAYOUT.XS)}>
|
||||
<Typography
|
||||
variant="eyebrow"
|
||||
color={theme.palette.text.secondary}
|
||||
>
|
||||
{t("pages.logs.diagnostics.sections.mongoDBStats.title")}
|
||||
</Typography>
|
||||
<Typography color={theme.palette.text.secondary}>
|
||||
{t("pages.logs.diagnostics.sections.mongoDBStats.description")}
|
||||
</Typography>
|
||||
<MongoStats diagnostics={diagnostics} />
|
||||
</Stack>
|
||||
<Stack gap={theme.spacing(LAYOUT.XS)}>
|
||||
<Typography
|
||||
variant="eyebrow"
|
||||
color={theme.palette.text.secondary}
|
||||
>
|
||||
{t("pages.logs.diagnostics.sections.mongoDBCollectionStats.title")}
|
||||
</Typography>
|
||||
<Typography color={theme.palette.text.secondary}>
|
||||
{t("pages.logs.diagnostics.sections.mongoDBCollectionStats.description")}
|
||||
</Typography>
|
||||
<MongoCollectionStats diagnostics={diagnostics} />
|
||||
</Stack>
|
||||
</Stack>
|
||||
);
|
||||
};
|
||||
@@ -2,9 +2,8 @@ import Stack from "@mui/material/Stack";
|
||||
import Typography from "@mui/material/Typography";
|
||||
import Box from "@mui/material/Box";
|
||||
import { TableJobs, TableFailedJobs } from "./components/TableJobs";
|
||||
import { TableWorkers } from "./components/TableWorkers";
|
||||
|
||||
import { useTheme } from "@mui/material";
|
||||
import { useState } from "react";
|
||||
import { useTranslation, Trans } from "react-i18next";
|
||||
import { useGet, usePost } from "@/Hooks/UseApi";
|
||||
import type { QueueData } from "@/Types/Queue";
|
||||
@@ -16,27 +15,16 @@ import { SPACING } from "@/Utils/Theme/constants";
|
||||
export const TabQueue = () => {
|
||||
const theme = useTheme();
|
||||
const { t } = useTranslation();
|
||||
const [page, setPage] = useState(0);
|
||||
const [rowsPerPage, setRowsPerPage] = useState(10);
|
||||
const {
|
||||
data: queueData,
|
||||
isLoading,
|
||||
// error,
|
||||
refetch,
|
||||
} = useGet<QueueData>(
|
||||
`/queue/all-metrics?page=${page}&rowsPerPage=${rowsPerPage}`,
|
||||
{},
|
||||
{ refreshInterval: 1000, keepPreviousData: true }
|
||||
);
|
||||
} = useGet<QueueData>("/queue/all-metrics", {}, { refreshInterval: 1000 });
|
||||
|
||||
const { post, loading: isFlushing } = usePost();
|
||||
|
||||
const jobs = queueData?.jobs ?? [];
|
||||
const jobsCount = queueData?.count ?? 0;
|
||||
const workers = (queueData?.metrics?.workers ?? []).map((worker, idx) => ({
|
||||
...worker,
|
||||
id: idx,
|
||||
}));
|
||||
const metrics = queueData?.metrics ?? null;
|
||||
const hasNeverRun = !isLoading && metrics !== null && (metrics.totalRuns ?? 0) === 0;
|
||||
const noQueueData = !isLoading && metrics === null && jobs.length === 0;
|
||||
@@ -58,34 +46,6 @@ export const TabQueue = () => {
|
||||
return (
|
||||
<Stack gap={theme.spacing(16)}>
|
||||
<Metrics metrics={metrics} />
|
||||
<Stack gap={theme.spacing(3)}>
|
||||
<Stack gap={theme.spacing(1)}>
|
||||
<Typography
|
||||
variant="eyebrow"
|
||||
color={theme.palette.text.secondary}
|
||||
>
|
||||
{t("pages.logs.workers")}
|
||||
</Typography>
|
||||
<Typography color={theme.palette.text.secondary}>
|
||||
<Trans
|
||||
i18nKey="pages.logs.workersExplainers"
|
||||
components={{
|
||||
highlight: (
|
||||
<Box
|
||||
component="span"
|
||||
bgcolor={theme.palette.rowStatus.running}
|
||||
color={theme.palette.text.primary}
|
||||
px={SPACING.SM}
|
||||
py={SPACING.XXS}
|
||||
borderRadius={theme.shape.borderRadius}
|
||||
/>
|
||||
),
|
||||
}}
|
||||
/>
|
||||
</Typography>
|
||||
</Stack>
|
||||
<TableWorkers queueWorkers={workers} />
|
||||
</Stack>
|
||||
<Stack gap={theme.spacing(3)}>
|
||||
<Stack gap={theme.spacing(1)}>
|
||||
<Typography
|
||||
@@ -112,17 +72,7 @@ export const TabQueue = () => {
|
||||
/>
|
||||
</Typography>
|
||||
</Stack>
|
||||
<TableJobs
|
||||
jobs={jobs}
|
||||
count={jobsCount}
|
||||
page={page}
|
||||
rowsPerPage={rowsPerPage}
|
||||
onPageChange={(_, newPage) => setPage(newPage)}
|
||||
onRowsPerPageChange={(event) => {
|
||||
setRowsPerPage(parseInt(event.target.value, 10));
|
||||
setPage(0);
|
||||
}}
|
||||
/>
|
||||
<TableJobs jobs={jobs} />
|
||||
</Stack>
|
||||
<Stack gap={theme.spacing(3)}>
|
||||
<Stack gap={theme.spacing(1)}>
|
||||
|
||||
@@ -1,104 +0,0 @@
|
||||
import Box from "@mui/material/Box";
|
||||
import { StatBox, Gauge, Tooltip } from "@/Components/design-elements";
|
||||
import Stack from "@mui/material/Stack";
|
||||
import Typography from "@mui/material/Typography";
|
||||
|
||||
import { useTranslation } from "react-i18next";
|
||||
import prettyBytes from "pretty-bytes";
|
||||
import { useTheme } from "@mui/material";
|
||||
import type { Diagnostics } from "@/Types/Diagnostics";
|
||||
import { LAYOUT } from "@/Utils/Theme/constants";
|
||||
|
||||
interface MongoStatsProps {
|
||||
diagnostics: Diagnostics | null;
|
||||
}
|
||||
|
||||
export const MongoCollectionStats = ({ diagnostics }: MongoStatsProps) => {
|
||||
const theme = useTheme();
|
||||
const { t } = useTranslation();
|
||||
|
||||
const mongoStats = diagnostics?.mongoStats;
|
||||
if (!mongoStats) {
|
||||
return null;
|
||||
}
|
||||
|
||||
return (
|
||||
<Box
|
||||
display={"grid"}
|
||||
gap={theme.spacing(LAYOUT.MD)}
|
||||
sx={{
|
||||
gridTemplateColumns: { xs: "1fr", md: "repeat(5, 1fr)" },
|
||||
"& > *": { width: "100% !important" },
|
||||
}}
|
||||
>
|
||||
{mongoStats.collections.map((colStat) => (
|
||||
<StatBox
|
||||
key={colStat.name}
|
||||
title={colStat.name}
|
||||
subtitle={""}
|
||||
>
|
||||
<Stack
|
||||
direction={"row"}
|
||||
alignItems={"center"}
|
||||
justifyContent={"space-between"}
|
||||
>
|
||||
<Stack>
|
||||
{/* <Typography variant="body2">{`Documents: ${colStat.documentCount}`}</Typography> */}
|
||||
<Typography variant="body2">
|
||||
{t("pages.logs.diagnostics.mongoDBCollectionStats.documents", {
|
||||
count: colStat.documentCount,
|
||||
})}
|
||||
</Typography>
|
||||
{colStat.bucketCount !== undefined && (
|
||||
<Typography variant="body2">
|
||||
{t("pages.logs.diagnostics.mongoDBCollectionStats.bucketCount", {
|
||||
count: colStat.bucketCount,
|
||||
})}
|
||||
</Typography>
|
||||
)}
|
||||
<Typography variant="body2">
|
||||
{t("pages.logs.diagnostics.mongoDBCollectionStats.storageSize", {
|
||||
size: prettyBytes(colStat.storageSize),
|
||||
})}
|
||||
</Typography>
|
||||
<Typography variant="body2">
|
||||
{t("pages.logs.diagnostics.mongoDBCollectionStats.indexSize", {
|
||||
size: prettyBytes(colStat.totalIndexSize),
|
||||
})}
|
||||
</Typography>
|
||||
<Typography variant="body2">
|
||||
{t("pages.logs.diagnostics.mongoDBCollectionStats.totalSize", {
|
||||
size: prettyBytes(colStat.totalSize),
|
||||
})}
|
||||
</Typography>
|
||||
</Stack>
|
||||
<Stack alignItems={"center"}>
|
||||
<Tooltip
|
||||
title={t("pages.logs.diagnostics.mongoDBCollectionStats.dbUsageTooltip", {
|
||||
percentage: ((colStat.totalSize / mongoStats.totalSize) * 100).toFixed(
|
||||
2
|
||||
),
|
||||
})}
|
||||
placement="top"
|
||||
slotProps={{
|
||||
popper: {
|
||||
modifiers: [
|
||||
{
|
||||
name: "offset",
|
||||
options: {
|
||||
offset: [0, -10],
|
||||
},
|
||||
},
|
||||
],
|
||||
},
|
||||
}}
|
||||
>
|
||||
<Gauge progress={(colStat.totalSize / mongoStats.totalSize) * 100} />
|
||||
</Tooltip>
|
||||
</Stack>
|
||||
</Stack>
|
||||
</StatBox>
|
||||
))}
|
||||
</Box>
|
||||
);
|
||||
};
|
||||
@@ -1,74 +0,0 @@
|
||||
import Box from "@mui/material/Box";
|
||||
import { StatBox } from "@/Components/design-elements";
|
||||
|
||||
import { useTranslation } from "react-i18next";
|
||||
import prettyBytes from "pretty-bytes";
|
||||
import { useTheme } from "@mui/material";
|
||||
import type { Diagnostics } from "@/Types/Diagnostics";
|
||||
import { LAYOUT } from "@/Utils/Theme/constants";
|
||||
|
||||
interface MongoStatsProps {
|
||||
diagnostics: Diagnostics | null;
|
||||
}
|
||||
|
||||
export const MongoStats = ({ diagnostics }: MongoStatsProps) => {
|
||||
const theme = useTheme();
|
||||
const { t } = useTranslation();
|
||||
|
||||
const mongoStats = diagnostics?.mongoStats;
|
||||
if (!mongoStats) {
|
||||
return null;
|
||||
}
|
||||
|
||||
return (
|
||||
<Box
|
||||
display={"grid"}
|
||||
gap={theme.spacing(LAYOUT.MD)}
|
||||
sx={{
|
||||
gridTemplateColumns: { xs: "1fr", md: "repeat(5, 1fr)" },
|
||||
"& > *": { width: "100% !important" },
|
||||
}}
|
||||
>
|
||||
<StatBox
|
||||
title={t("pages.logs.diagnostics.mongoDBStats.readyState")}
|
||||
subtitle={mongoStats.readyState.toString()}
|
||||
/>
|
||||
<StatBox
|
||||
title={t("pages.logs.diagnostics.mongoDBStats.readsPerSecond")}
|
||||
subtitle={mongoStats.readsPerSecond.toFixed(0)}
|
||||
/>
|
||||
<StatBox
|
||||
title={t("pages.logs.diagnostics.mongoDBStats.insertsPerSecond")}
|
||||
subtitle={mongoStats.insertsPerSecond.toFixed(0)}
|
||||
/>
|
||||
<StatBox
|
||||
title={t("pages.logs.diagnostics.mongoDBStats.updatesPerSecond")}
|
||||
subtitle={mongoStats.updatesPerSecond.toFixed(0)}
|
||||
/>
|
||||
<StatBox
|
||||
title={t("pages.logs.diagnostics.mongoDBStats.deletesPerSecond")}
|
||||
subtitle={mongoStats.deletesPerSecond.toFixed(0)}
|
||||
/>
|
||||
<StatBox
|
||||
title={t("pages.logs.diagnostics.mongoDBStats.writesPerSecond")}
|
||||
subtitle={mongoStats.writesPerSecond.toFixed(0)}
|
||||
/>
|
||||
<StatBox
|
||||
title={t("pages.logs.diagnostics.mongoDBStats.host")}
|
||||
subtitle={mongoStats.host}
|
||||
/>
|
||||
<StatBox
|
||||
title={t("pages.logs.diagnostics.mongoDBStats.port")}
|
||||
subtitle={mongoStats.port.toString()}
|
||||
/>
|
||||
<StatBox
|
||||
title={t("pages.logs.diagnostics.mongoDBStats.dbName")}
|
||||
subtitle={mongoStats.dbName}
|
||||
/>
|
||||
<StatBox
|
||||
title={t("pages.logs.diagnostics.mongoDBStats.storageSize")}
|
||||
subtitle={prettyBytes(mongoStats.totalSize)}
|
||||
/>
|
||||
</Box>
|
||||
);
|
||||
};
|
||||
@@ -1,4 +1,4 @@
|
||||
import { Table, Pagination } from "@/Components/design-elements";
|
||||
import { Table } from "@/Components/design-elements";
|
||||
import { Typography, useTheme } from "@mui/material";
|
||||
import prettyMilliseconds from "pretty-ms";
|
||||
import { formatTimestamp } from "@/Utils/TimeUtils";
|
||||
@@ -6,27 +6,14 @@ import { formatTimestamp } from "@/Utils/TimeUtils";
|
||||
import { useTranslation } from "react-i18next";
|
||||
import type { QueueJobFailure, QueueJobSummary, QueueMetrics } from "@/Types/Queue";
|
||||
import type { Header } from "@/Components/design-elements";
|
||||
import type { TablePaginationProps } from "@mui/material/TablePagination";
|
||||
|
||||
type QueueJobWithId = QueueJobSummary & { id: string | number };
|
||||
|
||||
interface TableJobsProps {
|
||||
jobs: QueueJobSummary[];
|
||||
count: number;
|
||||
page: number;
|
||||
rowsPerPage: number;
|
||||
onPageChange: TablePaginationProps["onPageChange"];
|
||||
onRowsPerPageChange: TablePaginationProps["onRowsPerPageChange"];
|
||||
}
|
||||
|
||||
export const TableJobs = ({
|
||||
jobs,
|
||||
count,
|
||||
page,
|
||||
rowsPerPage,
|
||||
onPageChange,
|
||||
onRowsPerPageChange,
|
||||
}: TableJobsProps) => {
|
||||
export const TableJobs = ({ jobs }: TableJobsProps) => {
|
||||
const { t } = useTranslation();
|
||||
const theme = useTheme();
|
||||
|
||||
@@ -140,53 +127,21 @@ export const TableJobs = ({
|
||||
);
|
||||
},
|
||||
},
|
||||
{
|
||||
id: "lockedBy",
|
||||
content: t("pages.logs.table.headers.lockedBy"),
|
||||
render: (row) => {
|
||||
const lockedBy = row.lockedBy;
|
||||
if (!lockedBy) {
|
||||
return <Typography sx={cellSx}>-</Typography>;
|
||||
}
|
||||
|
||||
const workerId = lockedBy.split(":")[2];
|
||||
const shortWorkerId = workerId.slice(workerId.length - 8);
|
||||
return (
|
||||
<Typography
|
||||
title={workerId}
|
||||
sx={cellSx}
|
||||
>
|
||||
{`...${shortWorkerId}`}
|
||||
</Typography>
|
||||
);
|
||||
},
|
||||
},
|
||||
];
|
||||
|
||||
return (
|
||||
<>
|
||||
<Table
|
||||
headers={headers}
|
||||
data={jobsWithId}
|
||||
getRowSx={(row) => ({
|
||||
...(row.lockedAt && {
|
||||
"& td": { backgroundColor: theme.palette.rowStatus.running },
|
||||
}),
|
||||
...(row.monitorActive === false && {
|
||||
"& td": { backgroundColor: theme.palette.rowStatus.paused },
|
||||
}),
|
||||
})}
|
||||
/>
|
||||
<Pagination
|
||||
component="div"
|
||||
count={count}
|
||||
page={page}
|
||||
rowsPerPage={rowsPerPage}
|
||||
onPageChange={onPageChange}
|
||||
onRowsPerPageChange={onRowsPerPageChange}
|
||||
itemsOnPage={jobs.length}
|
||||
/>
|
||||
</>
|
||||
<Table
|
||||
headers={headers}
|
||||
data={jobsWithId}
|
||||
getRowSx={(row) => ({
|
||||
...(row.lockedAt && {
|
||||
"& td": { backgroundColor: theme.palette.rowStatus.running },
|
||||
}),
|
||||
...(row.monitorActive === false && {
|
||||
"& td": { backgroundColor: theme.palette.rowStatus.paused },
|
||||
}),
|
||||
})}
|
||||
/>
|
||||
);
|
||||
};
|
||||
|
||||
|
||||
@@ -1,94 +0,0 @@
|
||||
import { Table } from "@/Components/design-elements";
|
||||
import { Typography, useTheme } from "@mui/material";
|
||||
import { formatTimestamp } from "@/Utils/TimeUtils";
|
||||
|
||||
import { useTranslation } from "react-i18next";
|
||||
import type { QueueWorker } from "@/Types/Queue";
|
||||
import type { Header } from "@/Components/design-elements";
|
||||
|
||||
type QueueWorkerWithId = QueueWorker & { id: number };
|
||||
|
||||
interface TableWorkersProps {
|
||||
queueWorkers: QueueWorkerWithId[];
|
||||
}
|
||||
|
||||
export const TableWorkers = ({ queueWorkers }: TableWorkersProps) => {
|
||||
const { t } = useTranslation();
|
||||
const theme = useTheme();
|
||||
|
||||
const cellSx = {
|
||||
whiteSpace: "nowrap" as const,
|
||||
overflow: "hidden",
|
||||
textOverflow: "ellipsis",
|
||||
maxWidth: 220,
|
||||
};
|
||||
|
||||
const headers: Header<QueueWorkerWithId>[] = [
|
||||
{
|
||||
id: "host",
|
||||
content: t("pages.logs.table.headers.host"),
|
||||
render: (row) => {
|
||||
const host = row.workerId.split(":")[0];
|
||||
return (
|
||||
<Typography
|
||||
fontFamily={theme.typography.fontFamilyMonospace}
|
||||
sx={cellSx}
|
||||
>
|
||||
{host}
|
||||
</Typography>
|
||||
);
|
||||
},
|
||||
},
|
||||
{
|
||||
id: "processId",
|
||||
content: t("pages.logs.table.headers.processId"),
|
||||
render: (row) => {
|
||||
const processId = row.workerId.split(":")[1];
|
||||
return (
|
||||
<Typography
|
||||
fontFamily={theme.typography.fontFamilyMonospace}
|
||||
sx={cellSx}
|
||||
>
|
||||
{processId}
|
||||
</Typography>
|
||||
);
|
||||
},
|
||||
},
|
||||
{
|
||||
id: "id",
|
||||
content: t("pages.logs.table.headers.workerId"),
|
||||
render: (row) => {
|
||||
const workerId = row.workerId.split(":")[2];
|
||||
const shortWorkerId = workerId.slice(workerId.length - 8);
|
||||
return (
|
||||
<Typography
|
||||
fontFamily={theme.typography.fontFamilyMonospace}
|
||||
title={workerId}
|
||||
sx={cellSx}
|
||||
>
|
||||
{`...${shortWorkerId}`}
|
||||
</Typography>
|
||||
);
|
||||
},
|
||||
},
|
||||
{
|
||||
id: "mode",
|
||||
content: t("pages.logs.table.headers.workerMode"),
|
||||
render: (row) => <Typography sx={cellSx}>{row.mode}</Typography>,
|
||||
},
|
||||
{
|
||||
id: "lastSeen",
|
||||
content: t("pages.logs.table.headers.lastSeenAt"),
|
||||
render: (row) => (
|
||||
<Typography sx={cellSx}>{formatTimestamp(row.lastSeenAt)}</Typography>
|
||||
),
|
||||
},
|
||||
];
|
||||
|
||||
return (
|
||||
<Table
|
||||
headers={headers}
|
||||
data={queueWorkers}
|
||||
/>
|
||||
);
|
||||
};
|
||||
@@ -150,8 +150,7 @@ const NotificationsCreatePage = () => {
|
||||
{watchedType !== "matrix" &&
|
||||
watchedType !== "telegram" &&
|
||||
watchedType !== "pushover" &&
|
||||
watchedType !== "twilio" &&
|
||||
watchedType !== "ntfy" && (
|
||||
watchedType !== "twilio" && (
|
||||
<ConfigBox
|
||||
title={addressConfig.title}
|
||||
subtitle={addressConfig.description}
|
||||
@@ -175,48 +174,6 @@ const NotificationsCreatePage = () => {
|
||||
}
|
||||
/>
|
||||
)}
|
||||
{watchedType === "ntfy" && (
|
||||
<ConfigBox
|
||||
title={t("pages.notifications.form.ntfy.title")}
|
||||
subtitle={t("pages.notifications.form.ntfy.description")}
|
||||
rightContent={
|
||||
<Stack spacing={theme.spacing(8)}>
|
||||
<Controller
|
||||
name="address"
|
||||
control={control}
|
||||
defaultValue={"address" in defaults ? defaults.address : ""}
|
||||
render={({ field, fieldState }) => (
|
||||
<TextField
|
||||
{...field}
|
||||
type="text"
|
||||
fieldLabel={t("pages.notifications.form.ntfy.optionServerUrl")}
|
||||
placeholder={t("pages.notifications.form.ntfy.placeholderServerUrl")}
|
||||
fullWidth
|
||||
error={!!fieldState.error}
|
||||
helperText={fieldState.error?.message ?? ""}
|
||||
/>
|
||||
)}
|
||||
/>
|
||||
<Controller
|
||||
name="topic"
|
||||
control={control}
|
||||
defaultValue={"topic" in defaults ? defaults.topic : ""}
|
||||
render={({ field, fieldState }) => (
|
||||
<TextField
|
||||
{...field}
|
||||
type="text"
|
||||
fieldLabel={t("pages.notifications.form.ntfy.optionTopic")}
|
||||
placeholder={t("pages.notifications.form.ntfy.placeholderTopic")}
|
||||
fullWidth
|
||||
error={!!fieldState.error}
|
||||
helperText={fieldState.error?.message ?? ""}
|
||||
/>
|
||||
)}
|
||||
/>
|
||||
</Stack>
|
||||
}
|
||||
/>
|
||||
)}
|
||||
{watchedType === "telegram" && (
|
||||
<ConfigBox
|
||||
title={t("pages.notifications.form.telegram.title")}
|
||||
|
||||
@@ -6,9 +6,8 @@ import {
|
||||
Pagination,
|
||||
StatusLabel,
|
||||
StrategyBadge,
|
||||
ColoredLabel,
|
||||
} from "@/Components/design-elements";
|
||||
import { LAYOUT, SPACING } from "@/Utils/Theme/constants";
|
||||
import { LAYOUT } from "@/Utils/Theme/constants";
|
||||
import { HistogramPageSpeed } from "@/Components/monitors";
|
||||
import { ArrowDown, ArrowUp } from "lucide-react";
|
||||
import type { Header } from "@/Components/design-elements/Table";
|
||||
@@ -21,12 +20,10 @@ import { useNavigate } from "react-router-dom";
|
||||
import { usePatch } from "@/Hooks/UseApi";
|
||||
|
||||
import type { Monitor, MonitorWithChecks } from "@/Types/Monitor";
|
||||
import type { Tag } from "@/Types/Tag";
|
||||
import type { ActionMenuItem } from "@/Components/actions-menu";
|
||||
|
||||
export const PageSpeedMonitorsTable = ({
|
||||
monitors,
|
||||
tags,
|
||||
refetch,
|
||||
setSelectedMonitor,
|
||||
sortField,
|
||||
@@ -40,7 +37,6 @@ export const PageSpeedMonitorsTable = ({
|
||||
setRowsPerPage,
|
||||
}: {
|
||||
monitors: MonitorWithChecks[];
|
||||
tags: Tag[];
|
||||
refetch: Function;
|
||||
setSelectedMonitor: Function;
|
||||
sortField: string;
|
||||
@@ -237,32 +233,6 @@ export const PageSpeedMonitorsTable = ({
|
||||
);
|
||||
},
|
||||
},
|
||||
{
|
||||
id: "tags",
|
||||
content: t("common.table.headers.tags"),
|
||||
render: (row) => {
|
||||
if (row.tags.length === 0) return "-";
|
||||
return (
|
||||
<Stack
|
||||
justifyContent={"center"}
|
||||
direction={isSmall ? "column" : "row"}
|
||||
gap={theme.spacing(SPACING.LG)}
|
||||
>
|
||||
{row.tags.map((tagId) => {
|
||||
const fullTag = tags.find((tag) => tag.id === tagId);
|
||||
if (!fullTag) return null;
|
||||
return (
|
||||
<ColoredLabel
|
||||
key={fullTag.id}
|
||||
text={fullTag.name}
|
||||
color={fullTag.color}
|
||||
/>
|
||||
);
|
||||
})}
|
||||
</Stack>
|
||||
);
|
||||
},
|
||||
},
|
||||
|
||||
{
|
||||
id: "actions",
|
||||
|
||||
@@ -1,32 +1,22 @@
|
||||
import {
|
||||
MonitorBasePageWithStates,
|
||||
PageSpeedKeyPriorityFallback,
|
||||
ColoredLabel,
|
||||
} from "@/Components/design-elements";
|
||||
import { Dialog, TextField } from "@/Components/inputs";
|
||||
import { Dialog } from "@/Components/inputs";
|
||||
import { HeaderCreate } from "@/Components/common";
|
||||
import { PageSpeedMonitorsTable } from "@/Pages/PageSpeed/Monitors/Components/PageSpeedMonitorsTable";
|
||||
import type { Monitor } from "@/Types/Monitor";
|
||||
import type { Tag } from "@/Types/Tag";
|
||||
import Stack from "@mui/material/Stack";
|
||||
import Typography from "@mui/material/Typography";
|
||||
import useMediaQuery from "@mui/material/useMediaQuery";
|
||||
import { useTheme } from "@mui/material";
|
||||
import { SPACING } from "@/Utils/Theme/constants";
|
||||
|
||||
import { useTranslation } from "react-i18next";
|
||||
import { useCallback, useMemo, useState } from "react";
|
||||
import { useMemo, useState } from "react";
|
||||
import { useIsAdmin } from "@/Hooks/useIsAdmin";
|
||||
import { useGet, useDelete } from "@/Hooks/UseApi";
|
||||
import useDebounce from "@/Hooks/useDebounce";
|
||||
import type { MonitorsWithChecksResponse } from "@/Types/Monitor";
|
||||
import type { AppSettingsResponse } from "@/Types/Settings";
|
||||
import { ControlsFilter, HeaderMonitorsSummary } from "@/Components/monitors";
|
||||
import { HeaderMonitorsSummary } from "@/Components/monitors";
|
||||
|
||||
const PageSpeedMonitorsPage = () => {
|
||||
const { t } = useTranslation();
|
||||
const theme = useTheme();
|
||||
const isSmall = useMediaQuery(theme.breakpoints.down("md"));
|
||||
const isAdmin = useIsAdmin();
|
||||
const { deleteFn, loading: isDeleting } = useDelete();
|
||||
|
||||
@@ -43,50 +33,17 @@ const PageSpeedMonitorsPage = () => {
|
||||
const [sortOrder, setSortOrder] = useState<"asc" | "desc">("asc");
|
||||
const [page, setPage] = useState(0);
|
||||
const [rowsPerPage, setRowsPerPage] = useState(10);
|
||||
const [selectedTags, setSelectedTags] = useState<string[]>([]);
|
||||
const [selectedStatus, setSelectedStatus] = useState<string>("");
|
||||
const [selectedState, setSelectedState] = useState<string>("");
|
||||
const [search, setSearch] = useState<string>("");
|
||||
|
||||
const debouncedSearch = useDebounce<string>(search, 300);
|
||||
|
||||
// Status: pass "up"/"down" directly to the API
|
||||
// State: "active" -> true, "paused" -> false
|
||||
const toFilterStatus = useMemo(() => {
|
||||
if (selectedStatus === "up") return "up";
|
||||
if (selectedStatus === "down") return "down";
|
||||
return undefined;
|
||||
}, [selectedStatus]);
|
||||
|
||||
const toFilterActive = useMemo(() => {
|
||||
if (selectedState === "active") return "true";
|
||||
if (selectedState === "paused") return "false";
|
||||
return undefined;
|
||||
}, [selectedState]);
|
||||
|
||||
// Priority: status > isActive > search > sort
|
||||
const filterLookup = new Map<string | undefined, string>([
|
||||
[toFilterStatus, "status"],
|
||||
[toFilterActive, "isActive"],
|
||||
]);
|
||||
const activeFilter = [...filterLookup].find(([key]) => key !== undefined);
|
||||
const field = activeFilter?.[1] || (debouncedSearch ? "name" : sortField || undefined);
|
||||
const filter = activeFilter?.[0] || debouncedSearch;
|
||||
|
||||
const { data: tags } = useGet<Tag[]>("/tags/team");
|
||||
|
||||
const monitorsWithChecksUrl = useMemo(() => {
|
||||
const params = new URLSearchParams();
|
||||
params.append("type", "pagespeed");
|
||||
selectedTags.forEach((tagId) => params.append("tags", tagId));
|
||||
params.append("limit", "25");
|
||||
if (page !== undefined) params.append("page", String(page));
|
||||
if (rowsPerPage) params.append("rowsPerPage", String(rowsPerPage));
|
||||
if (filter) params.append("filter", filter);
|
||||
if (field) params.append("field", field);
|
||||
if (sortField) params.append("field", sortField);
|
||||
if (sortOrder) params.append("order", sortOrder);
|
||||
return `/monitors/team/with-checks?${params.toString()}`;
|
||||
}, [page, rowsPerPage, sortOrder, selectedTags, filter, field]);
|
||||
}, [page, rowsPerPage, sortField, sortOrder]);
|
||||
|
||||
const {
|
||||
data: monitorsData,
|
||||
@@ -118,28 +75,12 @@ const PageSpeedMonitorsPage = () => {
|
||||
setSelectedMonitor(null);
|
||||
};
|
||||
|
||||
const handleClearFilters = useCallback(() => {
|
||||
setSelectedStatus("");
|
||||
setSelectedState("");
|
||||
setSelectedTags([]);
|
||||
setSearch("");
|
||||
}, []);
|
||||
|
||||
const hasActiveFilters = Boolean(
|
||||
selectedStatus || selectedState || selectedTags.length > 0 || search
|
||||
);
|
||||
|
||||
const effectiveTotalCount =
|
||||
hasActiveFilters && (summary?.totalMonitors ?? 0) === 0
|
||||
? 1
|
||||
: (summary?.totalMonitors ?? 0);
|
||||
|
||||
return (
|
||||
<MonitorBasePageWithStates
|
||||
headerKey="pageSpeed"
|
||||
loading={isLoading}
|
||||
error={monitorsError || settingsError}
|
||||
totalCount={effectiveTotalCount}
|
||||
totalCount={summary?.totalMonitors ?? 0}
|
||||
page="pageSpeed"
|
||||
actionLink="/pagespeed/create"
|
||||
priorityFallback={showApiKeyWarning ? <PageSpeedKeyPriorityFallback /> : undefined}
|
||||
@@ -150,59 +91,8 @@ const PageSpeedMonitorsPage = () => {
|
||||
isAdmin={isAdmin}
|
||||
/>
|
||||
<HeaderMonitorsSummary summary={summary} />
|
||||
|
||||
<Stack
|
||||
direction={isSmall ? "column" : "row"}
|
||||
justifyContent={isSmall ? "flex-start" : "space-between"}
|
||||
gap={theme.spacing(4)}
|
||||
>
|
||||
<ControlsFilter
|
||||
showTypes={false}
|
||||
selectedStatus={selectedStatus}
|
||||
setSelectedStatus={setSelectedStatus}
|
||||
selectedState={selectedState}
|
||||
setSelectedState={setSelectedState}
|
||||
tagOptions={tags ?? []}
|
||||
selectedTags={selectedTags}
|
||||
setSelectedTags={setSelectedTags}
|
||||
onClearFilters={handleClearFilters}
|
||||
/>
|
||||
<TextField
|
||||
placeholder={t("pages.uptime.filters.search.placeholder")}
|
||||
value={search}
|
||||
onChange={(event) => {
|
||||
setSearch(event.target.value);
|
||||
}}
|
||||
/>
|
||||
</Stack>
|
||||
|
||||
{selectedTags.length > 0 && (
|
||||
<Stack
|
||||
direction={isSmall ? "column" : "row"}
|
||||
alignItems={isSmall ? "flex-start" : "center"}
|
||||
flexWrap="wrap"
|
||||
gap={theme.spacing(SPACING.XL)}
|
||||
>
|
||||
<Typography color={theme.palette.text.secondary}>
|
||||
{t("pages.uptime.filters.activeTags")}
|
||||
</Typography>
|
||||
{selectedTags.map((tagId) => {
|
||||
const tag = tags?.find((t) => t.id === tagId);
|
||||
if (!tag) return null;
|
||||
return (
|
||||
<ColoredLabel
|
||||
key={tag.id}
|
||||
text={tag.name}
|
||||
color={tag.color}
|
||||
/>
|
||||
);
|
||||
})}
|
||||
</Stack>
|
||||
)}
|
||||
|
||||
<PageSpeedMonitorsTable
|
||||
monitors={monitors || []}
|
||||
tags={tags ?? []}
|
||||
refetch={refetch}
|
||||
setSelectedMonitor={setSelectedMonitor}
|
||||
sortField={sortField}
|
||||
|
||||
@@ -1,4 +1,4 @@
|
||||
import { BasePage, ConfigBox, StepProgress } from "@/Components/design-elements";
|
||||
import { BasePage, ConfigBox } from "@/Components/design-elements";
|
||||
import Stack from "@mui/material/Stack";
|
||||
import { logger } from "@/Utils/logger";
|
||||
import { SPACING, LAYOUT } from "@/Utils/Theme/constants";
|
||||
@@ -26,7 +26,6 @@ import { useForm, Controller } from "react-hook-form";
|
||||
import { zodResolver } from "@hookform/resolvers/zod";
|
||||
import { useStatusPageForm } from "@/Hooks/useStatusPageForm";
|
||||
import type { StatusPageFormData } from "@/Validation/statusPage";
|
||||
import { statusPageStepCount, statusPageStepFieldsFor } from "@/Validation/statusPage";
|
||||
import { useGet, usePost, usePut, useDelete } from "@/Hooks/UseApi";
|
||||
import type { Monitor } from "@/Types/Monitor";
|
||||
import type { MonitorDisplayType, StatusPageResponse } from "@/Types/StatusPage";
|
||||
@@ -87,27 +86,13 @@ const CreateStatusPage = () => {
|
||||
defaultValues: defaults,
|
||||
});
|
||||
|
||||
const { control, reset, handleSubmit, trigger } = form;
|
||||
const { control, reset, handleSubmit } = form;
|
||||
|
||||
// Reset form when defaults change (from fetched data)
|
||||
useEffect(() => {
|
||||
reset(defaults);
|
||||
}, [defaults, reset]);
|
||||
|
||||
// Multi-step wizard, create only. The configure (edit) flow keeps the flat
|
||||
// form, where showStep() is always true.
|
||||
const [currentStep, setCurrentStep] = useState(0);
|
||||
const showStep = (step: number) => !isCreate || currentStep === step;
|
||||
const totalSteps = statusPageStepCount();
|
||||
|
||||
const handleNext = async () => {
|
||||
const isValid = await trigger(statusPageStepFieldsFor(currentStep));
|
||||
if (isValid) {
|
||||
setCurrentStep((step) => step + 1);
|
||||
}
|
||||
};
|
||||
const handleBack = () => setCurrentStep((step) => step - 1);
|
||||
|
||||
const watchedMonitorIds: string[] = form.watch("monitors") ?? [];
|
||||
const computedTypes: MonitorDisplayType[] = useMemo(() => {
|
||||
const selectedMonitors = (watchedMonitorIds ?? [])
|
||||
@@ -151,11 +136,6 @@ const CreateStatusPage = () => {
|
||||
fd.append("isPublished", String(data.isPublished));
|
||||
if (data.companyName) fd.append("companyName", data.companyName);
|
||||
if (data.url) fd.append("url", data.url);
|
||||
if (data.customDomain !== undefined && data.customDomain !== null) {
|
||||
fd.append("customDomain", data.customDomain);
|
||||
} else {
|
||||
fd.append("customDomain", "");
|
||||
}
|
||||
if (data.timezone) fd.append("timezone", data.timezone);
|
||||
if (data.color) fd.append("color", data.color);
|
||||
fd.append("showCharts", String(data.showCharts));
|
||||
@@ -220,355 +200,315 @@ const CreateStatusPage = () => {
|
||||
onSubmit={handleSubmit(onSubmit, onError)}
|
||||
>
|
||||
{!isCreate && <HeaderConfigStatusControls onDelete={handleDeleteClick} />}
|
||||
{isCreate && (
|
||||
<StepProgress
|
||||
steps={totalSteps}
|
||||
current={currentStep}
|
||||
/>
|
||||
)}
|
||||
{showStep(0) && (
|
||||
<ConfigBox
|
||||
title={t("pages.statusPages.form.access.title")}
|
||||
subtitle={t("pages.statusPages.form.access.description")}
|
||||
rightContent={
|
||||
<Stack
|
||||
direction="row"
|
||||
alignItems="center"
|
||||
spacing={theme.spacing(SPACING.MD)}
|
||||
>
|
||||
<Controller
|
||||
name="isPublished"
|
||||
control={control}
|
||||
render={({ field }) => (
|
||||
<SwitchComponent
|
||||
checked={field.value ?? false}
|
||||
onChange={(e) => field.onChange(e.target.checked)}
|
||||
/>
|
||||
)}
|
||||
/>
|
||||
<Typography>
|
||||
{t("pages.statusPages.form.access.option.published.name")}
|
||||
</Typography>
|
||||
</Stack>
|
||||
}
|
||||
/>
|
||||
)}
|
||||
{showStep(0) && (
|
||||
<ConfigBox
|
||||
title={t("pages.statusPages.form.basicInfo.title")}
|
||||
subtitle={t("pages.statusPages.form.basicInfo.description")}
|
||||
rightContent={
|
||||
<Stack spacing={theme.spacing(LAYOUT.MD)}>
|
||||
<Controller
|
||||
name="companyName"
|
||||
control={control}
|
||||
render={({ field, fieldState }) => (
|
||||
<TextField
|
||||
{...field}
|
||||
fieldLabel={t("pages.statusPages.form.basicInfo.option.name.label")}
|
||||
placeholder={t(
|
||||
"pages.statusPages.form.basicInfo.option.name.placeholder"
|
||||
)}
|
||||
error={!!fieldState.error}
|
||||
helperText={fieldState.error?.message}
|
||||
/>
|
||||
)}
|
||||
/>
|
||||
<Controller
|
||||
name="url"
|
||||
control={control}
|
||||
render={({ field, fieldState }) => (
|
||||
<TextField
|
||||
{...field}
|
||||
fieldLabel={t("pages.statusPages.form.basicInfo.option.url.label")}
|
||||
placeholder={t(
|
||||
"pages.statusPages.form.basicInfo.option.url.placeholder"
|
||||
)}
|
||||
error={!!fieldState.error}
|
||||
helperText={fieldState.error?.message}
|
||||
/>
|
||||
)}
|
||||
/>
|
||||
<Controller
|
||||
name="customDomain"
|
||||
control={control}
|
||||
render={({ field, fieldState }) => (
|
||||
<TextField
|
||||
{...field}
|
||||
value={field.value ?? ""}
|
||||
fieldLabel={t(
|
||||
"pages.statusPages.form.basicInfo.option.customDomain.label"
|
||||
)}
|
||||
placeholder={t(
|
||||
"pages.statusPages.form.basicInfo.option.customDomain.placeholder"
|
||||
)}
|
||||
helperText={
|
||||
fieldState.error?.message ||
|
||||
t("pages.statusPages.form.basicInfo.option.customDomain.helper")
|
||||
}
|
||||
error={!!fieldState.error}
|
||||
/>
|
||||
)}
|
||||
/>
|
||||
</Stack>
|
||||
}
|
||||
/>
|
||||
)}
|
||||
{showStep(0) && (
|
||||
<ConfigBox
|
||||
title={t("pages.statusPages.form.monitors.title")}
|
||||
subtitle={t("pages.statusPages.form.monitors.description")}
|
||||
rightContent={
|
||||
<ConfigBox
|
||||
title={t("pages.statusPages.form.access.title")}
|
||||
subtitle={t("pages.statusPages.form.access.description")}
|
||||
rightContent={
|
||||
<Stack
|
||||
direction="row"
|
||||
alignItems="center"
|
||||
spacing={theme.spacing(SPACING.MD)}
|
||||
>
|
||||
<Controller
|
||||
name="monitors"
|
||||
control={control}
|
||||
render={({ field, fieldState }) => {
|
||||
const selectedMonitors = field.value
|
||||
.map((id: string) => monitors.find((m) => m.id === id))
|
||||
.filter((m): m is Monitor => m !== undefined);
|
||||
|
||||
const handleDragEnd = (result: DropResult) => {
|
||||
if (!result.destination) return;
|
||||
const reordered = Array.from(field.value);
|
||||
const [removed] = reordered.splice(result.source.index, 1);
|
||||
reordered.splice(result.destination.index, 0, removed);
|
||||
field.onChange(reordered);
|
||||
};
|
||||
|
||||
return (
|
||||
<Stack spacing={theme.spacing(LAYOUT.MD)}>
|
||||
<Autocomplete
|
||||
multiple
|
||||
options={monitors}
|
||||
getOptionLabel={(option: Monitor) => option.name}
|
||||
value={selectedMonitors}
|
||||
onChange={(_, newValue) => {
|
||||
field.onChange(newValue.map((m: Monitor) => m.id));
|
||||
}}
|
||||
fieldLabel={t(
|
||||
"pages.statusPages.form.monitors.option.monitors.label"
|
||||
)}
|
||||
renderInput={(params) => (
|
||||
<TextField
|
||||
{...params}
|
||||
placeholder={
|
||||
selectedMonitors.length === 0
|
||||
? t(
|
||||
"pages.statusPages.form.monitors.option.monitors.placeholder"
|
||||
)
|
||||
: ""
|
||||
}
|
||||
error={!!fieldState.error}
|
||||
helperText={fieldState.error?.message}
|
||||
/>
|
||||
)}
|
||||
/>
|
||||
{selectedMonitors.length > 0 && (
|
||||
<DragDropContext onDragEnd={handleDragEnd}>
|
||||
<Droppable droppableId="monitors-list">
|
||||
{(provided) => (
|
||||
<Stack
|
||||
{...provided.droppableProps}
|
||||
ref={provided.innerRef}
|
||||
>
|
||||
{selectedMonitors.map((monitor, index) => (
|
||||
<Draggable
|
||||
key={monitor.id}
|
||||
draggableId={monitor.id}
|
||||
index={index}
|
||||
>
|
||||
{(provided) => (
|
||||
<Stack
|
||||
ref={provided.innerRef}
|
||||
{...provided.draggableProps}
|
||||
{...provided.dragHandleProps}
|
||||
direction="row"
|
||||
alignItems="center"
|
||||
spacing={theme.spacing(LAYOUT.XS)}
|
||||
padding={theme.spacing(LAYOUT.XS)}
|
||||
marginTop={theme.spacing(SPACING.LG)}
|
||||
borderRadius={1}
|
||||
sx={{
|
||||
border: `1px solid ${theme.palette.divider}`,
|
||||
cursor: "grab",
|
||||
"&:active": { cursor: "grabbing" },
|
||||
}}
|
||||
>
|
||||
<GripVertical size={20} />
|
||||
<Typography
|
||||
flexGrow={1}
|
||||
>{`${monitor.name} (${getMonitorTypeLabel(monitor.type, t)})`}</Typography>
|
||||
<IconButton
|
||||
size="small"
|
||||
onClick={() => {
|
||||
field.onChange(
|
||||
field.value.filter(
|
||||
(id: string) => id !== monitor.id
|
||||
)
|
||||
);
|
||||
}}
|
||||
aria-label="Remove monitor"
|
||||
>
|
||||
<Trash2 size={16} />
|
||||
</IconButton>
|
||||
</Stack>
|
||||
)}
|
||||
</Draggable>
|
||||
))}
|
||||
{provided.placeholder}
|
||||
</Stack>
|
||||
)}
|
||||
</Droppable>
|
||||
</DragDropContext>
|
||||
)}
|
||||
</Stack>
|
||||
);
|
||||
}}
|
||||
/>
|
||||
}
|
||||
/>
|
||||
)}
|
||||
{showStep(0) && (
|
||||
<ConfigBox
|
||||
title={t("pages.statusPages.form.timezone.title")}
|
||||
subtitle={t("pages.statusPages.form.timezone.description")}
|
||||
rightContent={
|
||||
<Controller
|
||||
name="timezone"
|
||||
name="isPublished"
|
||||
control={control}
|
||||
render={({ field }) => (
|
||||
<Autocomplete
|
||||
options={timezones}
|
||||
getOptionLabel={(option: TimezoneOption) => option.name}
|
||||
value={
|
||||
timezones.find((tz: TimezoneOption) => tz._id === field.value) ?? null
|
||||
}
|
||||
onChange={(_, newValue: TimezoneOption | null) => {
|
||||
field.onChange(newValue?._id ?? "");
|
||||
}}
|
||||
fieldLabel={t("pages.statusPages.form.timezone.option.timezone.label")}
|
||||
renderInput={(params) => (
|
||||
<TextField
|
||||
{...params}
|
||||
placeholder={t(
|
||||
"pages.statusPages.form.timezone.option.timezone.placeholder"
|
||||
)}
|
||||
/>
|
||||
)}
|
||||
<SwitchComponent
|
||||
checked={field.value ?? false}
|
||||
onChange={(e) => field.onChange(e.target.checked)}
|
||||
/>
|
||||
)}
|
||||
/>
|
||||
}
|
||||
/>
|
||||
)}
|
||||
{showStep(1) && (
|
||||
<ConfigBox
|
||||
title={t("pages.statusPages.form.appearance.title")}
|
||||
subtitle={t("pages.statusPages.form.appearance.description")}
|
||||
rightContent={
|
||||
<Stack spacing={theme.spacing(LAYOUT.MD)}>
|
||||
<Stack alignItems={"center"}>
|
||||
<Controller
|
||||
name="logo"
|
||||
control={control}
|
||||
render={({ field }) => (
|
||||
<ImageUpload
|
||||
src={field.value?.data}
|
||||
onChange={(file) => {
|
||||
if (file) {
|
||||
field.onChange({
|
||||
data: file.src,
|
||||
contentType: file.file.type,
|
||||
});
|
||||
} else {
|
||||
field.onChange(null);
|
||||
}
|
||||
}}
|
||||
/>
|
||||
)}
|
||||
/>
|
||||
</Stack>
|
||||
<Controller
|
||||
name="color"
|
||||
control={control}
|
||||
render={({ field }) => (
|
||||
<ColorInput
|
||||
format="hex"
|
||||
value={field.value}
|
||||
onChange={field.onChange}
|
||||
fieldLabel={t("pages.statusPages.form.appearance.option.color.label")}
|
||||
/>
|
||||
)}
|
||||
/>
|
||||
</Stack>
|
||||
}
|
||||
/>
|
||||
)}
|
||||
{showStep(1) && (
|
||||
<ConfigBox
|
||||
title={t("pages.statusPages.form.theme.title")}
|
||||
subtitle={t("pages.statusPages.form.theme.description")}
|
||||
rightContent={
|
||||
<Typography>
|
||||
{t("pages.statusPages.form.access.option.published.name")}
|
||||
</Typography>
|
||||
</Stack>
|
||||
}
|
||||
/>
|
||||
<ConfigBox
|
||||
title={t("pages.statusPages.form.basicInfo.title")}
|
||||
subtitle={t("pages.statusPages.form.basicInfo.description")}
|
||||
rightContent={
|
||||
<Stack spacing={theme.spacing(LAYOUT.MD)}>
|
||||
<Controller
|
||||
name="theme"
|
||||
name="companyName"
|
||||
control={control}
|
||||
render={({ field: themeField }) => (
|
||||
<Controller
|
||||
name="themeMode"
|
||||
control={control}
|
||||
render={({ field: modeField }) => (
|
||||
<ThemePicker
|
||||
theme={themeField.value ?? "refined"}
|
||||
themeMode={modeField.value ?? "auto"}
|
||||
onThemeChange={themeField.onChange}
|
||||
onThemeModeChange={modeField.onChange}
|
||||
/>
|
||||
render={({ field, fieldState }) => (
|
||||
<TextField
|
||||
{...field}
|
||||
fieldLabel={t("pages.statusPages.form.basicInfo.option.name.label")}
|
||||
placeholder={t(
|
||||
"pages.statusPages.form.basicInfo.option.name.placeholder"
|
||||
)}
|
||||
error={!!fieldState.error}
|
||||
helperText={fieldState.error?.message}
|
||||
/>
|
||||
)}
|
||||
/>
|
||||
}
|
||||
/>
|
||||
)}
|
||||
{showStep(1) && (
|
||||
<ConfigBox
|
||||
title={t("pages.statusPages.form.features.title")}
|
||||
subtitle={t("pages.statusPages.form.features.description")}
|
||||
rightContent={
|
||||
<Stack spacing={theme.spacing(LAYOUT.MD)}>
|
||||
<Controller
|
||||
name="showCharts"
|
||||
control={control}
|
||||
render={({ field }) => (
|
||||
<FormControlLabel
|
||||
control={
|
||||
<Checkbox
|
||||
checked={field.value}
|
||||
onChange={field.onChange}
|
||||
<Controller
|
||||
name="url"
|
||||
control={control}
|
||||
render={({ field, fieldState }) => (
|
||||
<TextField
|
||||
{...field}
|
||||
fieldLabel={t("pages.statusPages.form.basicInfo.option.url.label")}
|
||||
placeholder={t(
|
||||
"pages.statusPages.form.basicInfo.option.url.placeholder"
|
||||
)}
|
||||
error={!!fieldState.error}
|
||||
helperText={fieldState.error?.message}
|
||||
/>
|
||||
)}
|
||||
/>
|
||||
</Stack>
|
||||
}
|
||||
/>
|
||||
<ConfigBox
|
||||
title={t("pages.statusPages.form.monitors.title")}
|
||||
subtitle={t("pages.statusPages.form.monitors.description")}
|
||||
rightContent={
|
||||
<Controller
|
||||
name="monitors"
|
||||
control={control}
|
||||
render={({ field, fieldState }) => {
|
||||
const selectedMonitors = field.value
|
||||
.map((id: string) => monitors.find((m) => m.id === id))
|
||||
.filter((m): m is Monitor => m !== undefined);
|
||||
|
||||
const handleDragEnd = (result: DropResult) => {
|
||||
if (!result.destination) return;
|
||||
const reordered = Array.from(field.value);
|
||||
const [removed] = reordered.splice(result.source.index, 1);
|
||||
reordered.splice(result.destination.index, 0, removed);
|
||||
field.onChange(reordered);
|
||||
};
|
||||
|
||||
return (
|
||||
<Stack spacing={theme.spacing(LAYOUT.MD)}>
|
||||
<Autocomplete
|
||||
multiple
|
||||
options={monitors}
|
||||
getOptionLabel={(option: Monitor) => option.name}
|
||||
value={selectedMonitors}
|
||||
onChange={(_, newValue) => {
|
||||
field.onChange(newValue.map((m: Monitor) => m.id));
|
||||
}}
|
||||
fieldLabel={t(
|
||||
"pages.statusPages.form.monitors.option.monitors.label"
|
||||
)}
|
||||
renderInput={(params) => (
|
||||
<TextField
|
||||
{...params}
|
||||
placeholder={
|
||||
selectedMonitors.length === 0
|
||||
? t(
|
||||
"pages.statusPages.form.monitors.option.monitors.placeholder"
|
||||
)
|
||||
: ""
|
||||
}
|
||||
error={!!fieldState.error}
|
||||
helperText={fieldState.error?.message}
|
||||
/>
|
||||
}
|
||||
label={t("pages.statusPages.form.features.option.showCharts.label")}
|
||||
)}
|
||||
/>
|
||||
)}
|
||||
/>
|
||||
<Controller
|
||||
name="showInfrastructure"
|
||||
control={control}
|
||||
render={({ field }) => (
|
||||
<FormControlLabel
|
||||
control={
|
||||
<Checkbox
|
||||
checked={field.value}
|
||||
onChange={field.onChange}
|
||||
/>
|
||||
}
|
||||
label={t(
|
||||
"pages.statusPages.form.features.option.showInfrastructure.label"
|
||||
{selectedMonitors.length > 0 && (
|
||||
<DragDropContext onDragEnd={handleDragEnd}>
|
||||
<Droppable droppableId="monitors-list">
|
||||
{(provided) => (
|
||||
<Stack
|
||||
{...provided.droppableProps}
|
||||
ref={provided.innerRef}
|
||||
>
|
||||
{selectedMonitors.map((monitor, index) => (
|
||||
<Draggable
|
||||
key={monitor.id}
|
||||
draggableId={monitor.id}
|
||||
index={index}
|
||||
>
|
||||
{(provided) => (
|
||||
<Stack
|
||||
ref={provided.innerRef}
|
||||
{...provided.draggableProps}
|
||||
{...provided.dragHandleProps}
|
||||
direction="row"
|
||||
alignItems="center"
|
||||
spacing={theme.spacing(LAYOUT.XS)}
|
||||
padding={theme.spacing(LAYOUT.XS)}
|
||||
marginTop={theme.spacing(SPACING.LG)}
|
||||
borderRadius={1}
|
||||
sx={{
|
||||
border: `1px solid ${theme.palette.divider}`,
|
||||
cursor: "grab",
|
||||
"&:active": { cursor: "grabbing" },
|
||||
}}
|
||||
>
|
||||
<GripVertical size={20} />
|
||||
<Typography
|
||||
flexGrow={1}
|
||||
>{`${monitor.name} (${getMonitorTypeLabel(monitor.type, t)})`}</Typography>
|
||||
<IconButton
|
||||
size="small"
|
||||
onClick={() => {
|
||||
field.onChange(
|
||||
field.value.filter(
|
||||
(id: string) => id !== monitor.id
|
||||
)
|
||||
);
|
||||
}}
|
||||
aria-label="Remove monitor"
|
||||
>
|
||||
<Trash2 size={16} />
|
||||
</IconButton>
|
||||
</Stack>
|
||||
)}
|
||||
</Draggable>
|
||||
))}
|
||||
{provided.placeholder}
|
||||
</Stack>
|
||||
)}
|
||||
</Droppable>
|
||||
</DragDropContext>
|
||||
)}
|
||||
</Stack>
|
||||
);
|
||||
}}
|
||||
/>
|
||||
}
|
||||
/>
|
||||
<ConfigBox
|
||||
title={t("pages.statusPages.form.timezone.title")}
|
||||
subtitle={t("pages.statusPages.form.timezone.description")}
|
||||
rightContent={
|
||||
<Controller
|
||||
name="timezone"
|
||||
control={control}
|
||||
render={({ field }) => (
|
||||
<Autocomplete
|
||||
options={timezones}
|
||||
getOptionLabel={(option: TimezoneOption) => option.name}
|
||||
value={
|
||||
timezones.find((tz: TimezoneOption) => tz._id === field.value) ?? null
|
||||
}
|
||||
onChange={(_, newValue: TimezoneOption | null) => {
|
||||
field.onChange(newValue?._id ?? "");
|
||||
}}
|
||||
fieldLabel={t("pages.statusPages.form.timezone.option.timezone.label")}
|
||||
renderInput={(params) => (
|
||||
<TextField
|
||||
{...params}
|
||||
placeholder={t(
|
||||
"pages.statusPages.form.timezone.option.timezone.placeholder"
|
||||
)}
|
||||
/>
|
||||
)}
|
||||
/>
|
||||
{/* <Controller
|
||||
)}
|
||||
/>
|
||||
}
|
||||
/>
|
||||
<ConfigBox
|
||||
title={t("pages.statusPages.form.appearance.title")}
|
||||
subtitle={t("pages.statusPages.form.appearance.description")}
|
||||
rightContent={
|
||||
<Stack spacing={theme.spacing(LAYOUT.MD)}>
|
||||
<Stack alignItems={"center"}>
|
||||
<Controller
|
||||
name="logo"
|
||||
control={control}
|
||||
render={({ field }) => (
|
||||
<ImageUpload
|
||||
src={field.value?.data}
|
||||
onChange={(file) => {
|
||||
if (file) {
|
||||
field.onChange({
|
||||
data: file.src,
|
||||
contentType: file.file.type,
|
||||
});
|
||||
} else {
|
||||
field.onChange(null);
|
||||
}
|
||||
}}
|
||||
/>
|
||||
)}
|
||||
/>
|
||||
</Stack>
|
||||
<Controller
|
||||
name="color"
|
||||
control={control}
|
||||
render={({ field }) => (
|
||||
<ColorInput
|
||||
format="hex"
|
||||
value={field.value}
|
||||
onChange={field.onChange}
|
||||
fieldLabel={t("pages.statusPages.form.appearance.option.color.label")}
|
||||
/>
|
||||
)}
|
||||
/>
|
||||
</Stack>
|
||||
}
|
||||
/>
|
||||
<ConfigBox
|
||||
title={t("pages.statusPages.form.theme.title")}
|
||||
subtitle={t("pages.statusPages.form.theme.description")}
|
||||
rightContent={
|
||||
<Controller
|
||||
name="theme"
|
||||
control={control}
|
||||
render={({ field: themeField }) => (
|
||||
<Controller
|
||||
name="themeMode"
|
||||
control={control}
|
||||
render={({ field: modeField }) => (
|
||||
<ThemePicker
|
||||
theme={themeField.value ?? "refined"}
|
||||
themeMode={modeField.value ?? "auto"}
|
||||
onThemeChange={themeField.onChange}
|
||||
onThemeModeChange={modeField.onChange}
|
||||
/>
|
||||
)}
|
||||
/>
|
||||
)}
|
||||
/>
|
||||
}
|
||||
/>
|
||||
<ConfigBox
|
||||
title={t("pages.statusPages.form.features.title")}
|
||||
subtitle={t("pages.statusPages.form.features.description")}
|
||||
rightContent={
|
||||
<Stack spacing={theme.spacing(LAYOUT.MD)}>
|
||||
<Controller
|
||||
name="showCharts"
|
||||
control={control}
|
||||
render={({ field }) => (
|
||||
<FormControlLabel
|
||||
control={
|
||||
<Checkbox
|
||||
checked={field.value}
|
||||
onChange={field.onChange}
|
||||
/>
|
||||
}
|
||||
label={t("pages.statusPages.form.features.option.showCharts.label")}
|
||||
/>
|
||||
)}
|
||||
/>
|
||||
<Controller
|
||||
name="showInfrastructure"
|
||||
control={control}
|
||||
render={({ field }) => (
|
||||
<FormControlLabel
|
||||
control={
|
||||
<Checkbox
|
||||
checked={field.value}
|
||||
onChange={field.onChange}
|
||||
/>
|
||||
}
|
||||
label={t(
|
||||
"pages.statusPages.form.features.option.showInfrastructure.label"
|
||||
)}
|
||||
/>
|
||||
)}
|
||||
/>
|
||||
{/* <Controller
|
||||
name="showUptimePercentage"
|
||||
control={control}
|
||||
render={({ field }) => (
|
||||
@@ -602,46 +542,21 @@ const CreateStatusPage = () => {
|
||||
/>
|
||||
)}
|
||||
/> */}
|
||||
</Stack>
|
||||
}
|
||||
/>
|
||||
)}
|
||||
</Stack>
|
||||
}
|
||||
/>
|
||||
<Stack
|
||||
direction="row"
|
||||
justifyContent={isCreate ? "space-between" : "flex-end"}
|
||||
justifyContent="flex-end"
|
||||
>
|
||||
{isCreate && (
|
||||
<Button
|
||||
type="button"
|
||||
variant="outlined"
|
||||
color="secondary"
|
||||
disabled={currentStep === 0}
|
||||
onClick={handleBack}
|
||||
>
|
||||
{t("common.buttons.back")}
|
||||
</Button>
|
||||
)}
|
||||
{isCreate && currentStep < totalSteps - 1 ? (
|
||||
<Button
|
||||
key="wizard-next"
|
||||
type="button"
|
||||
variant="contained"
|
||||
color="primary"
|
||||
onClick={handleNext}
|
||||
>
|
||||
{t("common.buttons.next")}
|
||||
</Button>
|
||||
) : (
|
||||
<Button
|
||||
key="wizard-save"
|
||||
loading={isSubmitting}
|
||||
type="submit"
|
||||
variant="contained"
|
||||
color="primary"
|
||||
>
|
||||
{t("common.buttons.save")}
|
||||
</Button>
|
||||
)}
|
||||
<Button
|
||||
loading={isSubmitting}
|
||||
type="submit"
|
||||
variant="contained"
|
||||
color="primary"
|
||||
>
|
||||
{t("common.buttons.save")}
|
||||
</Button>
|
||||
</Stack>
|
||||
<Dialog
|
||||
open={isDeleteDialogOpen}
|
||||
|
||||
@@ -8,8 +8,7 @@ import { Settings, ExternalLink } from "lucide-react";
|
||||
import { useTheme } from "@mui/material";
|
||||
import { useTranslation } from "react-i18next";
|
||||
import { useNavigate } from "react-router-dom";
|
||||
import { type StatusPage } from "@/Types/StatusPage";
|
||||
import { getStatusPagePublicUrl } from "@/Utils/statusPageUrl";
|
||||
import { PUBLIC_STATUS_PAGE_PREFIX, type StatusPage } from "@/Types/StatusPage";
|
||||
|
||||
interface HeaderStatusPageControlsProps {
|
||||
isAdmin: boolean;
|
||||
@@ -51,7 +50,7 @@ export const HeaderStatusPageControls = ({
|
||||
<Typography
|
||||
onClick={() => {
|
||||
window.open(
|
||||
getStatusPagePublicUrl(statusPage),
|
||||
`${PUBLIC_STATUS_PAGE_PREFIX}/${statusPage.url}`,
|
||||
"_blank",
|
||||
"noopener,noreferrer"
|
||||
);
|
||||
|
||||
@@ -14,11 +14,6 @@ import {
|
||||
type StatusPageResponse,
|
||||
type StatusPageTheme,
|
||||
} from "@/Types/StatusPage";
|
||||
import {
|
||||
buildStatusPageApiPath,
|
||||
getStatusPagePublicUrl,
|
||||
isCustomDomainHost,
|
||||
} from "@/Utils/statusPageUrl";
|
||||
import { HeaderStatusPageControls } from "@/Pages/StatusPage/Status/Components/HeaderStatusPageControls";
|
||||
import { StatusPageThemeProvider } from "@/Pages/StatusPage/Status/themes/StatusPageThemeProvider";
|
||||
import {
|
||||
@@ -72,14 +67,9 @@ const StatusPageView = () => {
|
||||
const isAdmin = useIsAdmin();
|
||||
const location = useLocation();
|
||||
|
||||
const onCustomDomainHost = isCustomDomainHost();
|
||||
const isPublic =
|
||||
onCustomDomainHost || location.pathname.startsWith(PUBLIC_STATUS_PAGE_PREFIX);
|
||||
const isPublic = location.pathname.startsWith(PUBLIC_STATUS_PAGE_PREFIX);
|
||||
|
||||
const apiUrl = buildStatusPageApiPath({
|
||||
url,
|
||||
useCustomDomain: onCustomDomainHost,
|
||||
});
|
||||
const apiUrl = url ? `/status-page/${url}?type=uptime&type=infrastructure` : null;
|
||||
|
||||
const { data, isLoading, error } = useGet<StatusPageResponse>(
|
||||
apiUrl,
|
||||
@@ -144,7 +134,7 @@ const StatusPageView = () => {
|
||||
);
|
||||
}
|
||||
|
||||
const publicUrl = getStatusPagePublicUrl(statusPage);
|
||||
const publicUrl = `${window.location.origin}${PUBLIC_STATUS_PAGE_PREFIX}/${statusPage.url}`;
|
||||
return (
|
||||
<BasePage
|
||||
loading={isLoading}
|
||||
|
||||
@@ -99,9 +99,9 @@ export const boldStyles = (
|
||||
},
|
||||
|
||||
top: {
|
||||
alignItems: { xs: "flex-start", md: "center" },
|
||||
display: "flex",
|
||||
alignItems: "center",
|
||||
justifyContent: "space-between",
|
||||
gap: "12px",
|
||||
mb: "36px",
|
||||
},
|
||||
brand: {
|
||||
@@ -130,7 +130,7 @@ export const boldStyles = (
|
||||
hero: {
|
||||
position: "relative",
|
||||
borderRadius: "22px",
|
||||
padding: { xs: "24px 20px", md: "36px 36px 32px" },
|
||||
padding: "36px 36px 32px",
|
||||
mb: "28px",
|
||||
background: isDark ? heroBgDark : heroBgLight,
|
||||
border: `1px solid ${tokens.border}`,
|
||||
@@ -149,14 +149,13 @@ export const boldStyles = (
|
||||
},
|
||||
heroTitle: {
|
||||
m: 0,
|
||||
fontSize: { xs: 24, md: 34 },
|
||||
fontSize: 34,
|
||||
fontWeight: 800,
|
||||
letterSpacing: "-0.02em",
|
||||
lineHeight: 1.1,
|
||||
color: tokens.text,
|
||||
display: "flex",
|
||||
alignItems: { xs: "flex-start", md: "center" },
|
||||
flexWrap: "wrap",
|
||||
alignItems: "center",
|
||||
gap: "10px",
|
||||
},
|
||||
heroCheck: (tone) => ({
|
||||
@@ -172,15 +171,9 @@ export const boldStyles = (
|
||||
}),
|
||||
heroSub: { mt: "10px", mb: 0, color: tokens.textMuted, fontSize: 14 },
|
||||
|
||||
chartSwitchWrap: {
|
||||
display: "flex",
|
||||
justifyContent: { xs: "center", md: "flex-end" },
|
||||
mb: "16px",
|
||||
},
|
||||
chartSwitchWrap: { display: "flex", justifyContent: "flex-end", mb: "16px" },
|
||||
chartSwitch: {
|
||||
display: "inline-flex",
|
||||
width: { xs: "100%", md: "auto" },
|
||||
maxWidth: "100%",
|
||||
border: `1px solid ${tokens.border}`,
|
||||
borderRadius: "999px",
|
||||
background: tokens.surface,
|
||||
@@ -188,20 +181,16 @@ export const boldStyles = (
|
||||
gap: "2px",
|
||||
},
|
||||
chartSwitchButton: (active) => ({
|
||||
flex: 1,
|
||||
minWidth: 0,
|
||||
whiteSpace: "nowrap",
|
||||
textAlign: "center",
|
||||
border: 0,
|
||||
background: active ? tokens.upSoft : "transparent",
|
||||
fontFamily: "inherit",
|
||||
fontSize: 11,
|
||||
padding: { xs: "8px 6px", md: "8px 18px" },
|
||||
padding: "8px 18px",
|
||||
cursor: "pointer",
|
||||
color: active ? tokens.up : tokens.textMuted,
|
||||
fontWeight: 700,
|
||||
textTransform: "uppercase",
|
||||
letterSpacing: { xs: "0.04em", md: "0.12em" },
|
||||
letterSpacing: "0.12em",
|
||||
transition: "background 0.2s, color 0.2s",
|
||||
borderRadius: "999px",
|
||||
"&:hover": { color: active ? tokens.up : tokens.text },
|
||||
@@ -228,21 +217,13 @@ export const boldStyles = (
|
||||
},
|
||||
cardRow: {
|
||||
display: "grid",
|
||||
alignItems: { xs: "start", md: "center" },
|
||||
gridTemplateColumns: { xs: "minmax(0, 1fr)", md: "1fr auto" },
|
||||
gridTemplateAreas: {
|
||||
xs: `"name" "status" "meta"`,
|
||||
md: `"name name" "meta status"`,
|
||||
},
|
||||
columnGap: { md: "24px" },
|
||||
rowGap: { xs: "10px", md: "6px" },
|
||||
gridTemplateColumns: "1fr auto",
|
||||
alignItems: "center",
|
||||
gap: "24px",
|
||||
p: "22px 28px",
|
||||
},
|
||||
cardLeft: { minWidth: 0, flex: 1, width: { xs: "100%", md: "auto" } },
|
||||
cardLeft: { minWidth: 0 },
|
||||
monitorName: {
|
||||
gridArea: "name",
|
||||
minWidth: 0,
|
||||
width: { xs: "100%", md: "auto" },
|
||||
fontWeight: 700,
|
||||
fontSize: 17,
|
||||
letterSpacing: "-0.01em",
|
||||
@@ -252,9 +233,10 @@ export const boldStyles = (
|
||||
whiteSpace: "nowrap",
|
||||
},
|
||||
monitorMeta: {
|
||||
gridArea: "meta",
|
||||
display: "flex",
|
||||
gap: "10px",
|
||||
alignItems: { xs: "flex-start", md: "center" },
|
||||
alignItems: "center",
|
||||
mt: "6px",
|
||||
flexWrap: "wrap",
|
||||
},
|
||||
pill: {
|
||||
@@ -291,8 +273,6 @@ export const boldStyles = (
|
||||
},
|
||||
|
||||
badge: (tone) => ({
|
||||
gridArea: "status",
|
||||
justifySelf: "start",
|
||||
fontSize: 11,
|
||||
fontWeight: 800,
|
||||
padding: "6px 14px",
|
||||
@@ -316,10 +296,10 @@ export const boldStyles = (
|
||||
}),
|
||||
|
||||
heatmap: {
|
||||
padding: { xs: "0 12px 18px", md: "0 28px 22px" },
|
||||
padding: "0 28px 22px",
|
||||
display: "grid",
|
||||
gridTemplateColumns: `repeat(${MAX_RECENT_CHECKS}, 1fr)`,
|
||||
gap: { xs: "1px", md: "3px" },
|
||||
gap: "3px",
|
||||
height: 48,
|
||||
},
|
||||
heatmapCell: (kind) => ({
|
||||
@@ -332,10 +312,10 @@ export const boldStyles = (
|
||||
}),
|
||||
|
||||
histogram: {
|
||||
padding: { xs: "0 12px", md: "0 28px" },
|
||||
padding: "0 28px",
|
||||
display: "grid",
|
||||
gridTemplateColumns: `repeat(${MAX_RECENT_CHECKS}, 1fr)`,
|
||||
gap: { xs: "1px", md: "3px" },
|
||||
gap: "3px",
|
||||
alignItems: "flex-end",
|
||||
height: 48,
|
||||
},
|
||||
|
||||
@@ -90,9 +90,9 @@ export const editorialStyles = (
|
||||
},
|
||||
|
||||
top: {
|
||||
alignItems: { xs: "flex-start", md: "flex-end" },
|
||||
display: "flex",
|
||||
alignItems: "flex-end",
|
||||
justifyContent: "space-between",
|
||||
gap: "12px",
|
||||
mb: "48px",
|
||||
borderBottom: `2px solid ${tokens.text}`,
|
||||
pb: "18px",
|
||||
@@ -119,7 +119,7 @@ export const editorialStyles = (
|
||||
},
|
||||
|
||||
statusLine: {
|
||||
fontSize: { xs: 18, md: 22 },
|
||||
fontSize: 22,
|
||||
fontWeight: 400,
|
||||
m: 0,
|
||||
mb: "8px",
|
||||
@@ -144,32 +144,26 @@ export const editorialStyles = (
|
||||
letterSpacing: "0.12em",
|
||||
color: tokens.textMuted,
|
||||
m: 0,
|
||||
mb: { xs: "32px", md: "56px" },
|
||||
mb: "56px",
|
||||
},
|
||||
|
||||
chartSwitchWrap: {
|
||||
display: "flex",
|
||||
justifyContent: { xs: "center", md: "flex-end" },
|
||||
justifyContent: "flex-end",
|
||||
mb: "20px",
|
||||
fontFamily: EDITORIAL_SECONDARY_SANS_STACK,
|
||||
},
|
||||
chartSwitch: {
|
||||
display: "inline-flex",
|
||||
width: { xs: "100%", md: "auto" },
|
||||
maxWidth: "100%",
|
||||
border: `1px solid ${tokens.text}`,
|
||||
"& > button + button": { borderLeft: `1px solid ${tokens.text}` },
|
||||
},
|
||||
chartSwitchButton: (active) => ({
|
||||
flex: 1,
|
||||
minWidth: 0,
|
||||
whiteSpace: "nowrap",
|
||||
textAlign: "center",
|
||||
fontFamily: "inherit",
|
||||
fontSize: 10,
|
||||
textTransform: "uppercase",
|
||||
letterSpacing: { xs: "0.05em", md: "0.2em" },
|
||||
padding: { xs: "6px 6px", md: "6px 14px" },
|
||||
letterSpacing: "0.2em",
|
||||
padding: "6px 14px",
|
||||
border: 0,
|
||||
background: active ? tokens.text : "transparent",
|
||||
color: active ? tokens.bg : tokens.text,
|
||||
@@ -194,20 +188,12 @@ export const editorialStyles = (
|
||||
},
|
||||
cardRow: {
|
||||
display: "grid",
|
||||
alignItems: { xs: "start", md: "baseline" },
|
||||
gridTemplateColumns: { xs: "minmax(0, 1fr)", md: "1fr auto" },
|
||||
gridTemplateAreas: {
|
||||
xs: `"name" "status" "meta"`,
|
||||
md: `"name name" "meta status"`,
|
||||
},
|
||||
columnGap: { md: "20px" },
|
||||
rowGap: { xs: "10px", md: "6px" },
|
||||
gridTemplateColumns: "1fr auto",
|
||||
alignItems: "baseline",
|
||||
gap: "20px",
|
||||
},
|
||||
cardLeft: { minWidth: 0, flex: 1, width: { xs: "100%", md: "auto" } },
|
||||
cardLeft: { minWidth: 0 },
|
||||
monitorName: {
|
||||
gridArea: "name",
|
||||
minWidth: 0,
|
||||
width: { xs: "100%", md: "auto" },
|
||||
fontSize: 20,
|
||||
fontWeight: 700,
|
||||
letterSpacing: "-0.015em",
|
||||
@@ -217,13 +203,14 @@ export const editorialStyles = (
|
||||
whiteSpace: "nowrap",
|
||||
},
|
||||
monitorMeta: {
|
||||
gridArea: "meta",
|
||||
fontFamily: EDITORIAL_SECONDARY_SANS_STACK,
|
||||
fontSize: 12,
|
||||
color: tokens.textMuted,
|
||||
mt: "6px",
|
||||
display: "flex",
|
||||
gap: "12px",
|
||||
flexWrap: "wrap",
|
||||
alignItems: { xs: "flex-start", md: "center" },
|
||||
alignItems: "center",
|
||||
},
|
||||
pill: {
|
||||
textTransform: "uppercase",
|
||||
@@ -247,8 +234,6 @@ export const editorialStyles = (
|
||||
},
|
||||
|
||||
badge: (tone) => ({
|
||||
gridArea: "status",
|
||||
justifySelf: "start",
|
||||
fontFamily: EDITORIAL_SECONDARY_SANS_STACK,
|
||||
fontSize: 10,
|
||||
fontWeight: 700,
|
||||
@@ -265,7 +250,7 @@ export const editorialStyles = (
|
||||
mt: "16px",
|
||||
display: "grid",
|
||||
gridTemplateColumns: `repeat(${MAX_RECENT_CHECKS}, 1fr)`,
|
||||
gap: { xs: "1px", md: "2px" },
|
||||
gap: "2px",
|
||||
height: 40,
|
||||
},
|
||||
heatmapCell: (kind) => ({
|
||||
@@ -277,7 +262,7 @@ export const editorialStyles = (
|
||||
mt: "16px",
|
||||
display: "grid",
|
||||
gridTemplateColumns: `repeat(${MAX_RECENT_CHECKS}, 1fr)`,
|
||||
gap: { xs: "1px", md: "2px" },
|
||||
gap: "2px",
|
||||
alignItems: "flex-end",
|
||||
height: 40,
|
||||
},
|
||||
|
||||
@@ -11,24 +11,24 @@ export const ModernHero = ({
|
||||
const { t } = useTranslation();
|
||||
return (
|
||||
<Box sx={styles.hero}>
|
||||
<Box sx={styles.heroRow}>
|
||||
<Box sx={styles.pulse(overall.tone)} />
|
||||
<Box sx={styles.pulse(overall.tone)} />
|
||||
<Box sx={styles.statusCopy}>
|
||||
<Box
|
||||
component="h1"
|
||||
sx={styles.heroTitle}
|
||||
>
|
||||
{overall.message}
|
||||
</Box>
|
||||
<Box sx={styles.heroIcon(overall.tone)}>{overall.icon}</Box>
|
||||
</Box>
|
||||
<Box
|
||||
component="p"
|
||||
sx={styles.heroSub}
|
||||
>
|
||||
{t("pages.statusPages.statusBar.monitoringSummary", {
|
||||
count: monitorCount,
|
||||
})}
|
||||
<Box
|
||||
component="p"
|
||||
sx={styles.heroSub}
|
||||
>
|
||||
{t("pages.statusPages.statusBar.monitoringSummary", {
|
||||
count: monitorCount,
|
||||
})}
|
||||
</Box>
|
||||
</Box>
|
||||
<Box sx={styles.heroIcon(overall.tone)}>{overall.icon}</Box>
|
||||
</Box>
|
||||
);
|
||||
};
|
||||
@@ -17,7 +17,7 @@ export interface ModernStyles {
|
||||
logoImg: SxProps<Theme>;
|
||||
hero: SxProps<Theme>;
|
||||
pulse: (tone: OverallTone) => SxProps<Theme>;
|
||||
heroRow: SxProps<Theme>;
|
||||
statusCopy: SxProps<Theme>;
|
||||
heroTitle: SxProps<Theme>;
|
||||
heroSub: SxProps<Theme>;
|
||||
heroIcon: (tone: OverallTone) => SxProps<Theme>;
|
||||
@@ -117,9 +117,9 @@ export const modernStyles = (
|
||||
},
|
||||
|
||||
top: {
|
||||
alignItems: { xs: "flex-start", md: "center" },
|
||||
display: "flex",
|
||||
alignItems: "center",
|
||||
justifyContent: "space-between",
|
||||
gap: "12px",
|
||||
mb: "32px",
|
||||
},
|
||||
brand: {
|
||||
@@ -148,11 +148,11 @@ export const modernStyles = (
|
||||
hero: {
|
||||
position: "relative",
|
||||
borderRadius: "20px",
|
||||
padding: { xs: "20px", md: "28px 32px" },
|
||||
padding: "28px 32px",
|
||||
mb: "24px",
|
||||
display: "flex",
|
||||
flexDirection: "column",
|
||||
gap: "4px",
|
||||
alignItems: "center",
|
||||
gap: "20px",
|
||||
background: tokens.surface,
|
||||
border: `1px solid ${tokens.border}`,
|
||||
boxShadow: cardShadow,
|
||||
@@ -182,37 +182,25 @@ export const modernStyles = (
|
||||
},
|
||||
};
|
||||
},
|
||||
heroRow: {
|
||||
display: "flex",
|
||||
alignItems: "center",
|
||||
gap: { xs: "14px", md: "20px" },
|
||||
},
|
||||
statusCopy: { flex: 1, minWidth: 0 },
|
||||
heroTitle: {
|
||||
m: 0,
|
||||
flex: 1,
|
||||
minWidth: 0,
|
||||
fontSize: { xs: 18, md: 22 },
|
||||
mb: "4px",
|
||||
fontSize: 22,
|
||||
fontWeight: 700,
|
||||
letterSpacing: "-0.02em",
|
||||
color: tokens.text,
|
||||
},
|
||||
heroSub: { m: 0, color: tokens.textMuted, fontSize: 13 },
|
||||
heroIcon: (tone) => ({
|
||||
display: { xs: "none", md: "flex" },
|
||||
color: toneColor(tone, tokens),
|
||||
display: "flex",
|
||||
alignItems: "center",
|
||||
flexShrink: 0,
|
||||
}),
|
||||
|
||||
chartSwitchWrap: {
|
||||
display: "flex",
|
||||
justifyContent: { xs: "center", md: "flex-end" },
|
||||
mb: "14px",
|
||||
},
|
||||
chartSwitchWrap: { display: "flex", justifyContent: "flex-end", mb: "14px" },
|
||||
chartSwitch: {
|
||||
display: "inline-flex",
|
||||
width: { xs: "100%", md: "auto" },
|
||||
maxWidth: "100%",
|
||||
border: `1px solid ${tokens.border}`,
|
||||
borderRadius: "999px",
|
||||
background: tokens.surface,
|
||||
@@ -220,20 +208,16 @@ export const modernStyles = (
|
||||
gap: "2px",
|
||||
},
|
||||
chartSwitchButton: (active) => ({
|
||||
flex: 1,
|
||||
minWidth: 0,
|
||||
whiteSpace: "nowrap",
|
||||
textAlign: "center",
|
||||
border: 0,
|
||||
background: active ? tokens.upSoft : "transparent",
|
||||
fontFamily: "inherit",
|
||||
fontSize: 11,
|
||||
padding: { xs: "6px 6px", md: "6px 16px" },
|
||||
padding: "6px 16px",
|
||||
cursor: "pointer",
|
||||
color: active ? tokens.up : tokens.textMuted,
|
||||
fontWeight: 600,
|
||||
textTransform: "uppercase",
|
||||
letterSpacing: { xs: "0.04em", md: "0.08em" },
|
||||
letterSpacing: "0.08em",
|
||||
transition: "background 0.2s, color 0.2s",
|
||||
borderRadius: "999px",
|
||||
"&:hover": { color: active ? tokens.up : tokens.text },
|
||||
@@ -272,21 +256,13 @@ export const modernStyles = (
|
||||
},
|
||||
cardRow: {
|
||||
display: "grid",
|
||||
alignItems: { xs: "start", md: "center" },
|
||||
gridTemplateColumns: { xs: "minmax(0, 1fr)", md: "1fr auto" },
|
||||
gridTemplateAreas: {
|
||||
xs: `"name" "status" "meta"`,
|
||||
md: `"name name" "meta status"`,
|
||||
},
|
||||
columnGap: { md: "20px" },
|
||||
rowGap: { xs: "10px", md: "6px" },
|
||||
gridTemplateColumns: "1fr auto",
|
||||
alignItems: "center",
|
||||
gap: "20px",
|
||||
p: "18px 24px",
|
||||
},
|
||||
cardLeft: { minWidth: 0, flex: 1, width: { xs: "100%", md: "auto" } },
|
||||
cardLeft: { minWidth: 0 },
|
||||
monitorName: {
|
||||
gridArea: "name",
|
||||
minWidth: 0,
|
||||
width: { xs: "100%", md: "auto" },
|
||||
fontWeight: 600,
|
||||
fontSize: 15,
|
||||
letterSpacing: "-0.005em",
|
||||
@@ -296,9 +272,10 @@ export const modernStyles = (
|
||||
whiteSpace: "nowrap",
|
||||
},
|
||||
monitorMeta: {
|
||||
gridArea: "meta",
|
||||
display: "flex",
|
||||
gap: "10px",
|
||||
alignItems: { xs: "flex-start", md: "center" },
|
||||
alignItems: "center",
|
||||
mt: "6px",
|
||||
flexWrap: "wrap",
|
||||
},
|
||||
pill: {
|
||||
@@ -322,8 +299,6 @@ export const modernStyles = (
|
||||
},
|
||||
|
||||
badge: (tone) => ({
|
||||
gridArea: "status",
|
||||
justifySelf: "start",
|
||||
fontSize: 11,
|
||||
fontWeight: 700,
|
||||
padding: "5px 12px",
|
||||
@@ -344,10 +319,10 @@ export const modernStyles = (
|
||||
}),
|
||||
|
||||
heatmap: {
|
||||
padding: { xs: "0 12px 16px", md: "0 24px 20px" },
|
||||
padding: "0 24px 20px",
|
||||
display: "grid",
|
||||
gridTemplateColumns: `repeat(${MAX_RECENT_CHECKS}, 1fr)`,
|
||||
gap: { xs: "1px", md: "3px" },
|
||||
gap: "3px",
|
||||
height: 46,
|
||||
},
|
||||
heatmapCell: (kind) => ({
|
||||
@@ -359,10 +334,10 @@ export const modernStyles = (
|
||||
}),
|
||||
|
||||
histogram: {
|
||||
padding: { xs: "0 12px", md: "0 24px" },
|
||||
padding: "0 24px",
|
||||
display: "grid",
|
||||
gridTemplateColumns: `repeat(${MAX_RECENT_CHECKS}, 1fr)`,
|
||||
gap: { xs: "1px", md: "3px" },
|
||||
gap: "3px",
|
||||
alignItems: "flex-end",
|
||||
height: 46,
|
||||
},
|
||||
|
||||
@@ -11,24 +11,24 @@ export const RefinedHero = ({
|
||||
const { t } = useTranslation();
|
||||
return (
|
||||
<Box sx={styles.hero}>
|
||||
<Box sx={styles.heroRow}>
|
||||
<Box sx={styles.statusDot(overall.tone)} />
|
||||
<Box sx={styles.statusDot(overall.tone)} />
|
||||
<Box sx={styles.statusCopy}>
|
||||
<Box
|
||||
component="h1"
|
||||
sx={styles.heroTitle}
|
||||
>
|
||||
{overall.message}
|
||||
</Box>
|
||||
<Box sx={styles.heroIcon(overall.tone)}>{overall.icon}</Box>
|
||||
</Box>
|
||||
<Box
|
||||
component="p"
|
||||
sx={styles.heroSub}
|
||||
>
|
||||
{t("pages.statusPages.statusBar.monitoringSummary", {
|
||||
count: monitorCount,
|
||||
})}
|
||||
<Box
|
||||
component="p"
|
||||
sx={styles.heroSub}
|
||||
>
|
||||
{t("pages.statusPages.statusBar.monitoringSummary", {
|
||||
count: monitorCount,
|
||||
})}
|
||||
</Box>
|
||||
</Box>
|
||||
<Box sx={styles.heroIcon(overall.tone)}>{overall.icon}</Box>
|
||||
</Box>
|
||||
);
|
||||
};
|
||||
@@ -17,7 +17,7 @@ export interface RefinedStyles {
|
||||
company: SxProps<Theme>;
|
||||
hero: SxProps<Theme>;
|
||||
statusDot: (tone: OverallTone) => SxProps<Theme>;
|
||||
heroRow: SxProps<Theme>;
|
||||
statusCopy: SxProps<Theme>;
|
||||
heroTitle: SxProps<Theme>;
|
||||
heroSub: SxProps<Theme>;
|
||||
heroIcon: (tone: OverallTone) => SxProps<Theme>;
|
||||
@@ -102,9 +102,9 @@ export const refinedStyles = (
|
||||
},
|
||||
|
||||
top: {
|
||||
alignItems: { xs: "flex-start", md: "center" },
|
||||
display: "flex",
|
||||
alignItems: "center",
|
||||
justifyContent: "space-between",
|
||||
gap: "12px",
|
||||
mb: "28px",
|
||||
},
|
||||
brand: {
|
||||
@@ -133,10 +133,10 @@ export const refinedStyles = (
|
||||
background: tokens.surface,
|
||||
border: `1px solid ${tokens.border}`,
|
||||
borderRadius: tokens.radius,
|
||||
padding: { xs: "18px 20px", md: "22px 24px" },
|
||||
padding: "22px 24px",
|
||||
display: "flex",
|
||||
flexDirection: "column",
|
||||
gap: "4px",
|
||||
alignItems: "center",
|
||||
gap: "16px",
|
||||
boxShadow: cardShadow,
|
||||
mb: "20px",
|
||||
},
|
||||
@@ -148,15 +148,10 @@ export const refinedStyles = (
|
||||
boxShadow: `0 0 0 4px ${toneSoft(tone, tokens)}`,
|
||||
flexShrink: 0,
|
||||
}),
|
||||
heroRow: {
|
||||
display: "flex",
|
||||
alignItems: "center",
|
||||
gap: { xs: "12px", md: "16px" },
|
||||
},
|
||||
statusCopy: { flex: 1, minWidth: 0 },
|
||||
heroTitle: {
|
||||
m: 0,
|
||||
flex: 1,
|
||||
minWidth: 0,
|
||||
mb: "2px",
|
||||
fontSize: 17,
|
||||
fontWeight: 600,
|
||||
letterSpacing: "-0.01em",
|
||||
@@ -164,21 +159,14 @@ export const refinedStyles = (
|
||||
},
|
||||
heroSub: { m: 0, color: tokens.textMuted, fontSize: 13 },
|
||||
heroIcon: (tone) => ({
|
||||
display: { xs: "none", md: "flex" },
|
||||
color: toneColor(tone, tokens),
|
||||
display: "flex",
|
||||
alignItems: "center",
|
||||
flexShrink: 0,
|
||||
}),
|
||||
|
||||
chartSwitchWrap: {
|
||||
display: "flex",
|
||||
justifyContent: { xs: "center", md: "flex-end" },
|
||||
mb: "12px",
|
||||
},
|
||||
chartSwitchWrap: { display: "flex", justifyContent: "flex-end", mb: "12px" },
|
||||
chartSwitch: {
|
||||
display: "inline-flex",
|
||||
width: { xs: "100%", md: "auto" },
|
||||
maxWidth: "100%",
|
||||
border: `1px solid ${tokens.border}`,
|
||||
borderRadius: "8px",
|
||||
background: tokens.surface,
|
||||
@@ -186,15 +174,11 @@ export const refinedStyles = (
|
||||
gap: "2px",
|
||||
},
|
||||
chartSwitchButton: (active) => ({
|
||||
flex: 1,
|
||||
minWidth: 0,
|
||||
whiteSpace: "nowrap",
|
||||
textAlign: "center",
|
||||
border: 0,
|
||||
background: active ? tokens.upSoft : "transparent",
|
||||
fontFamily: "inherit",
|
||||
fontSize: 11,
|
||||
padding: { xs: "5px 6px", md: "5px 14px" },
|
||||
padding: "5px 14px",
|
||||
cursor: "pointer",
|
||||
color: active ? tokens.up : tokens.textMuted,
|
||||
borderRadius: "5px",
|
||||
@@ -223,21 +207,13 @@ export const refinedStyles = (
|
||||
},
|
||||
cardRow: {
|
||||
display: "grid",
|
||||
alignItems: { xs: "start", md: "center" },
|
||||
gridTemplateColumns: { xs: "minmax(0, 1fr)", md: "1fr auto" },
|
||||
gridTemplateAreas: {
|
||||
xs: `"name" "status" "meta"`,
|
||||
md: `"name name" "meta status"`,
|
||||
},
|
||||
columnGap: { md: "16px" },
|
||||
rowGap: { xs: "10px", md: "4px" },
|
||||
gridTemplateColumns: "1fr auto",
|
||||
alignItems: "center",
|
||||
gap: "16px",
|
||||
p: "16px 20px",
|
||||
},
|
||||
cardLeft: { minWidth: 0, flex: 1, width: { xs: "100%", md: "auto" } },
|
||||
cardLeft: { minWidth: 0 },
|
||||
monitorName: {
|
||||
gridArea: "name",
|
||||
minWidth: 0,
|
||||
width: { xs: "100%", md: "auto" },
|
||||
fontWeight: 600,
|
||||
fontSize: 14,
|
||||
letterSpacing: "-0.005em",
|
||||
@@ -247,9 +223,10 @@ export const refinedStyles = (
|
||||
whiteSpace: "nowrap",
|
||||
},
|
||||
monitorMeta: {
|
||||
gridArea: "meta",
|
||||
display: "flex",
|
||||
gap: "10px",
|
||||
alignItems: { xs: "flex-start", md: "center" },
|
||||
alignItems: "center",
|
||||
mt: "4px",
|
||||
flexWrap: "wrap",
|
||||
},
|
||||
pill: {
|
||||
@@ -274,8 +251,6 @@ export const refinedStyles = (
|
||||
},
|
||||
|
||||
badge: (tone) => ({
|
||||
gridArea: "status",
|
||||
justifySelf: "start",
|
||||
fontSize: 11,
|
||||
fontWeight: 600,
|
||||
padding: "4px 10px",
|
||||
@@ -286,10 +261,10 @@ export const refinedStyles = (
|
||||
}),
|
||||
|
||||
heatmap: {
|
||||
padding: { xs: "0 10px 14px", md: "0 20px 16px" },
|
||||
padding: "0 20px 16px",
|
||||
display: "grid",
|
||||
gridTemplateColumns: `repeat(${MAX_RECENT_CHECKS}, 1fr)`,
|
||||
gap: { xs: "1px", md: "3px" },
|
||||
gap: "3px",
|
||||
height: 42,
|
||||
},
|
||||
heatmapCell: (kind) => ({
|
||||
@@ -301,10 +276,10 @@ export const refinedStyles = (
|
||||
}),
|
||||
|
||||
histogram: {
|
||||
padding: { xs: "0 10px", md: "0 20px" },
|
||||
padding: "0 20px",
|
||||
display: "grid",
|
||||
gridTemplateColumns: `repeat(${MAX_RECENT_CHECKS}, 1fr)`,
|
||||
gap: { xs: "1px", md: "3px" },
|
||||
gap: "3px",
|
||||
alignItems: "flex-end",
|
||||
height: 42,
|
||||
},
|
||||
|
||||
@@ -27,7 +27,6 @@ import {
|
||||
statusBadgeKey,
|
||||
} from "@/Pages/StatusPage/Status/themes/shared/overallStatus";
|
||||
import { useStatusPageTheme } from "@/Pages/StatusPage/Status/themes/StatusPageThemeProvider";
|
||||
import { formatPercentage } from "@/Utils/FormatUtils";
|
||||
|
||||
type StatusPageMonitor = Monitor & { checks?: Monitor["recentChecks"] };
|
||||
|
||||
@@ -102,9 +101,8 @@ export const BaseStatusPage = ({ statusPage, monitors, config }: Props) => {
|
||||
|
||||
return (
|
||||
<Box sx={styles.page}>
|
||||
<Stack
|
||||
<Box
|
||||
component="header"
|
||||
direction={{ xs: "column", md: "row" }}
|
||||
sx={styles.top}
|
||||
>
|
||||
<HeaderSlot
|
||||
@@ -114,7 +112,7 @@ export const BaseStatusPage = ({ statusPage, monitors, config }: Props) => {
|
||||
monitorCount={monitors.length}
|
||||
styles={styles}
|
||||
/>
|
||||
</Stack>
|
||||
</Box>
|
||||
|
||||
<HeroSlot
|
||||
statusPage={statusPage}
|
||||
@@ -163,7 +161,6 @@ export const BaseStatusPage = ({ statusPage, monitors, config }: Props) => {
|
||||
const showInfra = isHardware && statusPage.showInfrastructure !== false;
|
||||
const showChart = !isHardware && statusPage.showCharts !== false;
|
||||
const badgeTone = monitorBadgeTone(monitor.status);
|
||||
const uptimePercentage = formatPercentage(monitor.uptimePercentage ?? 0);
|
||||
|
||||
return (
|
||||
<Box
|
||||
@@ -172,39 +169,32 @@ export const BaseStatusPage = ({ statusPage, monitors, config }: Props) => {
|
||||
sx={styles.card}
|
||||
>
|
||||
<Box sx={styles.cardRow}>
|
||||
<Box sx={styles.monitorName}>{monitor.name}</Box>
|
||||
<Box sx={styles.cardLeft}>
|
||||
<Box sx={styles.monitorName}>{monitor.name}</Box>
|
||||
<Box sx={styles.monitorMeta}>
|
||||
<Box
|
||||
component="span"
|
||||
sx={isHardware ? styles.pillHardware : styles.pill}
|
||||
>
|
||||
{getMonitorTypeLabel(monitor.type, t)}
|
||||
</Box>
|
||||
{monitor.url && (
|
||||
<Box
|
||||
component="span"
|
||||
sx={styles.monitorUrl}
|
||||
title={monitor.url}
|
||||
>
|
||||
{monitor.url}
|
||||
</Box>
|
||||
)}
|
||||
</Box>
|
||||
</Box>
|
||||
<Box
|
||||
component="span"
|
||||
sx={styles.badge(badgeTone)}
|
||||
>
|
||||
{t(statusBadgeKey[monitor.status])}
|
||||
</Box>
|
||||
<Stack
|
||||
direction={{ xs: "column", md: "row" }}
|
||||
sx={styles.monitorMeta}
|
||||
>
|
||||
<Box
|
||||
component="span"
|
||||
sx={isHardware ? styles.pillHardware : styles.pill}
|
||||
>
|
||||
{getMonitorTypeLabel(monitor.type, t)}
|
||||
</Box>
|
||||
<Box
|
||||
component="span"
|
||||
sx={{ ...styles.pill }}
|
||||
>
|
||||
{uptimePercentage}
|
||||
</Box>
|
||||
{monitor.url && (
|
||||
<Box
|
||||
component="span"
|
||||
sx={styles.monitorUrl}
|
||||
title={monitor.url}
|
||||
>
|
||||
{monitor.url}
|
||||
</Box>
|
||||
)}
|
||||
</Stack>
|
||||
</Box>
|
||||
|
||||
{showInfra && (
|
||||
|
||||
@@ -11,9 +11,7 @@ import { useTranslation } from "react-i18next";
|
||||
import { useTheme } from "@mui/material/styles";
|
||||
import { useNavigate } from "react-router-dom";
|
||||
|
||||
import { getStatusPagePublicPath, getStatusPagePublicUrl } from "@/Utils/statusPageUrl";
|
||||
|
||||
import { type StatusPage } from "@/Types/StatusPage";
|
||||
import { PUBLIC_STATUS_PAGE_PREFIX, type StatusPage } from "@/Types/StatusPage";
|
||||
|
||||
interface StatusPagesTableProps {
|
||||
data: StatusPage[];
|
||||
@@ -55,7 +53,8 @@ export const StatusPagesTable = ({
|
||||
const handleUrlClick = (e: React.MouseEvent, row: StatusPage) => {
|
||||
if (row.isPublished) {
|
||||
e.stopPropagation();
|
||||
window.open(getStatusPagePublicUrl(row), "_blank", "noopener,noreferrer");
|
||||
const url = `${PUBLIC_STATUS_PAGE_PREFIX}/${row.url}`;
|
||||
window.open(url, "_blank", "noopener,noreferrer");
|
||||
}
|
||||
};
|
||||
|
||||
@@ -71,9 +70,7 @@ export const StatusPagesTable = ({
|
||||
content: t("pages.statusPages.table.headers.url"),
|
||||
render: (row) => {
|
||||
const content = row.isPublished
|
||||
? row.customDomain
|
||||
? getStatusPagePublicPath(row)
|
||||
: `/${row.url}`
|
||||
? `/${row.url}`
|
||||
: t("pages.statusPages.table.unpublished");
|
||||
return (
|
||||
<Stack
|
||||
|
||||
@@ -1,109 +0,0 @@
|
||||
import { ActionsMenu, type ActionMenuItem } from "@/Components/actions-menu";
|
||||
import Typography from "@mui/material/Typography";
|
||||
import Box from "@mui/material/Box";
|
||||
import type { Header } from "@/Components/design-elements/Table";
|
||||
import { Table, ColoredLabel } from "@/Components/design-elements";
|
||||
import { Pagination } from "@/Components/design-elements/Table";
|
||||
import { useClientPagination } from "@/Hooks/useClientPagination";
|
||||
|
||||
import type { Tag } from "@/Types/Tag";
|
||||
import { useNavigate } from "react-router";
|
||||
import { useTranslation } from "react-i18next";
|
||||
import { useTheme } from "@mui/material";
|
||||
|
||||
interface TagsTableProps {
|
||||
tags: Tag[];
|
||||
setSelectedTag: Function;
|
||||
}
|
||||
|
||||
export const TagsTable = ({ tags, setSelectedTag }: TagsTableProps) => {
|
||||
const navigate = useNavigate();
|
||||
const { t } = useTranslation();
|
||||
const theme = useTheme();
|
||||
const { pagedRows, paginationProps } = useClientPagination(tags);
|
||||
|
||||
const getActions = (tag: Tag): ActionMenuItem[] => {
|
||||
return [
|
||||
{
|
||||
id: 1,
|
||||
label: t("pages.common.monitors.actions.configure"),
|
||||
action: () => {
|
||||
navigate(`/tags/configure/${tag.id}`);
|
||||
},
|
||||
closeMenu: true,
|
||||
},
|
||||
|
||||
{
|
||||
id: 2,
|
||||
label: (
|
||||
<Typography color={theme.palette.error.main}>
|
||||
{t("pages.common.monitors.actions.delete")}
|
||||
</Typography>
|
||||
),
|
||||
action: async () => {
|
||||
setSelectedTag(tag);
|
||||
},
|
||||
closeMenu: true,
|
||||
},
|
||||
];
|
||||
};
|
||||
|
||||
const getHeaders = () => {
|
||||
const headers: Header<Tag>[] = [
|
||||
{
|
||||
id: "name",
|
||||
content: t("common.table.headers.name"),
|
||||
render: (row) => {
|
||||
return <Typography>{row?.name}</Typography>;
|
||||
},
|
||||
},
|
||||
|
||||
{
|
||||
id: "color",
|
||||
content: t("pages.tags.table.headers.color"),
|
||||
render: (row) => {
|
||||
return <Typography textTransform={"capitalize"}>{row?.color}</Typography>;
|
||||
},
|
||||
},
|
||||
{
|
||||
id: "chip",
|
||||
content: t("pages.tags.table.headers.appearance"),
|
||||
render: (row) => {
|
||||
return (
|
||||
<Box
|
||||
display="flex"
|
||||
justifyContent="center"
|
||||
>
|
||||
<ColoredLabel
|
||||
text={row.name}
|
||||
color={row.color}
|
||||
/>
|
||||
</Box>
|
||||
);
|
||||
},
|
||||
},
|
||||
|
||||
{
|
||||
id: "actions",
|
||||
content: t("common.table.headers.actions"),
|
||||
render: (row) => {
|
||||
return <ActionsMenu items={getActions(row)} />;
|
||||
},
|
||||
},
|
||||
];
|
||||
return headers;
|
||||
};
|
||||
|
||||
return (
|
||||
<>
|
||||
<Table
|
||||
headers={getHeaders()}
|
||||
data={pagedRows}
|
||||
onRowClick={(row) => {
|
||||
navigate(`/tags/configure/${row.id}`);
|
||||
}}
|
||||
/>
|
||||
{tags.length > 0 && <Pagination {...paginationProps} />}
|
||||
</>
|
||||
);
|
||||
};
|
||||
@@ -1,118 +0,0 @@
|
||||
import { BasePage, ConfigBox } from "@/Components/design-elements";
|
||||
import { TextField, Button, ColorInput } from "@/Components/inputs";
|
||||
import Stack from "@mui/material/Stack";
|
||||
import { useTheme } from "@mui/material/styles";
|
||||
|
||||
import { useEffect } from "react";
|
||||
import { useParams } from "react-router-dom";
|
||||
import { useNavigate } from "react-router-dom";
|
||||
import { Controller, useForm } from "react-hook-form";
|
||||
import { zodResolver } from "@hookform/resolvers/zod";
|
||||
import { mutate } from "swr";
|
||||
import { useGet, usePost, usePatch } from "@/Hooks/UseApi";
|
||||
import type { TagFormData } from "@/Validation/tag";
|
||||
import type { Tag } from "@/Types/Tag";
|
||||
import { useTranslation } from "react-i18next";
|
||||
import { useTagsForm } from "@/Hooks/useTagsForm";
|
||||
|
||||
const TagsCreatePage = () => {
|
||||
const { t } = useTranslation();
|
||||
const theme = useTheme();
|
||||
const navigate = useNavigate();
|
||||
const { tagId } = useParams<{ tagId: string }>();
|
||||
const isEditMode = Boolean(tagId);
|
||||
|
||||
const { data: existingTag } = useGet<Tag>(isEditMode ? `/tags/${tagId}` : null);
|
||||
|
||||
const { post, loading: isSubmitting } = usePost<TagFormData, Tag>();
|
||||
const { patch, loading: isPatching } = usePatch<TagFormData, Tag>();
|
||||
|
||||
const { schema, defaults } = useTagsForm({ data: existingTag });
|
||||
|
||||
const form = useForm<TagFormData>({
|
||||
resolver: zodResolver(schema),
|
||||
defaultValues: defaults,
|
||||
});
|
||||
|
||||
const { control, reset, handleSubmit } = form;
|
||||
|
||||
useEffect(() => {
|
||||
reset(defaults);
|
||||
}, [defaults, reset]);
|
||||
|
||||
const onSubmit = async (data: TagFormData) => {
|
||||
const result = isEditMode
|
||||
? await patch(`/tags/${tagId}`, data)
|
||||
: await post("/tags", data);
|
||||
if (result?.success) {
|
||||
await mutate((key) => typeof key === "string" && key.startsWith("/tags"));
|
||||
navigate("/tags");
|
||||
}
|
||||
};
|
||||
|
||||
return (
|
||||
<BasePage
|
||||
component="form"
|
||||
onSubmit={handleSubmit(onSubmit)}
|
||||
>
|
||||
<ConfigBox
|
||||
title={t("pages.tags.form.name.title")}
|
||||
subtitle={t("pages.tags.form.name.description")}
|
||||
rightContent={
|
||||
<Controller
|
||||
name="name"
|
||||
control={control}
|
||||
defaultValue={defaults.name}
|
||||
render={({ field, fieldState }) => (
|
||||
<TextField
|
||||
{...field}
|
||||
type="text"
|
||||
fieldLabel={t("pages.tags.form.name.optionName")}
|
||||
placeholder={t("pages.tags.form.name.placeholder")}
|
||||
fullWidth
|
||||
error={!!fieldState.error}
|
||||
helperText={fieldState.error?.message ?? ""}
|
||||
/>
|
||||
)}
|
||||
/>
|
||||
}
|
||||
/>
|
||||
<ConfigBox
|
||||
title={t("pages.tags.form.color.title")}
|
||||
subtitle={t("pages.tags.form.color.description")}
|
||||
rightContent={
|
||||
<Controller
|
||||
name="color"
|
||||
control={control}
|
||||
defaultValue={defaults.color}
|
||||
render={({ field }) => (
|
||||
<ColorInput
|
||||
format="hex"
|
||||
value={field.value}
|
||||
onChange={field.onChange}
|
||||
fieldLabel={t("pages.tags.form.color.optionName")}
|
||||
/>
|
||||
)}
|
||||
/>
|
||||
}
|
||||
/>
|
||||
|
||||
<Stack
|
||||
direction="row"
|
||||
justifyContent="flex-end"
|
||||
spacing={theme.spacing(2)}
|
||||
>
|
||||
<Button
|
||||
loading={isSubmitting || isPatching}
|
||||
type="submit"
|
||||
variant="contained"
|
||||
color="primary"
|
||||
>
|
||||
{t("common.buttons.save")}
|
||||
</Button>
|
||||
</Stack>
|
||||
</BasePage>
|
||||
);
|
||||
};
|
||||
|
||||
export default TagsCreatePage;
|
||||
@@ -1,72 +0,0 @@
|
||||
import { BasePageWithStates } from "@/Components/design-elements";
|
||||
import { TagsTable } from "@/Pages/Tags/components/TagsTable";
|
||||
import { Dialog } from "@/Components/inputs";
|
||||
import { HeaderCreate } from "@/Components/common";
|
||||
|
||||
import { useState } from "react";
|
||||
import { useGet, useDelete } from "@/Hooks/UseApi";
|
||||
import { useTranslation } from "react-i18next";
|
||||
import type { Tag } from "@/Types/Tag";
|
||||
import { useIsAdmin } from "@/Hooks/useIsAdmin";
|
||||
|
||||
const TagsPage = () => {
|
||||
const { t } = useTranslation();
|
||||
const isAdmin = useIsAdmin();
|
||||
|
||||
const [selectedTag, setSelectedTag] = useState<Tag | null>(null);
|
||||
const isDialogOpen = Boolean(selectedTag);
|
||||
|
||||
const {
|
||||
data: tags,
|
||||
isLoading,
|
||||
isValidating,
|
||||
error,
|
||||
refetch,
|
||||
} = useGet<Tag[]>("/tags/team", {}, { keepPreviousData: true });
|
||||
|
||||
const { deleteFn, loading: isDeleting } = useDelete();
|
||||
|
||||
const handleConfirm = async () => {
|
||||
if (!selectedTag) return;
|
||||
await deleteFn(`/tags/${selectedTag.id}`);
|
||||
setSelectedTag(null);
|
||||
refetch();
|
||||
};
|
||||
|
||||
const handleCancel = () => {
|
||||
setSelectedTag(null);
|
||||
};
|
||||
|
||||
return (
|
||||
<BasePageWithStates
|
||||
headerKey="tags"
|
||||
page={t("pages.tags.fallback.title")}
|
||||
description={t("pages.tags.fallback.description")}
|
||||
loading={isLoading || isValidating}
|
||||
error={!!error}
|
||||
totalCount={tags?.length ?? 0}
|
||||
actionButtonText={t("pages.tags.fallback.actionButton")}
|
||||
actionLink="/tags/create"
|
||||
>
|
||||
<HeaderCreate
|
||||
path="/tags/create"
|
||||
isLoading={isLoading || isValidating}
|
||||
isAdmin={isAdmin}
|
||||
/>
|
||||
<TagsTable
|
||||
tags={tags ?? []}
|
||||
setSelectedTag={setSelectedTag}
|
||||
/>
|
||||
<Dialog
|
||||
open={isDialogOpen}
|
||||
title={t("common.dialogs.delete.title")}
|
||||
content={t("common.dialogs.delete.description")}
|
||||
onConfirm={handleConfirm}
|
||||
onCancel={handleCancel}
|
||||
loading={isDeleting}
|
||||
/>
|
||||
</BasePageWithStates>
|
||||
);
|
||||
};
|
||||
|
||||
export default TagsPage;
|
||||
@@ -6,7 +6,6 @@ import {
|
||||
type Header,
|
||||
Pagination,
|
||||
StatusLabel,
|
||||
ColoredLabel,
|
||||
} from "@/Components/design-elements";
|
||||
import { HeatmapResponseTime, HistogramResponseTime } from "@/Components/common";
|
||||
import { ActionsMenu } from "@/Components/actions-menu";
|
||||
@@ -14,23 +13,19 @@ import { ArrowDown, ArrowUp } from "lucide-react";
|
||||
|
||||
import { useTranslation } from "react-i18next";
|
||||
import { useTheme } from "@mui/material/styles";
|
||||
import useMediaQuery from "@mui/material/useMediaQuery";
|
||||
import { useNavigate } from "react-router-dom";
|
||||
import { usePost } from "@/Hooks/UseApi";
|
||||
import { useSelector } from "react-redux";
|
||||
import useMediaQuery from "@mui/material/useMediaQuery";
|
||||
|
||||
import type { Monitor } from "@/Types/Monitor";
|
||||
import type { ActionMenuItem } from "@/Components/actions-menu";
|
||||
import type { RootState } from "@/Types/state";
|
||||
import { Checkbox } from "@/Components/inputs";
|
||||
import type { Tag } from "@/Types/Tag";
|
||||
import { SPACING } from "@/Utils/Theme/constants";
|
||||
import { getUptimePercentageColor } from "@/Utils/MonitorUtils";
|
||||
import { formatPercentage } from "@/Utils/FormatUtils";
|
||||
import { SPACING, LAYOUT } from "@/Utils/Theme/constants";
|
||||
|
||||
interface MonitorTableProps {
|
||||
monitors: Monitor[];
|
||||
tags: Tag[];
|
||||
refetch: () => void;
|
||||
setSelectedMonitor: (monitor: Monitor | null) => void;
|
||||
sortField: string;
|
||||
@@ -48,7 +43,6 @@ interface MonitorTableProps {
|
||||
|
||||
export const MonitorTable = ({
|
||||
monitors,
|
||||
tags,
|
||||
refetch,
|
||||
setSelectedMonitor,
|
||||
sortField,
|
||||
@@ -65,10 +59,10 @@ export const MonitorTable = ({
|
||||
}: MonitorTableProps) => {
|
||||
const { t } = useTranslation();
|
||||
const theme = useTheme();
|
||||
const isSmall = useMediaQuery(theme.breakpoints.down("md"));
|
||||
const navigate = useNavigate();
|
||||
const chartType = useSelector((state: RootState) => state.ui?.chartType ?? "histogram");
|
||||
const { post } = usePost<Record<string, never>, Monitor>();
|
||||
const isSmall = useMediaQuery(theme.breakpoints.down("md"));
|
||||
|
||||
const selectedSet = new Set(selectedRows);
|
||||
const isAllSelected =
|
||||
@@ -214,7 +208,7 @@ export const MonitorTable = ({
|
||||
mobileLabel: t("common.table.headers.name"),
|
||||
content: (
|
||||
<Stack
|
||||
gap={theme.spacing(4)}
|
||||
gap={theme.spacing(LAYOUT.XS)}
|
||||
direction={"row"}
|
||||
alignItems={"center"}
|
||||
onClick={(e) => handleSort(e, "name")}
|
||||
@@ -234,14 +228,14 @@ export const MonitorTable = ({
|
||||
mobileLabel: t("common.table.headers.status"),
|
||||
content: (
|
||||
<Stack
|
||||
gap={theme.spacing(4)}
|
||||
gap={theme.spacing(LAYOUT.XS)}
|
||||
direction={"row"}
|
||||
justifyContent={"center"}
|
||||
alignItems={"center"}
|
||||
onClick={(e) => handleSort(e, "status")}
|
||||
sx={{ cursor: "pointer" }}
|
||||
>
|
||||
<Box width={theme.spacing(8)} />
|
||||
<Box width={theme.spacing(LAYOUT.MD)} />
|
||||
{t("common.table.headers.status")}
|
||||
{renderSortIcon(sortField === "status")}
|
||||
</Stack>
|
||||
@@ -261,64 +255,19 @@ export const MonitorTable = ({
|
||||
}
|
||||
},
|
||||
},
|
||||
{
|
||||
id: "uptime",
|
||||
content: t("pages.uptime.table.headers.uptime"),
|
||||
render: (row) => {
|
||||
const uptimePercentage = row.uptimePercentage ?? 0;
|
||||
const formattedPercentage = formatPercentage(uptimePercentage);
|
||||
const paletteKey = getUptimePercentageColor(uptimePercentage);
|
||||
const color = theme.palette[paletteKey].main;
|
||||
return (
|
||||
<Stack alignItems={"center"}>
|
||||
<ColoredLabel
|
||||
text={formattedPercentage}
|
||||
color={color}
|
||||
/>
|
||||
</Stack>
|
||||
);
|
||||
},
|
||||
},
|
||||
{
|
||||
id: "tags",
|
||||
content: t("common.table.headers.tags"),
|
||||
render: (row) => {
|
||||
if (row.tags.length === 0) return "-";
|
||||
|
||||
return (
|
||||
<Stack
|
||||
justifyContent={"center"}
|
||||
direction={isSmall ? "column" : "row"}
|
||||
gap={theme.spacing(SPACING.LG)}
|
||||
>
|
||||
{row.tags.map((tag) => {
|
||||
const fullTag = tags.find((t) => t.id === tag);
|
||||
if (!fullTag) return null;
|
||||
return (
|
||||
<ColoredLabel
|
||||
key={fullTag.id}
|
||||
text={fullTag.name}
|
||||
color={fullTag.color}
|
||||
/>
|
||||
);
|
||||
})}
|
||||
</Stack>
|
||||
);
|
||||
},
|
||||
},
|
||||
{
|
||||
id: "type",
|
||||
mobileLabel: t("common.table.headers.type"),
|
||||
content: (
|
||||
<Stack
|
||||
gap={theme.spacing(4)}
|
||||
gap={theme.spacing(LAYOUT.XS)}
|
||||
direction={"row"}
|
||||
justifyContent={"center"}
|
||||
alignItems={"center"}
|
||||
onClick={(e) => handleSort(e, "type")}
|
||||
sx={{ cursor: "pointer" }}
|
||||
>
|
||||
<Box width={theme.spacing(8)} />
|
||||
<Box width={theme.spacing(LAYOUT.MD)} />
|
||||
{t("common.table.headers.type")}
|
||||
{renderSortIcon(sortField === "type")}
|
||||
</Stack>
|
||||
@@ -342,6 +291,30 @@ export const MonitorTable = ({
|
||||
|
||||
return (
|
||||
<Box>
|
||||
{isSmall && (
|
||||
<Box
|
||||
px={SPACING.SM}
|
||||
pb={SPACING.LG}
|
||||
>
|
||||
<Stack
|
||||
direction="row"
|
||||
alignItems="center"
|
||||
spacing={SPACING.SM}
|
||||
>
|
||||
<Checkbox
|
||||
checked={isAllSelected}
|
||||
indeterminate={isSomeSelected}
|
||||
onChange={(e) => handleSelectAll(e.target.checked)}
|
||||
/>
|
||||
<Typography
|
||||
variant="body2"
|
||||
color="text.secondary"
|
||||
>
|
||||
{t("pages.common.monitors.bulkEdit.selectAll", "Select All")}
|
||||
</Typography>
|
||||
</Stack>
|
||||
</Box>
|
||||
)}
|
||||
<Table
|
||||
headers={headers}
|
||||
data={monitors}
|
||||
|
||||
@@ -3,19 +3,18 @@ import {
|
||||
HeaderMonitorsSummary,
|
||||
BulkActionsBar,
|
||||
} from "@/Components/monitors";
|
||||
import { MonitorBasePageWithStates, ColoredLabel } from "@/Components/design-elements";
|
||||
import { MonitorBasePageWithStates } from "@/Components/design-elements";
|
||||
import { TextField, Dialog, Button } from "@/Components/inputs";
|
||||
import Stack from "@mui/material/Stack";
|
||||
import { MonitorTable } from "@/Pages/Uptime/Monitors/Components/UptimeMonitorsTable";
|
||||
import { HeaderCreate } from "@/Components/common";
|
||||
import { Play, Pause } from "lucide-react";
|
||||
import Typography from "@mui/material/Typography";
|
||||
import { BulkEditNotificationsModal } from "@/Components/monitors";
|
||||
|
||||
import { useTranslation } from "react-i18next";
|
||||
import useMediaQuery from "@mui/material/useMediaQuery";
|
||||
import { useGet, useDelete } from "@/Hooks/UseApi";
|
||||
import type { Monitor, MonitorType, MonitorsWithChecksResponse } from "@/Types/Monitor";
|
||||
import type { Tag } from "@/Types/Tag";
|
||||
import { useState, useMemo, useCallback } from "react";
|
||||
import { useSelector, useDispatch } from "react-redux";
|
||||
import { setRowsPerPage } from "@/Features/UI/uiSlice.js";
|
||||
@@ -24,7 +23,7 @@ import type { RootState } from "@/Types/state";
|
||||
import { useTheme } from "@mui/material";
|
||||
import useDebounce from "@/Hooks/useDebounce";
|
||||
import { useBulkMonitorActions } from "@/Hooks/useBulkMonitorActions";
|
||||
import { SPACING } from "@/Utils/Theme/constants";
|
||||
import { LAYOUT } from "@/Utils/Theme/constants";
|
||||
|
||||
const UptimeMonitorsPage = () => {
|
||||
const { t } = useTranslation();
|
||||
@@ -41,13 +40,12 @@ const UptimeMonitorsPage = () => {
|
||||
const [selectedTypes, setSelectedTypes] = useState<MonitorType[]>([]);
|
||||
const [selectedStatus, setSelectedStatus] = useState<string>("");
|
||||
const [selectedState, setSelectedState] = useState<string>("");
|
||||
const [selectedTags, setSelectedTags] = useState<string[]>([]);
|
||||
const [page, setPage] = useState<number>(0);
|
||||
const [search, setSearch] = useState<string>("");
|
||||
const [sortField, setSortField] = useState<string>("");
|
||||
const [sortOrder, setSortOrder] = useState<"asc" | "desc">("asc");
|
||||
const [selectedMonitor, setSelectedMonitor] = useState<Monitor | null>(null);
|
||||
|
||||
const [isBulkEditModalOpen, setIsBulkEditModalOpen] = useState(false);
|
||||
const isDialogOpen = Boolean(selectedMonitor);
|
||||
|
||||
const debouncedSearch = useDebounce<string>(search, 300);
|
||||
@@ -87,7 +85,6 @@ const UptimeMonitorsPage = () => {
|
||||
const monitorsWithChecksUrl = useMemo(() => {
|
||||
const params = new URLSearchParams();
|
||||
effectiveTypes.forEach((type) => params.append("type", type));
|
||||
selectedTags.forEach((tagId) => params.append("tags", tagId));
|
||||
params.append("limit", "25");
|
||||
if (page !== undefined) params.append("page", String(page));
|
||||
if (rowsPerPage) params.append("rowsPerPage", String(rowsPerPage));
|
||||
@@ -95,7 +92,7 @@ const UptimeMonitorsPage = () => {
|
||||
if (field) params.append("field", field);
|
||||
if (sortOrder) params.append("order", sortOrder);
|
||||
return `/monitors/team/with-checks?${params.toString()}`;
|
||||
}, [effectiveTypes, selectedTags, page, rowsPerPage, filter, field, sortOrder]);
|
||||
}, [effectiveTypes, page, rowsPerPage, filter, field, sortOrder]);
|
||||
|
||||
const {
|
||||
data: monitorsWithChecksData,
|
||||
@@ -108,8 +105,6 @@ const UptimeMonitorsPage = () => {
|
||||
{ refreshInterval: 5000, keepPreviousData: true }
|
||||
);
|
||||
|
||||
const { data: tags } = useGet<Tag[]>("/tags/team");
|
||||
|
||||
const {
|
||||
monitors: monitorsWithChecks,
|
||||
summary,
|
||||
@@ -133,7 +128,6 @@ const UptimeMonitorsPage = () => {
|
||||
setSelectedTypes([]);
|
||||
setSelectedStatus("");
|
||||
setSelectedState("");
|
||||
setSelectedTags([]);
|
||||
setSearch("");
|
||||
}, []);
|
||||
|
||||
@@ -144,6 +138,14 @@ const UptimeMonitorsPage = () => {
|
||||
refetch();
|
||||
};
|
||||
|
||||
const handleBulkEditComplete = (success: boolean) => {
|
||||
setIsBulkEditModalOpen(false);
|
||||
if (success) {
|
||||
setSelectedRows([]);
|
||||
refetch();
|
||||
}
|
||||
};
|
||||
|
||||
const handleCancel = () => {
|
||||
setSelectedMonitor(null);
|
||||
};
|
||||
@@ -152,11 +154,7 @@ const UptimeMonitorsPage = () => {
|
||||
|
||||
// Check if any filters are active
|
||||
const hasActiveFilters = Boolean(
|
||||
selectedTypes.length > 0 ||
|
||||
selectedStatus ||
|
||||
selectedState ||
|
||||
selectedTags.length > 0 ||
|
||||
search
|
||||
selectedTypes.length > 0 || selectedStatus || selectedState || search
|
||||
);
|
||||
|
||||
// Show empty state only when there are truly no monitors (not just filtered out)
|
||||
@@ -186,7 +184,7 @@ const UptimeMonitorsPage = () => {
|
||||
<Stack
|
||||
direction={isSmall ? "column" : "row"}
|
||||
justifyContent={isSmall ? "flex-start" : "space-between"}
|
||||
gap={theme.spacing(4)}
|
||||
gap={theme.spacing(LAYOUT.XS)}
|
||||
>
|
||||
<ControlsFilter
|
||||
selectedTypes={selectedTypes}
|
||||
@@ -195,9 +193,6 @@ const UptimeMonitorsPage = () => {
|
||||
setSelectedStatus={setSelectedStatus}
|
||||
selectedState={selectedState}
|
||||
setSelectedState={setSelectedState}
|
||||
tagOptions={tags ?? []}
|
||||
selectedTags={selectedTags}
|
||||
setSelectedTags={setSelectedTags}
|
||||
onClearFilters={handleClearFilters}
|
||||
/>
|
||||
<TextField
|
||||
@@ -209,30 +204,6 @@ const UptimeMonitorsPage = () => {
|
||||
/>
|
||||
</Stack>
|
||||
|
||||
{selectedTags.length > 0 && (
|
||||
<Stack
|
||||
direction={isSmall ? "column" : "row"}
|
||||
alignItems={isSmall ? "flex-start" : "center"}
|
||||
flexWrap="wrap"
|
||||
gap={theme.spacing(SPACING.XL)}
|
||||
>
|
||||
<Typography color={theme.palette.text.secondary}>
|
||||
{t("pages.uptime.filters.activeTags")}
|
||||
</Typography>
|
||||
{selectedTags.map((tagId) => {
|
||||
const tag = tags?.find((t) => t.id === tagId);
|
||||
if (!tag) return null;
|
||||
return (
|
||||
<ColoredLabel
|
||||
key={tag.id}
|
||||
text={tag.name}
|
||||
color={tag.color}
|
||||
/>
|
||||
);
|
||||
})}
|
||||
</Stack>
|
||||
)}
|
||||
|
||||
{!isLoading && (
|
||||
<BulkActionsBar
|
||||
selectedCount={selectedRows.length}
|
||||
@@ -252,17 +223,27 @@ const UptimeMonitorsPage = () => {
|
||||
>
|
||||
{t("common.buttons.pause")}
|
||||
</Button>
|
||||
<Button
|
||||
size="small"
|
||||
onClick={() => setIsBulkEditModalOpen(true)}
|
||||
>
|
||||
{t("pages.common.monitors.bulkEdit.editButton", {
|
||||
defaultValue: "Edit Notifications",
|
||||
})}
|
||||
</Button>
|
||||
</BulkActionsBar>
|
||||
)}
|
||||
|
||||
<MonitorTable
|
||||
page={page}
|
||||
monitors={monitorsWithChecks || []}
|
||||
tags={tags || []}
|
||||
refetch={refetch}
|
||||
setSelectedMonitor={setSelectedMonitor}
|
||||
count={count || 0}
|
||||
page={page}
|
||||
setPage={setPage}
|
||||
setPage={(newPage) => {
|
||||
setPage(newPage);
|
||||
setSelectedRows([]);
|
||||
}}
|
||||
rowsPerPage={rowsPerPage}
|
||||
sortField={sortField}
|
||||
setSortField={setSortField}
|
||||
@@ -276,6 +257,7 @@ const UptimeMonitorsPage = () => {
|
||||
})
|
||||
);
|
||||
setPage(0);
|
||||
setSelectedRows([]);
|
||||
}}
|
||||
selectedRows={selectedRows}
|
||||
onSelectionChange={setSelectedRows}
|
||||
@@ -288,6 +270,12 @@ const UptimeMonitorsPage = () => {
|
||||
onCancel={handleCancel}
|
||||
loading={isDeleting}
|
||||
/>
|
||||
<BulkEditNotificationsModal
|
||||
open={isBulkEditModalOpen}
|
||||
onClose={() => setIsBulkEditModalOpen(false)}
|
||||
selectedMonitors={selectedRows}
|
||||
onComplete={handleBulkEditComplete}
|
||||
/>
|
||||
</MonitorBasePageWithStates>
|
||||
);
|
||||
};
|
||||
|
||||
@@ -31,14 +31,9 @@ import CreateStatus from "@/Pages/StatusPage/Create/";
|
||||
import StatusPages from "@/Pages/StatusPage/StatusPages";
|
||||
import Status from "@/Pages/StatusPage/Status";
|
||||
|
||||
// Notifications
|
||||
import Notifications from "@/Pages/Notifications";
|
||||
import CreateNotifications from "@/Pages/Notifications/create";
|
||||
|
||||
// Tags
|
||||
import Tags from "@/Pages/Tags";
|
||||
import CreateTags from "@/Pages/Tags/create";
|
||||
|
||||
// Settings
|
||||
import Account from "@/Pages/Account";
|
||||
import EditUser from "@/Pages/Account/EditUser";
|
||||
@@ -54,24 +49,8 @@ import Logs from "@/Pages/Logs";
|
||||
import { ProtectedRoute, RoleProtectedRoute } from "@/Components/routing/RouteProtected";
|
||||
|
||||
import CreateMonitor from "@/Pages/CreateMonitor";
|
||||
import { isCustomDomainHost } from "@/Utils/statusPageUrl";
|
||||
|
||||
const Routes = () => {
|
||||
if (isCustomDomainHost()) {
|
||||
return (
|
||||
<LibRoutes>
|
||||
<Route
|
||||
path="/"
|
||||
element={<Status />}
|
||||
/>
|
||||
<Route
|
||||
path="*"
|
||||
element={<Status />}
|
||||
/>
|
||||
</LibRoutes>
|
||||
);
|
||||
}
|
||||
|
||||
return (
|
||||
<LibRoutes>
|
||||
<Route
|
||||
@@ -180,19 +159,6 @@ const Routes = () => {
|
||||
path="notifications/configure/:notificationId"
|
||||
element={<CreateNotifications />}
|
||||
/>
|
||||
<Route
|
||||
path="tags"
|
||||
element={<Tags />}
|
||||
/>
|
||||
<Route
|
||||
path="tags/create"
|
||||
element={<CreateTags />}
|
||||
/>
|
||||
|
||||
<Route
|
||||
path="tags/configure/:tagId"
|
||||
element={<CreateTags />}
|
||||
/>
|
||||
|
||||
<Route
|
||||
path="maintenance"
|
||||
|
||||
@@ -1,17 +1,28 @@
|
||||
export interface Diagnostics {
|
||||
osStats: OsStats;
|
||||
memoryUsage: MemoryUsage;
|
||||
cpuUsage: CpuUsage;
|
||||
v8HeapStats: V8HeapStats;
|
||||
eventLoopDelayMs: number;
|
||||
uptimeMs: number;
|
||||
mongoStats: MongoStats;
|
||||
}
|
||||
|
||||
export interface OsStats {
|
||||
freeMemoryBytes: number;
|
||||
totalMemoryBytes: number;
|
||||
}
|
||||
|
||||
export interface MemoryUsage {
|
||||
rss: number;
|
||||
heapTotal: number;
|
||||
heapUsed: number;
|
||||
external: number;
|
||||
arrayBuffers: number;
|
||||
}
|
||||
|
||||
export interface CpuUsage {
|
||||
userUsageMs: number;
|
||||
systemUsageMs: number;
|
||||
usagePercentage: number;
|
||||
}
|
||||
|
||||
@@ -20,26 +31,3 @@ export interface V8HeapStats {
|
||||
usedHeapSizeBytes: number;
|
||||
heapSizeLimitBytes: number;
|
||||
}
|
||||
|
||||
export interface MongoStats {
|
||||
readyState: number;
|
||||
readsPerSecond: number;
|
||||
insertsPerSecond: number;
|
||||
updatesPerSecond: number;
|
||||
deletesPerSecond: number;
|
||||
writesPerSecond: number;
|
||||
host: string;
|
||||
port: number;
|
||||
dbName: string;
|
||||
totalSize: number;
|
||||
collections: CollectionStats[];
|
||||
}
|
||||
|
||||
export interface CollectionStats {
|
||||
name: string;
|
||||
documentCount: number;
|
||||
storageSize: number;
|
||||
totalIndexSize: number;
|
||||
totalSize: number;
|
||||
bucketCount?: number;
|
||||
}
|
||||
@@ -70,7 +70,6 @@ export interface Monitor {
|
||||
interval: number;
|
||||
uptimePercentage?: number;
|
||||
notifications: string[];
|
||||
tags: string[];
|
||||
secret?: string;
|
||||
cpuAlertThreshold: number;
|
||||
cpuAlertCounter: number;
|
||||
|
||||
@@ -9,7 +9,6 @@ export const NotificationChannels = [
|
||||
"telegram",
|
||||
"pushover",
|
||||
"twilio",
|
||||
"ntfy",
|
||||
] as const;
|
||||
export type NotificationChannel = (typeof NotificationChannels)[number];
|
||||
|
||||
@@ -26,7 +25,6 @@ export interface Notification {
|
||||
accessToken?: string;
|
||||
accountSid?: string;
|
||||
twilioPhoneNumber?: string;
|
||||
topic?: string;
|
||||
createdAt: string;
|
||||
updatedAt: string;
|
||||
}
|
||||
@@ -1,14 +1,5 @@
|
||||
import type { MonitorType } from "./Monitor";
|
||||
|
||||
export const QueueModes = ["primary", "worker"] as const;
|
||||
export type QueueMode = (typeof QueueModes)[number];
|
||||
|
||||
export type QueueWorker = {
|
||||
workerId: string; // hostname:pid:uuid
|
||||
mode: QueueMode;
|
||||
lastSeenAt: number; // epoch ms of the last heartbeat
|
||||
};
|
||||
|
||||
export interface QueueJobFailure {
|
||||
monitorId: string | number;
|
||||
monitorUrl: string | null;
|
||||
@@ -18,26 +9,23 @@ export interface QueueJobFailure {
|
||||
failReason: string | null;
|
||||
}
|
||||
|
||||
export type QueueMetrics = {
|
||||
export interface QueueMetrics {
|
||||
jobs: number;
|
||||
activeJobs: number;
|
||||
failingJobs: number;
|
||||
jobsWithFailures: QueueJobFailure[];
|
||||
totalRuns: number;
|
||||
totalFailures: number;
|
||||
workers: QueueWorker[];
|
||||
};
|
||||
}
|
||||
|
||||
export type QueueJobSummary = {
|
||||
export interface QueueJobSummary {
|
||||
monitorId: string | number;
|
||||
monitorUrl: string | null;
|
||||
monitorType: string | null;
|
||||
monitorType: MonitorType | null;
|
||||
monitorInterval: number | null;
|
||||
monitorGeoInterval: number | null;
|
||||
monitorActive: boolean | null;
|
||||
active: boolean;
|
||||
lockedBy: string | null;
|
||||
lockedUntil: number | null;
|
||||
lockedAt: number | null;
|
||||
runCount: number;
|
||||
failCount: number;
|
||||
@@ -47,10 +35,9 @@ export type QueueJobSummary = {
|
||||
lastRunTook: number | null;
|
||||
lastFailedAt: number | null;
|
||||
repeat: number | null;
|
||||
};
|
||||
}
|
||||
|
||||
export interface QueueData {
|
||||
jobs: QueueJobSummary[];
|
||||
count: number;
|
||||
metrics: QueueMetrics;
|
||||
}
|
||||
@@ -47,7 +47,6 @@ export interface StatusPage {
|
||||
type: MonitorDisplayType[];
|
||||
companyName: string;
|
||||
url: string;
|
||||
customDomain?: string | null;
|
||||
timezone?: string;
|
||||
color: string;
|
||||
monitors: string[];
|
||||
|
||||
@@ -1,8 +0,0 @@
|
||||
export interface Tag {
|
||||
id: string;
|
||||
teamId: string;
|
||||
name: string;
|
||||
color: string;
|
||||
createdAt: string;
|
||||
updatedAt: string;
|
||||
}
|
||||
@@ -63,16 +63,6 @@ export const getResponseTimeColor = (responseTime: number): PaletteKey => {
|
||||
}
|
||||
};
|
||||
|
||||
export const getUptimePercentageColor = (uptimePercentage: number): PaletteKey => {
|
||||
if (uptimePercentage >= 0.75) {
|
||||
return "success";
|
||||
} else if (uptimePercentage >= 0.5) {
|
||||
return "warning";
|
||||
} else {
|
||||
return "error";
|
||||
}
|
||||
};
|
||||
|
||||
export const getInfraGaugeColor = (val: number, theme: any) => {
|
||||
if (val < 50) {
|
||||
return theme.palette.success.main;
|
||||
|
||||
@@ -1,89 +0,0 @@
|
||||
import { PUBLIC_STATUS_PAGE_PREFIX, type StatusPage } from "@/Types/StatusPage";
|
||||
|
||||
const CLIENT_HOST = import.meta.env.VITE_APP_CLIENT_HOST as string | undefined;
|
||||
|
||||
const getClientOriginProtocol = (): string => {
|
||||
const source =
|
||||
CLIENT_HOST || (typeof window !== "undefined" ? window.location.origin : undefined);
|
||||
if (!source) {
|
||||
return "https:";
|
||||
}
|
||||
|
||||
try {
|
||||
return new URL(source).protocol;
|
||||
} catch {
|
||||
return "https:";
|
||||
}
|
||||
};
|
||||
|
||||
const buildCustomDomainOrigin = (customDomain: string): string =>
|
||||
`${getClientOriginProtocol()}//${customDomain}`;
|
||||
|
||||
export const getAppHostname = (): string | null => {
|
||||
const source =
|
||||
CLIENT_HOST || (typeof window !== "undefined" ? window.location.origin : undefined);
|
||||
if (!source) {
|
||||
return null;
|
||||
}
|
||||
|
||||
try {
|
||||
return new URL(source).hostname.toLowerCase();
|
||||
} catch {
|
||||
return null;
|
||||
}
|
||||
};
|
||||
|
||||
export const isCustomDomainHost = (): boolean => {
|
||||
if (typeof window === "undefined") {
|
||||
return false;
|
||||
}
|
||||
|
||||
const appHostname = getAppHostname();
|
||||
if (!appHostname) {
|
||||
return false;
|
||||
}
|
||||
|
||||
return window.location.hostname.toLowerCase() !== appHostname;
|
||||
};
|
||||
|
||||
export const getStatusPagePublicPath = (
|
||||
statusPage: Pick<StatusPage, "url" | "customDomain">
|
||||
): string => {
|
||||
if (statusPage.customDomain) {
|
||||
return buildCustomDomainOrigin(statusPage.customDomain);
|
||||
}
|
||||
|
||||
return `${PUBLIC_STATUS_PAGE_PREFIX}/${statusPage.url}`;
|
||||
};
|
||||
|
||||
export const getStatusPagePublicUrl = (
|
||||
statusPage: Pick<StatusPage, "url" | "customDomain">
|
||||
): string => {
|
||||
if (statusPage.customDomain) {
|
||||
return buildCustomDomainOrigin(statusPage.customDomain);
|
||||
}
|
||||
|
||||
if (typeof window !== "undefined") {
|
||||
return `${window.location.origin}${PUBLIC_STATUS_PAGE_PREFIX}/${statusPage.url}`;
|
||||
}
|
||||
|
||||
return `${PUBLIC_STATUS_PAGE_PREFIX}/${statusPage.url}`;
|
||||
};
|
||||
|
||||
export const buildStatusPageApiPath = (options: {
|
||||
url?: string;
|
||||
useCustomDomain?: boolean;
|
||||
}): string | null => {
|
||||
const query = "type=uptime&type=infrastructure";
|
||||
|
||||
if (options.useCustomDomain && typeof window !== "undefined") {
|
||||
const domain = encodeURIComponent(window.location.hostname);
|
||||
return `/status-page/resolve?domain=${domain}&${query}`;
|
||||
}
|
||||
|
||||
if (options.url) {
|
||||
return `/status-page/${options.url}?${query}`;
|
||||
}
|
||||
|
||||
return null;
|
||||
};
|
||||
@@ -1,12 +1,6 @@
|
||||
import { z } from "zod";
|
||||
import type { FieldPath } from "react-hook-form";
|
||||
import { GeoContinents } from "@/Types/GeoCheck";
|
||||
import { DnsRecordTypes, PageSpeedStrategies, type MonitorType } from "@/Types/Monitor";
|
||||
|
||||
// Wizard step a field is validated on. Attached inline to each field below so
|
||||
// the grouping lives next to the field definition; unannotated fields default
|
||||
// to step 0. Read via `stepFieldsFor`.
|
||||
export const monitorStepRegistry = z.registry<{ step: number }>();
|
||||
import { DnsRecordTypes, PageSpeedStrategies } from "@/Types/Monitor";
|
||||
|
||||
// URL schema with custom error message
|
||||
const urlSchema = z.url({ message: "Please enter a valid URL" });
|
||||
@@ -18,60 +12,39 @@ const baseSchema = z.object({
|
||||
.min(1, "Monitor name is required")
|
||||
.max(50, "Monitor name must be at most 50 characters"),
|
||||
description: z.string().optional(),
|
||||
interval: z
|
||||
.number()
|
||||
.min(15000, "Interval must be at least 15 seconds")
|
||||
.register(monitorStepRegistry, { step: 1 }),
|
||||
notifications: z.array(z.string()).register(monitorStepRegistry, { step: 1 }),
|
||||
tags: z.array(z.string()).register(monitorStepRegistry, { step: 1 }),
|
||||
interval: z.number().min(15000, "Interval must be at least 15 seconds"),
|
||||
notifications: z.array(z.string()),
|
||||
statusWindowSize: z
|
||||
.number({ message: "Status window size is required" })
|
||||
.min(1, "Status window size must be at least 1")
|
||||
.max(25, "Status window size must be at most 25")
|
||||
.register(monitorStepRegistry, { step: 1 }),
|
||||
.max(25, "Status window size must be at most 25"),
|
||||
statusWindowThreshold: z
|
||||
.number({ message: "Threshold percentage is required" })
|
||||
.min(1, "Incident percentage must be at least 1")
|
||||
.max(100, "Incident percentage must be at most 100")
|
||||
.register(monitorStepRegistry, { step: 1 }),
|
||||
});
|
||||
|
||||
// Geo-distributed check fields. Only http and ping support geo checks
|
||||
// (GeoCheckSupportedTypes), so these live on those schemas rather than the base
|
||||
// — that way each type's step count is exactly what its own fields declare.
|
||||
const geoCheckFields = {
|
||||
geoCheckEnabled: z.boolean().optional().register(monitorStepRegistry, { step: 2 }),
|
||||
geoCheckLocations: z
|
||||
.array(z.enum(GeoContinents))
|
||||
.optional()
|
||||
.register(monitorStepRegistry, { step: 2 }),
|
||||
.max(100, "Incident percentage must be at most 100"),
|
||||
geoCheckEnabled: z.boolean().optional(),
|
||||
geoCheckLocations: z.array(z.enum(GeoContinents)).optional(),
|
||||
geoCheckInterval: z
|
||||
.number()
|
||||
.min(300000, "Interval must be at least 5 minutes")
|
||||
.optional()
|
||||
.register(monitorStepRegistry, { step: 2 }),
|
||||
};
|
||||
.optional(),
|
||||
});
|
||||
|
||||
// HTTP monitor schema
|
||||
const httpSchema = baseSchema.extend({
|
||||
type: z.literal("http"),
|
||||
url: urlSchema,
|
||||
ignoreTlsErrors: z.boolean().register(monitorStepRegistry, { step: 2 }),
|
||||
useAdvancedMatching: z.boolean().register(monitorStepRegistry, { step: 2 }),
|
||||
matchMethod: z
|
||||
.enum(["equal", "include", "regex", ""])
|
||||
.optional()
|
||||
.register(monitorStepRegistry, { step: 2 }),
|
||||
expectedValue: z.string().optional().register(monitorStepRegistry, { step: 2 }),
|
||||
jsonPath: z.string().optional().register(monitorStepRegistry, { step: 2 }),
|
||||
...geoCheckFields,
|
||||
ignoreTlsErrors: z.boolean(),
|
||||
useAdvancedMatching: z.boolean(),
|
||||
matchMethod: z.enum(["equal", "include", "regex", ""]).optional(),
|
||||
expectedValue: z.string().optional(),
|
||||
jsonPath: z.string().optional(),
|
||||
});
|
||||
|
||||
// Ping monitor schema
|
||||
const pingSchema = baseSchema.extend({
|
||||
type: z.literal("ping"),
|
||||
url: z.string().min(1, "Host is required"),
|
||||
...geoCheckFields,
|
||||
});
|
||||
|
||||
// Port monitor schema
|
||||
@@ -110,7 +83,7 @@ const grpcSchema = baseSchema.extend({
|
||||
.min(1, "Port must be at least 1")
|
||||
.max(65535, "Port must be at most 65535"),
|
||||
grpcServiceName: z.string().optional(),
|
||||
ignoreTlsErrors: z.boolean().register(monitorStepRegistry, { step: 2 }),
|
||||
ignoreTlsErrors: z.boolean(),
|
||||
});
|
||||
|
||||
// PageSpeed monitor schema
|
||||
@@ -128,23 +101,19 @@ const hardwareSchema = baseSchema.extend({
|
||||
cpuAlertThreshold: z
|
||||
.number()
|
||||
.min(0, "CPU threshold must be at least 0")
|
||||
.max(100, "CPU threshold must be at most 100")
|
||||
.register(monitorStepRegistry, { step: 1 }),
|
||||
.max(100, "CPU threshold must be at most 100"),
|
||||
memoryAlertThreshold: z
|
||||
.number()
|
||||
.min(0, "Memory threshold must be at least 0")
|
||||
.max(100, "Memory threshold must be at most 100")
|
||||
.register(monitorStepRegistry, { step: 1 }),
|
||||
.max(100, "Memory threshold must be at most 100"),
|
||||
diskAlertThreshold: z
|
||||
.number()
|
||||
.min(0, "Disk threshold must be at least 0")
|
||||
.max(100, "Disk threshold must be at most 100")
|
||||
.register(monitorStepRegistry, { step: 1 }),
|
||||
.max(100, "Disk threshold must be at most 100"),
|
||||
tempAlertThreshold: z
|
||||
.number()
|
||||
.min(0, "Temperature threshold must be at least 0")
|
||||
.max(150, "Temperature threshold must be at most 150")
|
||||
.register(monitorStepRegistry, { step: 1 }),
|
||||
.max(150, "Temperature threshold must be at most 150"),
|
||||
selectedDisks: z.array(z.string()),
|
||||
});
|
||||
|
||||
@@ -152,7 +121,7 @@ const hardwareSchema = baseSchema.extend({
|
||||
const websocketSchema = baseSchema.extend({
|
||||
type: z.literal("websocket"),
|
||||
url: z.string().min(1, "WebSocket URL is required"),
|
||||
ignoreTlsErrors: z.boolean().register(monitorStepRegistry, { step: 2 }),
|
||||
ignoreTlsErrors: z.boolean(),
|
||||
});
|
||||
|
||||
// Hostname (FQDN) — labels of 1-63 alphanumerics/hyphens separated by dots,
|
||||
@@ -194,34 +163,6 @@ export const monitorSchema = z.discriminatedUnion("type", [
|
||||
|
||||
export type MonitorFormData = z.infer<typeof monitorSchema>;
|
||||
|
||||
const optionForType = (type: MonitorType) =>
|
||||
monitorSchema.options.find((o) => o.shape.type.value === type);
|
||||
|
||||
// The step each field of a type is validated on, from the per-field
|
||||
// `monitorStepRegistry` metadata (unannotated fields default to step 0).
|
||||
const fieldStepsFor = (
|
||||
type: MonitorType
|
||||
): [name: FieldPath<MonitorFormData>, step: number][] =>
|
||||
Object.entries(optionForType(type)?.shape ?? {}).map(([name, field]) => [
|
||||
name as FieldPath<MonitorFormData>,
|
||||
monitorStepRegistry.get(field)?.step ?? 0,
|
||||
]);
|
||||
|
||||
// The selected type's fields that belong to a given wizard step. Derived from
|
||||
// the schema so it can't drift from the field definitions.
|
||||
export const stepFieldsFor = (
|
||||
type: MonitorType,
|
||||
step: number
|
||||
): FieldPath<MonitorFormData>[] =>
|
||||
fieldStepsFor(type)
|
||||
.filter(([, fieldStep]) => fieldStep === step)
|
||||
.map(([name]) => name);
|
||||
|
||||
// Number of wizard steps a type has, derived from the highest step its fields
|
||||
// declare. A type with no step-2 fields is a 2-step form, and so on.
|
||||
export const monitorStepCount = (type: MonitorType): number =>
|
||||
Math.max(0, ...fieldStepsFor(type).map(([, step]) => step)) + 1;
|
||||
|
||||
// Type-specific schemas exported for individual use
|
||||
export {
|
||||
httpSchema,
|
||||
|
||||
@@ -70,12 +70,6 @@ const twilioSchema = baseSchema.extend({
|
||||
twilioPhoneNumber: z.string().min(1, "Twilio phone number is required"),
|
||||
});
|
||||
|
||||
const ntfySchema = baseSchema.extend({
|
||||
type: z.literal("ntfy"),
|
||||
address: z.string().min(1, "Server URL is required").url("Please enter a valid URL"),
|
||||
topic: z.string().min(1, "Topic is required"),
|
||||
});
|
||||
|
||||
export const notificationSchema = z.discriminatedUnion("type", [
|
||||
emailSchema,
|
||||
slackSchema,
|
||||
@@ -87,7 +81,6 @@ export const notificationSchema = z.discriminatedUnion("type", [
|
||||
telegramSchema,
|
||||
pushoverSchema,
|
||||
twilioSchema,
|
||||
ntfySchema,
|
||||
]);
|
||||
|
||||
export type NotificationFormData = z.infer<typeof notificationSchema>;
|
||||
@@ -1,31 +1,6 @@
|
||||
import { z } from "zod";
|
||||
import type { FieldPath } from "react-hook-form";
|
||||
import { STATUS_PAGE_THEMES, STATUS_PAGE_THEME_MODES } from "@/Types/StatusPage";
|
||||
|
||||
// Wizard step a field is validated on. Attached inline to each field below so
|
||||
// the grouping lives next to the field definition; unannotated fields default
|
||||
// to step 0. Read via `statusPageStepFieldsFor`. Mirrors the monitor schema's
|
||||
// `monitorStepRegistry` so the create-status-page wizard can't drift from the
|
||||
// field definitions.
|
||||
export const statusPageStepRegistry = z.registry<{ step: number }>();
|
||||
|
||||
const statusPageHostnameRegex =
|
||||
/^(?=.{1,253}$)([a-zA-Z0-9_](?:[a-zA-Z0-9-]{0,61}[a-zA-Z0-9])?\.)+[a-zA-Z]{2,63}$/;
|
||||
|
||||
const normalizeCustomDomainInput = (raw: string | null): string | null => {
|
||||
if (raw === null) {
|
||||
return null;
|
||||
}
|
||||
|
||||
const trimmed = raw.trim().toLowerCase();
|
||||
if (!trimmed) {
|
||||
return null;
|
||||
}
|
||||
|
||||
const withoutScheme = trimmed.replace(/^https?:\/\//, "");
|
||||
return withoutScheme.split("/")[0]?.split(":")[0] ?? null;
|
||||
};
|
||||
|
||||
export const statusPageSchema = z.object({
|
||||
companyName: z
|
||||
.string()
|
||||
@@ -39,61 +14,27 @@ export const statusPageSchema = z.object({
|
||||
/^[a-z0-9-]+$/,
|
||||
"URL can only contain lowercase letters, numbers, and hyphens"
|
||||
),
|
||||
customDomain: z
|
||||
.union([z.string(), z.null()])
|
||||
.transform(normalizeCustomDomainInput)
|
||||
.refine((domain) => domain === null || statusPageHostnameRegex.test(domain), {
|
||||
message: "Enter a valid domain name (e.g. status.example.com)",
|
||||
}),
|
||||
timezone: z.string().optional(),
|
||||
type: z
|
||||
.array(z.enum(["uptime", "infrastructure"]))
|
||||
.min(1, "At least one type is required"),
|
||||
color: z.string().min(1, "Color is required").register(statusPageStepRegistry, {
|
||||
step: 1,
|
||||
}),
|
||||
color: z.string().min(1, "Color is required"),
|
||||
monitors: z.array(z.string()).min(1, "At least one monitor is required"),
|
||||
isPublished: z.boolean(),
|
||||
showCharts: z.boolean().register(statusPageStepRegistry, { step: 1 }),
|
||||
showUptimePercentage: z.boolean().register(statusPageStepRegistry, { step: 1 }),
|
||||
showAdminLoginLink: z.boolean().register(statusPageStepRegistry, { step: 1 }),
|
||||
showInfrastructure: z.boolean().register(statusPageStepRegistry, { step: 1 }),
|
||||
customCSS: z.string().optional().register(statusPageStepRegistry, { step: 1 }),
|
||||
theme: z
|
||||
.enum(STATUS_PAGE_THEMES)
|
||||
.optional()
|
||||
.register(statusPageStepRegistry, { step: 1 }),
|
||||
themeMode: z
|
||||
.enum(STATUS_PAGE_THEME_MODES)
|
||||
.optional()
|
||||
.register(statusPageStepRegistry, { step: 1 }),
|
||||
showCharts: z.boolean(),
|
||||
showUptimePercentage: z.boolean(),
|
||||
showAdminLoginLink: z.boolean(),
|
||||
showInfrastructure: z.boolean(),
|
||||
customCSS: z.string().optional(),
|
||||
theme: z.enum(STATUS_PAGE_THEMES).optional(),
|
||||
themeMode: z.enum(STATUS_PAGE_THEME_MODES).optional(),
|
||||
logo: z
|
||||
.object({
|
||||
data: z.string(),
|
||||
contentType: z.string(),
|
||||
})
|
||||
.nullable()
|
||||
.optional()
|
||||
.register(statusPageStepRegistry, { step: 1 }),
|
||||
.optional(),
|
||||
});
|
||||
|
||||
export type StatusPageFormData = z.infer<typeof statusPageSchema>;
|
||||
|
||||
// The step each field is validated on, from the per-field
|
||||
// `statusPageStepRegistry` metadata (unannotated fields default to step 0).
|
||||
const fieldSteps = (): [name: FieldPath<StatusPageFormData>, step: number][] =>
|
||||
Object.entries(statusPageSchema.shape).map(([name, field]) => [
|
||||
name as FieldPath<StatusPageFormData>,
|
||||
statusPageStepRegistry.get(field)?.step ?? 0,
|
||||
]);
|
||||
|
||||
// The fields that belong to a given wizard step. Derived from the schema so it
|
||||
// can't drift from the field definitions.
|
||||
export const statusPageStepFieldsFor = (step: number): FieldPath<StatusPageFormData>[] =>
|
||||
fieldSteps()
|
||||
.filter(([, fieldStep]) => fieldStep === step)
|
||||
.map(([name]) => name);
|
||||
|
||||
// Number of wizard steps, derived from the highest step its fields declare.
|
||||
export const statusPageStepCount = (): number =>
|
||||
Math.max(0, ...fieldSteps().map(([, step]) => step)) + 1;
|
||||
@@ -1,10 +0,0 @@
|
||||
import { z } from "zod";
|
||||
|
||||
export const tagSchema = z.object({
|
||||
name: z.string().min(1, "Please enter a tag name"),
|
||||
color: z
|
||||
.string()
|
||||
.regex(/^#([0-9a-fA-F]{6})$/, "Color must be a 6-digit hex value (e.g. #13715B)"),
|
||||
});
|
||||
|
||||
export type TagFormData = z.infer<typeof tagSchema>;
|
||||
+44
-142
@@ -73,9 +73,7 @@
|
||||
"paused": "متوقف مؤقتاً",
|
||||
"na": "غير متوفر",
|
||||
"resolved": "تم الحل",
|
||||
"responseTime": "وقت الاستجابة",
|
||||
"idle": "خامل",
|
||||
"running": "قيد التشغيل"
|
||||
"responseTime": "وقت الاستجابة"
|
||||
},
|
||||
"form": {
|
||||
"role": {
|
||||
@@ -122,17 +120,6 @@
|
||||
"active": "نشط",
|
||||
"responseTime": "وقت الاستجابة"
|
||||
}
|
||||
},
|
||||
"statusCode": {
|
||||
"down": "متوقف",
|
||||
"networkError": {
|
||||
"dns": "تعذر تحليل اسم المضيف (فشل بحث DNS).",
|
||||
"refused": "رفض الخادم الاتصال (المنفذ مغلق أو الخدمة لا تستمع).",
|
||||
"reset": "تمت إعادة تعيين الاتصال قبل تلقي استجابة.",
|
||||
"timeout": "لم يستجب الخادم في الوقت المحدد (انتهت مهلة الطلب).",
|
||||
"tls": "فشل تأكيد اتصال TLS أو SSL (مشكلة في الشهادة أو التشفير).",
|
||||
"unknown": "لم يتم تلقي أي استجابة HTTP من الهدف."
|
||||
}
|
||||
}
|
||||
},
|
||||
"components": {
|
||||
@@ -319,28 +306,28 @@
|
||||
"common": {
|
||||
"passwordRules": {
|
||||
"length": {
|
||||
"beginning": "يجب أن يكون على الأقل",
|
||||
"highlighted": "8 أحرف"
|
||||
"beginning": "",
|
||||
"highlighted": ""
|
||||
},
|
||||
"lowercase": {
|
||||
"beginning": "يجب أن يحتوي على الأقل على",
|
||||
"highlighted": "حرف صغير واحد"
|
||||
"beginning": "",
|
||||
"highlighted": ""
|
||||
},
|
||||
"match": {
|
||||
"beginning": "كلمات المرور",
|
||||
"highlighted": "يجب أن تتطابق"
|
||||
"beginning": "",
|
||||
"highlighted": ""
|
||||
},
|
||||
"number": {
|
||||
"beginning": "يجب أن يحتوي على الأقل على",
|
||||
"highlighted": "رقم واحد"
|
||||
"beginning": "",
|
||||
"highlighted": ""
|
||||
},
|
||||
"special": {
|
||||
"beginning": "يجب أن يحتوي على الأقل على",
|
||||
"highlighted": "حرف خاص واحد (!?@#$%^&*()-_=+[]{}|;:'\",./\\~`)"
|
||||
"beginning": "",
|
||||
"highlighted": ""
|
||||
},
|
||||
"uppercase": {
|
||||
"beginning": "يجب أن يحتوي على الأقل على",
|
||||
"highlighted": "حرف كبير واحد"
|
||||
"beginning": "",
|
||||
"highlighted": ""
|
||||
}
|
||||
},
|
||||
"form": {
|
||||
@@ -465,8 +452,7 @@
|
||||
"optionPagespeed": "PageSpeed",
|
||||
"optionHardware": "البنية التحتية",
|
||||
"optionGrpc": "gRPC",
|
||||
"optionWebSocket": "WebSocket",
|
||||
"optionDns": "DNS"
|
||||
"optionWebSocket": "WebSocket"
|
||||
},
|
||||
"bulkPause": {
|
||||
"paused_one": "تم إيقاف {{count}} شاشة مؤقتاً",
|
||||
@@ -476,8 +462,7 @@
|
||||
"alreadyPaused_one": "الشاشة المحددة متوقفة مؤقتاً بالفعل",
|
||||
"alreadyPaused_other": "جميع الشاشات المحددة متوقفة مؤقتاً بالفعل",
|
||||
"alreadyRunning_one": "الشاشة المحددة قيد التشغيل بالفعل",
|
||||
"alreadyRunning_other": "جميع الشاشات المحددة قيد التشغيل بالفعل",
|
||||
"partialFailure": "تم تحديث {{successCount}} من أجهزة المراقبة، ولكن فشلت مزامنة {{failedCount}} مع قائمة انتظار الوظائف"
|
||||
"alreadyRunning_other": "جميع الشاشات المحددة قيد التشغيل بالفعل"
|
||||
}
|
||||
}
|
||||
},
|
||||
@@ -498,9 +483,9 @@
|
||||
},
|
||||
"matchMethod": {
|
||||
"label": "طريقة المطابقة",
|
||||
"equal": "يساوي",
|
||||
"include": "يحتوي",
|
||||
"regex": "تعبير عادي"
|
||||
"equal": "",
|
||||
"include": "",
|
||||
"regex": ""
|
||||
}
|
||||
},
|
||||
"title": "إعدادات متقدمة"
|
||||
@@ -512,15 +497,15 @@
|
||||
"label": "تكرار الفحص",
|
||||
"value": {
|
||||
"fifteenMinutes": "15 دقيقة",
|
||||
"fifteenSeconds": "15 ثانية",
|
||||
"fifteenSeconds": "",
|
||||
"fiveMinutes": "5 دقائق",
|
||||
"fourMinutes": "4 دقائق",
|
||||
"oneMinute": "دقيقة واحدة",
|
||||
"fourMinutes": "",
|
||||
"oneMinute": "",
|
||||
"tenMinutes": "10 دقائق",
|
||||
"thirtyMinutes": "30 دقيقة",
|
||||
"thirtySeconds": "30 ثانية",
|
||||
"threeMinutes": "3 دقائق",
|
||||
"twoMinutes": "دقيقتان"
|
||||
"thirtySeconds": "",
|
||||
"threeMinutes": "",
|
||||
"twoMinutes": ""
|
||||
}
|
||||
}
|
||||
},
|
||||
@@ -549,8 +534,8 @@
|
||||
"placeholder": "https://www.google.com"
|
||||
},
|
||||
"game": {
|
||||
"label": "اختر اللعبة",
|
||||
"placeholder": "حدد لعبة"
|
||||
"label": "",
|
||||
"placeholder": ""
|
||||
},
|
||||
"port": {
|
||||
"label": "المنفذ المراد مراقبته",
|
||||
@@ -567,40 +552,19 @@
|
||||
"captureUrl": {
|
||||
"label": "نقطة نهاية Capture",
|
||||
"placeholder": "http://192.168.1.10:5001/api/v1/metrics"
|
||||
},
|
||||
"dnsRecordType": {
|
||||
"label": "نوع سجل DNS",
|
||||
"value": {
|
||||
"A": "A",
|
||||
"AAAA": "AAAA",
|
||||
"CNAME": "CNAME",
|
||||
"MX": "MX",
|
||||
"NS": "NS",
|
||||
"TXT": "TXT"
|
||||
}
|
||||
},
|
||||
"dnsServer": {
|
||||
"label": "خادم DNS",
|
||||
"placeholder": "8.8.8.8"
|
||||
},
|
||||
"strategy": {
|
||||
"desktop": "سطح المكتب",
|
||||
"label": "الاستراتيجية",
|
||||
"mobile": "الجوال"
|
||||
}
|
||||
},
|
||||
"title": "الإعدادات العامة",
|
||||
"description": {
|
||||
"http": "أدخل الرابط أو عنوان IP للمراقبة (مثال: https://example.com/ أو 192.168.1.100) وأضف اسم عرض واضح يظهر في لوحة التحكم.",
|
||||
"ping": "أدخل عنوان IP أو اسم المضيف للاتصال (على سبيل المثال، 192.168.1.100 أو example.com) وأضف اسماً واضحاً يظهر في لوحة المعلومات.",
|
||||
"port": "أدخل عنوان URL أو IP للخادم ورقم المنفذ واسماً واضحاً يظهر في لوحة المعلومات.",
|
||||
"docker": "أدخل اسم حاوية Docker أو المعرف. يمكنك استخدام اسم الحاوية (مثل my-app) أو معرف الحاوية (معرف كامل 64 حرف أو معرف قصير).",
|
||||
"ping": "",
|
||||
"port": "",
|
||||
"docker": "",
|
||||
"game": "أدخل عنوان IP أو اسم المضيف ورقم المنفذ للاختبار (مثل 192.168.1.100 أو example.com) واختر نوع اللعبة. تتطلب بعض الألعاب تفعيل استعلامات الخادم في ملف الإعدادات الخاص بها — يُرجى مراجعة وثائق خادم اللعبة. اطّلع على <gamedigLink>قائمة الألعاب المدعومة</gamedigLink> لمعرفة تفاصيل البروتوكول.",
|
||||
"pagespeed": "تتبع أداء تحميل الصفحة ومؤشرات Core Web Vitals ودرجات التحسين لموقعك.",
|
||||
"grpc": "أدخل اسم المضيف ومنفذ خادم gRPC، وحدد اختيارياً اسم خدمة لفحص الصحة، وأضف اسم عرض.",
|
||||
"websocket": "أدخل رابط WebSocket للمراقبة (مثال: wss://example.com/socket) وأضف اسم عرض.",
|
||||
"hardware": "راقب استخدام وحدة المعالجة المركزية والذاكرة والقرص ودرجة الحرارة لبنيتك التحتية. يجب أن يتضمن عنوان URL لنقطة نهاية Capture المسار الكامل /api/v1/metrics (مثال: http://192.168.1.10:5001/api/v1/metrics). بالنسبة لمفتاح التفويض، الصق سلسلة الرمز فقط — لا تُضمّن كلمة 'Bearer'.",
|
||||
"dns": "راقب ما إذا كان خادم DNS محدد يستجيب."
|
||||
"hardware": "راقب استخدام وحدة المعالجة المركزية والذاكرة والقرص ودرجة الحرارة لبنيتك التحتية. يجب أن يتضمن عنوان URL لنقطة نهاية Capture المسار الكامل /api/v1/metrics (مثال: http://192.168.1.10:5001/api/v1/metrics). بالنسبة لمفتاح التفويض، الصق سلسلة الرمز فقط — لا تُضمّن كلمة 'Bearer'."
|
||||
}
|
||||
},
|
||||
"ignoreTls": {
|
||||
@@ -637,8 +601,7 @@
|
||||
"optionHttpDescription": "استخدم HTTP(S) لمراقبة موقعك الإلكتروني أو نقطة نهاية API.",
|
||||
"optionPingDescription": "استخدم ICMP Ping لمراقبة ما إذا كان الخادم متصلاً.",
|
||||
"optionPortDescription": "مراقبة ما إذا كان منفذ معين على الخادم مفتوحاً.",
|
||||
"title": "النوع",
|
||||
"optionDnsDescription": "راقب ما إذا كان خادم DNS محدد يستجيب."
|
||||
"title": "النوع"
|
||||
},
|
||||
"thresholds": {
|
||||
"title": "حدود التنبيه",
|
||||
@@ -802,7 +765,7 @@
|
||||
"headers": {
|
||||
"endTime": "وقت الانتهاء",
|
||||
"resolutionType": "نوع الحل",
|
||||
"startTime": "وقت البدء",
|
||||
"startTime": "",
|
||||
"statusCode": "رمز الحالة"
|
||||
},
|
||||
"resolvedIncidents": "الحوادث المحلولة",
|
||||
@@ -846,13 +809,13 @@
|
||||
}
|
||||
},
|
||||
"statBoxes": {
|
||||
"avgCpuTemperature": "متوسط درجة حرارة المعالج",
|
||||
"cpuFrequency": "تردد المعالج",
|
||||
"cpuLogical": "المعالج (المنطقي)",
|
||||
"cpuPhysical": "المعالج (الفعلي)",
|
||||
"avgCpuTemperature": "",
|
||||
"cpuFrequency": "",
|
||||
"cpuLogical": "",
|
||||
"cpuPhysical": "",
|
||||
"disk": "القرص",
|
||||
"memory": "الذاكرة",
|
||||
"os": "نظام التشغيل"
|
||||
"os": ""
|
||||
},
|
||||
"table": {
|
||||
"headers": {
|
||||
@@ -863,7 +826,7 @@
|
||||
},
|
||||
"tabs": {
|
||||
"labels": {
|
||||
"network": "الشبكة",
|
||||
"network": "",
|
||||
"overview": "نظرة عامة"
|
||||
}
|
||||
},
|
||||
@@ -946,8 +909,7 @@
|
||||
"lastFinishedAt": "آخر انتهاء في",
|
||||
"lastRunTook": "مدة آخر تشغيل",
|
||||
"lastFailedAt": "آخر فشل في",
|
||||
"failReason": "سبب الفشل",
|
||||
"state": "الحالة"
|
||||
"failReason": "سبب الفشل"
|
||||
}
|
||||
},
|
||||
"queueFallback": {
|
||||
@@ -967,8 +929,8 @@
|
||||
},
|
||||
"table": {
|
||||
"headers": {
|
||||
"nextWindow": "النافذة التالية",
|
||||
"repeat": "تكرار"
|
||||
"nextWindow": "",
|
||||
"repeat": ""
|
||||
}
|
||||
},
|
||||
"form": {
|
||||
@@ -1070,7 +1032,7 @@
|
||||
},
|
||||
"telegram": {
|
||||
"title": "تهيئة Telegram",
|
||||
"description": "قم بتكوين بوت Telegram الخاص بك لإرسال الإشعارات.",
|
||||
"description": "",
|
||||
"optionBotToken": "رمز البوت",
|
||||
"placeholderBotToken": "123456789:ABCdefGhIJKlmNoPQRsTUVwxyZ",
|
||||
"optionChatId": "معرّف المحادثة",
|
||||
@@ -1137,10 +1099,6 @@
|
||||
"header": {
|
||||
"title": "مراقبات PageSpeed",
|
||||
"description": "تابع Core Web Vitals ودرجات Lighthouse عبر الزمن لاكتشاف التراجع قبل أن يلاحظه المستخدمون."
|
||||
},
|
||||
"strategy": {
|
||||
"desktop": "سطح المكتب",
|
||||
"mobile": "الجوال"
|
||||
}
|
||||
},
|
||||
"settings": {
|
||||
@@ -1243,7 +1201,7 @@
|
||||
"email": {
|
||||
"title": "إعدادات البريد الإلكتروني",
|
||||
"description": "تهيئة إعدادات البريد الإلكتروني لنظامك. يُستخدم لإرسال الإشعارات والتنبيهات.",
|
||||
"descriptionTransport": "هذا يبني نقل SMTP لـ NodeMailer",
|
||||
"descriptionTransport": "",
|
||||
"descriptionTransportLink": "اطلع على المواصفات هنا",
|
||||
"option": {
|
||||
"host": {
|
||||
@@ -1289,10 +1247,6 @@
|
||||
},
|
||||
"rejectUnauthorized": {
|
||||
"label": "رفض الشهادات غير الصالحة: رفض الاتصالات ذات الشهادات الموقعة ذاتياً أو غير الموثوقة"
|
||||
},
|
||||
"displayName": {
|
||||
"label": "اسم المرسل (اختياري) - الاسم الودي المعروض في حقل المرسل",
|
||||
"placeholder": "إشعارات Checkmate"
|
||||
}
|
||||
}
|
||||
},
|
||||
@@ -1353,20 +1307,6 @@
|
||||
"uptime": {
|
||||
"title": "وقت التشغيل",
|
||||
"responseTime": "وقت الاستجابة"
|
||||
},
|
||||
"chart": {
|
||||
"avg": "متوسط {{value}} مللي ثانية",
|
||||
"downTooltip": "متوقف",
|
||||
"heatmapAria": "خريطة حرارية لزمن الاستجابة",
|
||||
"max": "أقصى {{value}} مللي ثانية"
|
||||
},
|
||||
"status": {
|
||||
"breached": "تم تجاوز الحد",
|
||||
"down": "متوقف",
|
||||
"initializing": "قيد التهيئة",
|
||||
"maintenance": "صيانة",
|
||||
"paused": "متوقف مؤقتاً",
|
||||
"up": "قيد التشغيل"
|
||||
}
|
||||
},
|
||||
"statusBar": {
|
||||
@@ -1384,9 +1324,7 @@
|
||||
"maintenance": "بعض الأنظمة قيد الصيانة",
|
||||
"partiallyPaused": "بعض الأنظمة متوقفة مؤقتًا",
|
||||
"initializing": "بعض الأنظمة قيد التهيئة",
|
||||
"noMonitors": "لم يتم تكوين أي شاشة",
|
||||
"monitoringSummary": "مراقبة {{count}} خدمة · يتم التحديث كل 10 ثوانٍ",
|
||||
"monitoringSummary_other": "مراقبة {{count}} خدمات · يتم التحديث كل 10 ثوانٍ"
|
||||
"noMonitors": "لم يتم تكوين أي شاشة"
|
||||
},
|
||||
"table": {
|
||||
"headers": {
|
||||
@@ -1477,47 +1415,11 @@
|
||||
"label": "إظهار مقاييس البنية التحتية"
|
||||
}
|
||||
}
|
||||
},
|
||||
"theme": {
|
||||
"description": "اختر النمط المرئي لصفحة الحالة العامة الخاصة بك.",
|
||||
"label": "السمة",
|
||||
"options": {
|
||||
"bold": {
|
||||
"description": "خط كبير ومسافات واثقة. رائعة للصفحات التي تركز على العلامة التجارية.",
|
||||
"name": "غامق"
|
||||
},
|
||||
"editorial": {
|
||||
"description": "عناوين بخط مسرف وفواصل دقيقة. مميز وهادئ.",
|
||||
"name": "تحريري"
|
||||
},
|
||||
"modern": {
|
||||
"description": "بجودة SaaS مع نقطة حالة نابضة وبطاقات تتلاشى بنعومة.",
|
||||
"name": "حديث"
|
||||
},
|
||||
"refined": {
|
||||
"description": "نظيف واحترافي وقريب من مظهر Checkmate الكلاسيكي.",
|
||||
"name": "مكرر"
|
||||
}
|
||||
},
|
||||
"title": "سمة الصفحة"
|
||||
},
|
||||
"themeMode": {
|
||||
"auto": "تلقائي (اتبع جهاز الزائر)",
|
||||
"dark": "داكن فقط",
|
||||
"label": "وضع السمة",
|
||||
"light": "فاتح فقط"
|
||||
}
|
||||
},
|
||||
"header": {
|
||||
"title": "صفحات الحالة",
|
||||
"description": "انشر صفحات عامة تُظهر للعملاء وأصحاب المصلحة وقت التشغيل الفعلي وتاريخ الحوادث."
|
||||
},
|
||||
"editorial": {
|
||||
"allUp": "جميع الأنظمة تعمل بشكل طبيعي.",
|
||||
"reportTitle": "تقرير الخدمة"
|
||||
},
|
||||
"footer": {
|
||||
"poweredBy": "مشغل بواسطة"
|
||||
}
|
||||
},
|
||||
"uptime": {
|
||||
|
||||
@@ -73,9 +73,7 @@
|
||||
"paused": "pausat",
|
||||
"na": "N/D",
|
||||
"resolved": "Resolt",
|
||||
"responseTime": "Temps de resposta",
|
||||
"idle": "Inactiu",
|
||||
"running": "En execució"
|
||||
"responseTime": "Temps de resposta"
|
||||
},
|
||||
"form": {
|
||||
"role": {
|
||||
@@ -122,17 +120,6 @@
|
||||
"active": "Actiu",
|
||||
"responseTime": "Temps de resposta"
|
||||
}
|
||||
},
|
||||
"statusCode": {
|
||||
"down": "Inactiu",
|
||||
"networkError": {
|
||||
"dns": "No s'ha pogut resoldre el nom d'amfitrió (la cerca DNS ha fallat).",
|
||||
"refused": "El servidor ha rebutjat la connexió (port tancat o servei no actiu).",
|
||||
"reset": "La connexió s'ha reiniciat abans de rebre una resposta.",
|
||||
"timeout": "El servidor no ha respost a temps (s'ha esgotat el temps d'espera).",
|
||||
"tls": "Ha fallat la negociació TLS o SSL (problema de certificat o xifratge).",
|
||||
"unknown": "No s'ha rebut cap resposta HTTP de l'objectiu."
|
||||
}
|
||||
}
|
||||
},
|
||||
"components": {
|
||||
@@ -434,11 +421,7 @@
|
||||
"inviteMember": "Convidar membre",
|
||||
"openSite": "Obrir lloc",
|
||||
"pause": "Pausar",
|
||||
"resume": "Reprendre",
|
||||
"bulkSelected_one": "{{count}} monitor seleccionat",
|
||||
"bulkSelected_other": "{{count}} monitors seleccionats",
|
||||
"selectAll": "Selecciona tots els monitors",
|
||||
"selectMonitor": "Selecciona {{name}}"
|
||||
"resume": "Reprendre"
|
||||
},
|
||||
"statBoxes": {
|
||||
"activeFor": "Actiu des de",
|
||||
@@ -465,19 +448,7 @@
|
||||
"optionPagespeed": "PageSpeed",
|
||||
"optionHardware": "Infraestructura",
|
||||
"optionGrpc": "gRPC",
|
||||
"optionWebSocket": "WebSocket",
|
||||
"optionDns": "DNS"
|
||||
},
|
||||
"bulkPause": {
|
||||
"alreadyPaused_one": "El monitor seleccionat ja està pausat",
|
||||
"alreadyPaused_other": "Tots els monitors seleccionats ja estan pausats",
|
||||
"alreadyRunning_one": "El monitor seleccionat ja s'està executant",
|
||||
"alreadyRunning_other": "Tots els monitors seleccionats ja s'estan executant",
|
||||
"paused_one": "{{count}} monitor pausat",
|
||||
"paused_other": "{{count}} monitors pausats",
|
||||
"resumed_one": "{{count}} monitor reprès",
|
||||
"resumed_other": "{{count}} monitors represos",
|
||||
"partialFailure": "S'han actualitzat {{successCount}} monitors, però {{failedCount}} han fallat en sincronitzar-se amb la cua de tasques"
|
||||
"optionWebSocket": "WebSocket"
|
||||
}
|
||||
}
|
||||
},
|
||||
@@ -567,26 +538,6 @@
|
||||
"captureUrl": {
|
||||
"label": "Endpoint de captura",
|
||||
"placeholder": "http://192.168.1.10:5001/api/v1/metrics"
|
||||
},
|
||||
"dnsRecordType": {
|
||||
"label": "Tipus de registre DNS",
|
||||
"value": {
|
||||
"A": "A",
|
||||
"AAAA": "AAAA",
|
||||
"CNAME": "CNAME",
|
||||
"MX": "MX",
|
||||
"NS": "NS",
|
||||
"TXT": "TXT"
|
||||
}
|
||||
},
|
||||
"dnsServer": {
|
||||
"label": "Servidor DNS",
|
||||
"placeholder": "8.8.8.8"
|
||||
},
|
||||
"strategy": {
|
||||
"desktop": "Escriptori",
|
||||
"label": "Estratègia",
|
||||
"mobile": "Mòbil"
|
||||
}
|
||||
},
|
||||
"title": "Configuració general",
|
||||
@@ -599,8 +550,7 @@
|
||||
"pagespeed": "Fes un seguiment del rendiment de càrrega de pàgina, Core Web Vitals i puntuacions d'optimització del teu lloc web.",
|
||||
"grpc": "Introdueix el nom d'host i el port del servidor gRPC, opcionalment especifica un nom de servei per a la comprovació de salut, i afegeix un nom de visualització.",
|
||||
"websocket": "Introdueix la URL de WebSocket a monitorar (p. ex., wss://example.com/socket) i afegeix un nom de visualització.",
|
||||
"hardware": "Monitoritza l'ús de CPU, memòria, disc i temperatura per a la teva infraestructura. La URL de l'endpoint de captura ha d'incloure la ruta completa /api/v1/metrics (p. ex., http://192.168.1.10:5001/api/v1/metrics). Per al secret d'autorització, enganxa només la cadena del token — no incloguis 'Bearer'.",
|
||||
"dns": "Monitoritza si un servidor DNS específic respon."
|
||||
"hardware": "Monitoritza l'ús de CPU, memòria, disc i temperatura per a la teva infraestructura. La URL de l'endpoint de captura ha d'incloure la ruta completa /api/v1/metrics (p. ex., http://192.168.1.10:5001/api/v1/metrics). Per al secret d'autorització, enganxa només la cadena del token — no incloguis 'Bearer'."
|
||||
}
|
||||
},
|
||||
"ignoreTls": {
|
||||
@@ -637,8 +587,7 @@
|
||||
"optionHttpDescription": "Usa HTTP(S) per monitorar el teu lloc web o endpoint d'API.",
|
||||
"optionPingDescription": "Usa ICMP Ping per monitorar si un servidor és en línia.",
|
||||
"optionPortDescription": "Monitoritza si un port específic d'un servidor és obert.",
|
||||
"title": "Tipus",
|
||||
"optionDnsDescription": "Monitoritza si un servidor DNS específic respon."
|
||||
"title": "Tipus"
|
||||
},
|
||||
"thresholds": {
|
||||
"title": "Llindars d'alerta",
|
||||
@@ -950,8 +899,7 @@
|
||||
"lastFinishedAt": "Darrera finalització",
|
||||
"lastRunTook": "Durada de la darrera execució",
|
||||
"lastFailedAt": "Darrera fallada",
|
||||
"failReason": "Motiu de la fallada",
|
||||
"state": "Estat"
|
||||
"failReason": "Motiu de la fallada"
|
||||
}
|
||||
},
|
||||
"header": {
|
||||
@@ -1137,10 +1085,6 @@
|
||||
"header": {
|
||||
"title": "Monitors de PageSpeed",
|
||||
"description": "Fes un seguiment de les Core Web Vitals i les puntuacions de Lighthouse al llarg del temps per detectar regressions abans que els usuaris ho facin."
|
||||
},
|
||||
"strategy": {
|
||||
"desktop": "Escriptori",
|
||||
"mobile": "Mòbil"
|
||||
}
|
||||
},
|
||||
"settings": {
|
||||
|
||||
+32
-130
@@ -73,9 +73,7 @@
|
||||
"paused": "pozastaveno",
|
||||
"na": "N/A",
|
||||
"resolved": "Vyřešeno",
|
||||
"responseTime": "Doba odezvy",
|
||||
"idle": "Nečinný",
|
||||
"running": "Spuštěno"
|
||||
"responseTime": "Doba odezvy"
|
||||
},
|
||||
"form": {
|
||||
"role": {
|
||||
@@ -122,17 +120,6 @@
|
||||
"active": "Aktivní",
|
||||
"responseTime": "Doba odezvy"
|
||||
}
|
||||
},
|
||||
"statusCode": {
|
||||
"down": "Mimo provoz",
|
||||
"networkError": {
|
||||
"dns": "Nepodařilo se přeložit název hostitele (vyhledávání DNS selhalo).",
|
||||
"refused": "Server odmítl spojení (port je uzavřený nebo služba neposlouchá).",
|
||||
"reset": "Spojení bylo resetováno před přijetím odpovědi.",
|
||||
"timeout": "Server neodpověděl včas (vypršel časový limit požadavku).",
|
||||
"tls": "Selhal handshake TLS nebo SSL (problém s certifikátem nebo šifrováním).",
|
||||
"unknown": "Z cíle nebyla obdržena žádná odpověď HTTP."
|
||||
}
|
||||
}
|
||||
},
|
||||
"components": {
|
||||
@@ -465,8 +452,7 @@
|
||||
"optionPagespeed": "PageSpeed",
|
||||
"optionHardware": "Infrastruktura",
|
||||
"optionGrpc": "gRPC",
|
||||
"optionWebSocket": "WebSocket",
|
||||
"optionDns": "DNS"
|
||||
"optionWebSocket": "WebSocket"
|
||||
},
|
||||
"bulkPause": {
|
||||
"paused_one": "{{count}} monitor pozastaven",
|
||||
@@ -476,8 +462,7 @@
|
||||
"alreadyPaused_one": "Vybraný monitor je již pozastaven",
|
||||
"alreadyPaused_other": "Všechny vybrané monitory jsou již pozastaveny",
|
||||
"alreadyRunning_one": "Vybraný monitor již běží",
|
||||
"alreadyRunning_other": "Všechny vybrané monitory již běží",
|
||||
"partialFailure": "Bylo aktualizováno {{successCount}} monitorů, ale u {{failedCount}} se nezdařila synchronizace s frontou úloh"
|
||||
"alreadyRunning_other": "Všechny vybrané monitory již běží"
|
||||
}
|
||||
}
|
||||
},
|
||||
@@ -498,9 +483,9 @@
|
||||
},
|
||||
"matchMethod": {
|
||||
"label": "Metoda porovnání",
|
||||
"equal": "Rovná se",
|
||||
"include": "Obsahuje",
|
||||
"regex": "Regulární výraz"
|
||||
"equal": "",
|
||||
"include": "",
|
||||
"regex": ""
|
||||
}
|
||||
},
|
||||
"title": "Pokročilá nastavení"
|
||||
@@ -512,15 +497,15 @@
|
||||
"label": "Frekvence kontroly",
|
||||
"value": {
|
||||
"fifteenMinutes": "15 minut",
|
||||
"fifteenSeconds": "15 sekund",
|
||||
"fifteenSeconds": "",
|
||||
"fiveMinutes": "5 minut",
|
||||
"fourMinutes": "4 minuty",
|
||||
"oneMinute": "1 minuta",
|
||||
"fourMinutes": "",
|
||||
"oneMinute": "",
|
||||
"tenMinutes": "10 minut",
|
||||
"thirtyMinutes": "30 minut",
|
||||
"thirtySeconds": "30 sekund",
|
||||
"threeMinutes": "3 minuty",
|
||||
"twoMinutes": "2 minuty"
|
||||
"thirtySeconds": "",
|
||||
"threeMinutes": "",
|
||||
"twoMinutes": ""
|
||||
}
|
||||
}
|
||||
},
|
||||
@@ -549,8 +534,8 @@
|
||||
"placeholder": "https://www.google.com"
|
||||
},
|
||||
"game": {
|
||||
"label": "Vybrat hru",
|
||||
"placeholder": "Vyberte hru"
|
||||
"label": "",
|
||||
"placeholder": ""
|
||||
},
|
||||
"port": {
|
||||
"label": "Port ke sledování",
|
||||
@@ -567,40 +552,19 @@
|
||||
"captureUrl": {
|
||||
"label": "Endpoint Capture",
|
||||
"placeholder": "http://192.168.1.10:5001/api/v1/metrics"
|
||||
},
|
||||
"dnsRecordType": {
|
||||
"label": "Typ záznamu DNS",
|
||||
"value": {
|
||||
"A": "A",
|
||||
"AAAA": "AAAA",
|
||||
"CNAME": "CNAME",
|
||||
"MX": "MX",
|
||||
"NS": "NS",
|
||||
"TXT": "TXT"
|
||||
}
|
||||
},
|
||||
"dnsServer": {
|
||||
"label": "DNS server",
|
||||
"placeholder": "8.8.8.8"
|
||||
},
|
||||
"strategy": {
|
||||
"desktop": "Stolní počítač",
|
||||
"label": "Strategie",
|
||||
"mobile": "Mobil"
|
||||
}
|
||||
},
|
||||
"title": "Obecná nastavení",
|
||||
"description": {
|
||||
"http": "Zadejte URL nebo IP adresu ke sledování (např. https://example.com/ nebo 192.168.1.100) a přidejte jasný zobrazovaný název, který se zobrazí na přehledu.",
|
||||
"ping": "Zadejte IP adresu nebo název hostitele pro ping (např. 192.168.1.100 nebo example.com) a přidejte přehledný název, který se zobrazí na dashboardu.",
|
||||
"port": "Zadejte URL nebo IP serveru, číslo portu a přehledný název, který se zobrazí na dashboardu.",
|
||||
"docker": "Zadejte název nebo ID Docker kontejneru. Můžete použít buď název kontejneru (např. my-app) nebo ID kontejneru (úplné 64znakové ID nebo krátké ID).",
|
||||
"ping": "",
|
||||
"port": "",
|
||||
"docker": "",
|
||||
"game": "Zadejte IP adresu nebo název hostitele a číslo portu pro ping (např. 192.168.1.100 nebo example.com) a vyberte typ hry. Některé hry vyžadují povolení dotazů na server v jejich konfiguračním souboru — viz dokumentace vašeho herního serveru. Podrobnosti o protokolu najdete v <gamedigLink>seznamu podporovaných her</gamedigLink>.",
|
||||
"pagespeed": "Sledujte výkon načítání stránky, metriky Core Web Vitals a hodnocení optimalizace vašeho webu.",
|
||||
"grpc": "Zadejte název hostitele a port gRPC serveru, volitelně zadejte název služby pro kontrolu stavu a přidejte zobrazovaný název.",
|
||||
"websocket": "Zadejte WebSocket URL ke sledování (např. wss://example.com/socket) a přidejte zobrazovaný název.",
|
||||
"hardware": "Sledujte využití CPU, paměti, disku a teplotu vaší infrastruktury. URL endpointu Capture musí obsahovat celou cestu /api/v1/metrics (např. http://192.168.1.10:5001/api/v1/metrics). Do autorizačního klíče vložte pouze řetězec tokenu — nezahrnujte 'Bearer'.",
|
||||
"dns": "Sledujte, zda konkrétní DNS server odpovídá."
|
||||
"hardware": "Sledujte využití CPU, paměti, disku a teplotu vaší infrastruktury. URL endpointu Capture musí obsahovat celou cestu /api/v1/metrics (např. http://192.168.1.10:5001/api/v1/metrics). Do autorizačního klíče vložte pouze řetězec tokenu — nezahrnujte 'Bearer'."
|
||||
}
|
||||
},
|
||||
"ignoreTls": {
|
||||
@@ -637,8 +601,7 @@
|
||||
"optionHttpDescription": "Použijte HTTP(S) ke sledování vašeho webu nebo API koncového bodu.",
|
||||
"optionPingDescription": "Použijte ICMP Ping ke sledování, zda je server online.",
|
||||
"optionPortDescription": "Sledujte, zda je konkrétní port na serveru otevřen.",
|
||||
"title": "Typ",
|
||||
"optionDnsDescription": "Sledujte, zda konkrétní DNS server odpovídá."
|
||||
"title": "Typ"
|
||||
},
|
||||
"thresholds": {
|
||||
"title": "Prahové hodnoty upozornění",
|
||||
@@ -802,7 +765,7 @@
|
||||
"headers": {
|
||||
"endTime": "Čas ukončení",
|
||||
"resolutionType": "Typ řešení",
|
||||
"startTime": "Čas zahájení",
|
||||
"startTime": "",
|
||||
"statusCode": "Stavový kód"
|
||||
},
|
||||
"resolvedIncidents": "Vyřešené incidenty",
|
||||
@@ -846,13 +809,13 @@
|
||||
}
|
||||
},
|
||||
"statBoxes": {
|
||||
"avgCpuTemperature": "Průměrná teplota CPU",
|
||||
"cpuFrequency": "Frekvence CPU",
|
||||
"cpuLogical": "CPU (logický)",
|
||||
"cpuPhysical": "CPU (fyzický)",
|
||||
"avgCpuTemperature": "",
|
||||
"cpuFrequency": "",
|
||||
"cpuLogical": "",
|
||||
"cpuPhysical": "",
|
||||
"disk": "Disk",
|
||||
"memory": "Paměť",
|
||||
"os": "OS"
|
||||
"os": ""
|
||||
},
|
||||
"table": {
|
||||
"headers": {
|
||||
@@ -863,7 +826,7 @@
|
||||
},
|
||||
"tabs": {
|
||||
"labels": {
|
||||
"network": "Síť",
|
||||
"network": "",
|
||||
"overview": "Přehled"
|
||||
}
|
||||
},
|
||||
@@ -946,8 +909,7 @@
|
||||
"lastFinishedAt": "Naposledy dokončeno",
|
||||
"lastRunTook": "Poslední běh trval",
|
||||
"lastFailedAt": "Poslední selhání",
|
||||
"failReason": "Důvod selhání",
|
||||
"state": "Stav"
|
||||
"failReason": "Důvod selhání"
|
||||
}
|
||||
},
|
||||
"queueFallback": {
|
||||
@@ -967,8 +929,8 @@
|
||||
},
|
||||
"table": {
|
||||
"headers": {
|
||||
"nextWindow": "Další okno",
|
||||
"repeat": "Opakovat"
|
||||
"nextWindow": "",
|
||||
"repeat": ""
|
||||
}
|
||||
},
|
||||
"form": {
|
||||
@@ -1070,7 +1032,7 @@
|
||||
},
|
||||
"telegram": {
|
||||
"title": "Konfigurace Telegramu",
|
||||
"description": "Nakonfigurujte svého Telegram bota pro odesílání oznámení.",
|
||||
"description": "",
|
||||
"optionBotToken": "Token bota",
|
||||
"placeholderBotToken": "123456789:ABCdefGhIJKlmNoPQRsTUVwxyZ",
|
||||
"optionChatId": "ID chatu",
|
||||
@@ -1137,10 +1099,6 @@
|
||||
"header": {
|
||||
"title": "Monitory PageSpeed",
|
||||
"description": "Sledujte Core Web Vitals a skóre Lighthouse v čase a zachyťte regrese dříve než vaši uživatelé."
|
||||
},
|
||||
"strategy": {
|
||||
"desktop": "Stolní počítač",
|
||||
"mobile": "Mobil"
|
||||
}
|
||||
},
|
||||
"settings": {
|
||||
@@ -1243,7 +1201,7 @@
|
||||
"email": {
|
||||
"title": "Nastavení emailu",
|
||||
"description": "Nastavte emailovou konfiguraci pro váš systém. Používá se k odesílání oznámení a upozornění.",
|
||||
"descriptionTransport": "Toto vytvoří SMTP transport pro NodeMailer",
|
||||
"descriptionTransport": "",
|
||||
"descriptionTransportLink": "Zobrazit specifikace zde",
|
||||
"option": {
|
||||
"host": {
|
||||
@@ -1289,10 +1247,6 @@
|
||||
},
|
||||
"rejectUnauthorized": {
|
||||
"label": "Odmítnout neplatné certifikáty: Odmítnout připojení se sebou podepsanými nebo nedůvěryhodnými certifikáty"
|
||||
},
|
||||
"displayName": {
|
||||
"label": "Jméno odesílatele (nepovinné) - Přátelské jméno zobrazené v poli Od",
|
||||
"placeholder": "Oznámení Checkmate"
|
||||
}
|
||||
}
|
||||
},
|
||||
@@ -1353,20 +1307,6 @@
|
||||
"uptime": {
|
||||
"title": "Dostupnost",
|
||||
"responseTime": "Doba odezvy"
|
||||
},
|
||||
"chart": {
|
||||
"avg": "průměr {{value}}ms",
|
||||
"downTooltip": "Mimo provoz",
|
||||
"heatmapAria": "Tepelná mapa doby odezvy",
|
||||
"max": "max {{value}}ms"
|
||||
},
|
||||
"status": {
|
||||
"breached": "Překročen limit",
|
||||
"down": "Mimo provoz",
|
||||
"initializing": "Inicializace",
|
||||
"maintenance": "Údržba",
|
||||
"paused": "Pozastaveno",
|
||||
"up": "V provozu"
|
||||
}
|
||||
},
|
||||
"statusBar": {
|
||||
@@ -1384,9 +1324,7 @@
|
||||
"maintenance": "Některé systémy jsou v údržbě",
|
||||
"partiallyPaused": "Některé systémy jsou pozastavené",
|
||||
"initializing": "Některé systémy se inicializují",
|
||||
"noMonitors": "Nebyly nakonfigurovány žádné monitory",
|
||||
"monitoringSummary": "Sledování {{count}} služby · Aktualizace každých 10 sekund",
|
||||
"monitoringSummary_other": "Sledování {{count}} služeb · Aktualizace každých 10 sekund"
|
||||
"noMonitors": "Nebyly nakonfigurovány žádné monitory"
|
||||
},
|
||||
"table": {
|
||||
"headers": {
|
||||
@@ -1477,47 +1415,11 @@
|
||||
"label": "Zobrazit metriky infrastruktury"
|
||||
}
|
||||
}
|
||||
},
|
||||
"theme": {
|
||||
"description": "Vyberte vizuální styl pro veřejnou stavovou stránku.",
|
||||
"label": "Motiv",
|
||||
"options": {
|
||||
"bold": {
|
||||
"description": "Velké písmo a sebevědomé rozložení. Vhodné pro stránky zaměřené na značku.",
|
||||
"name": "Tučný"
|
||||
},
|
||||
"editorial": {
|
||||
"description": "Patkové nadpisy a tenké oddělovače. Odlišný a klidný.",
|
||||
"name": "Redakční"
|
||||
},
|
||||
"modern": {
|
||||
"description": "Úroveň SaaS s pulzující stavovou tečkou a jemně mizejícími kartami.",
|
||||
"name": "Moderní"
|
||||
},
|
||||
"refined": {
|
||||
"description": "Čistý, profesionální, blízký klasickému vzhledu Checkmate.",
|
||||
"name": "Vytříbený"
|
||||
}
|
||||
},
|
||||
"title": "Motiv stránky"
|
||||
},
|
||||
"themeMode": {
|
||||
"auto": "Automaticky (podle zařízení návštěvníka)",
|
||||
"dark": "Pouze tmavý",
|
||||
"label": "Režim motivu",
|
||||
"light": "Pouze světlý"
|
||||
}
|
||||
},
|
||||
"header": {
|
||||
"title": "Stavové stránky",
|
||||
"description": "Publikujte veřejné stránky, které zákazníkům a zúčastněným stranám zobrazují dostupnost v reálném čase a historii incidentů."
|
||||
},
|
||||
"editorial": {
|
||||
"allUp": "Všechny systémy fungují normálně.",
|
||||
"reportTitle": "Zpráva o službě"
|
||||
},
|
||||
"footer": {
|
||||
"poweredBy": "Provozováno službou"
|
||||
}
|
||||
},
|
||||
"uptime": {
|
||||
|
||||
+7
-105
@@ -73,9 +73,7 @@
|
||||
"paused": "pausiert",
|
||||
"na": "N/A",
|
||||
"resolved": "Gelöst",
|
||||
"responseTime": "Antwortzeit",
|
||||
"idle": "Untätig",
|
||||
"running": "Läuft"
|
||||
"responseTime": "Antwortzeit"
|
||||
},
|
||||
"form": {
|
||||
"role": {
|
||||
@@ -122,17 +120,6 @@
|
||||
"active": "Aktiv",
|
||||
"responseTime": "Antwortzeit"
|
||||
}
|
||||
},
|
||||
"statusCode": {
|
||||
"down": "Ausgefallen",
|
||||
"networkError": {
|
||||
"dns": "Hostname konnte nicht aufgelöst werden (DNS-Auflösung fehlgeschlagen).",
|
||||
"refused": "Der Server hat die Verbindung abgelehnt (Port geschlossen oder Dienst lauscht nicht).",
|
||||
"reset": "Die Verbindung wurde zurückgesetzt, bevor eine Antwort empfangen wurde.",
|
||||
"timeout": "Der Server hat nicht rechtzeitig geantwortet (Zeitüberschreitung der Anfrage).",
|
||||
"tls": "TLS- oder SSL-Handshake fehlgeschlagen (Zertifikats- oder Verschlüsselungsproblem).",
|
||||
"unknown": "Es wurde keine HTTP-Antwort vom Ziel empfangen."
|
||||
}
|
||||
}
|
||||
},
|
||||
"components": {
|
||||
@@ -465,8 +452,7 @@
|
||||
"optionPagespeed": "PageSpeed",
|
||||
"optionHardware": "Infrastruktur",
|
||||
"optionGrpc": "gRPC",
|
||||
"optionWebSocket": "WebSocket",
|
||||
"optionDns": "DNS"
|
||||
"optionWebSocket": "WebSocket"
|
||||
},
|
||||
"bulkPause": {
|
||||
"paused_one": "{{count}} Monitor pausiert",
|
||||
@@ -476,8 +462,7 @@
|
||||
"alreadyPaused_one": "Der ausgewählte Monitor ist bereits pausiert",
|
||||
"alreadyPaused_other": "Alle ausgewählten Monitore sind bereits pausiert",
|
||||
"alreadyRunning_one": "Der ausgewählte Monitor wird bereits ausgeführt",
|
||||
"alreadyRunning_other": "Alle ausgewählten Monitore werden bereits ausgeführt",
|
||||
"partialFailure": "{{successCount}} Monitore aktualisiert, aber {{failedCount}} konnten nicht mit der Job-Warteschlange synchronisiert werden"
|
||||
"alreadyRunning_other": "Alle ausgewählten Monitore werden bereits ausgeführt"
|
||||
}
|
||||
}
|
||||
},
|
||||
@@ -567,26 +552,6 @@
|
||||
"captureUrl": {
|
||||
"label": "Capture-Endpunkt",
|
||||
"placeholder": "http://192.168.1.10:5001/api/v1/metrics"
|
||||
},
|
||||
"dnsRecordType": {
|
||||
"label": "DNS-Eintragstyp",
|
||||
"value": {
|
||||
"A": "A",
|
||||
"AAAA": "AAAA",
|
||||
"CNAME": "CNAME",
|
||||
"MX": "MX",
|
||||
"NS": "NS",
|
||||
"TXT": "TXT"
|
||||
}
|
||||
},
|
||||
"dnsServer": {
|
||||
"label": "DNS-Server",
|
||||
"placeholder": "8.8.8.8"
|
||||
},
|
||||
"strategy": {
|
||||
"desktop": "Desktop",
|
||||
"label": "Strategie",
|
||||
"mobile": "Mobil"
|
||||
}
|
||||
},
|
||||
"title": "Allgemeine Einstellungen",
|
||||
@@ -599,8 +564,7 @@
|
||||
"pagespeed": "Verfolgen Sie die Ladezeit, Core Web Vitals und Optimierungswerte Ihrer Website.",
|
||||
"grpc": "Geben Sie den Hostnamen und Port des gRPC-Servers ein, optional einen Dienstnamen für den Health-Check, und fügen Sie einen Anzeigenamen hinzu.",
|
||||
"websocket": "Geben Sie die zu überwachende WebSocket-URL ein (z. B. wss://example.com/socket) und fügen Sie einen Anzeigenamen hinzu.",
|
||||
"hardware": "Überwachen Sie CPU-, Speicher-, Festplattenauslastung und Temperatur Ihrer Infrastruktur. Die URL des Capture-Endpunkts muss den vollständigen Pfad /api/v1/metrics enthalten (z. B. http://192.168.1.10:5001/api/v1/metrics). Fügen Sie für das Autorisierungsgeheimnis nur den Token-String ein — geben Sie 'Bearer' nicht mit an.",
|
||||
"dns": "Überwachen Sie, ob ein bestimmter DNS-Server antwortet."
|
||||
"hardware": "Überwachen Sie CPU-, Speicher-, Festplattenauslastung und Temperatur Ihrer Infrastruktur. Die URL des Capture-Endpunkts muss den vollständigen Pfad /api/v1/metrics enthalten (z. B. http://192.168.1.10:5001/api/v1/metrics). Fügen Sie für das Autorisierungsgeheimnis nur den Token-String ein — geben Sie 'Bearer' nicht mit an."
|
||||
}
|
||||
},
|
||||
"ignoreTls": {
|
||||
@@ -637,8 +601,7 @@
|
||||
"optionHttpDescription": "HTTP(S) verwenden, um Ihre Website oder Ihren API-Endpunkt zu überwachen.",
|
||||
"optionPingDescription": "ICMP-Ping verwenden, um zu überwachen, ob ein Server online ist.",
|
||||
"optionPortDescription": "Überwachen, ob ein bestimmter Port auf einem Server geöffnet ist.",
|
||||
"title": "Typ",
|
||||
"optionDnsDescription": "Überwachen Sie, ob ein bestimmter DNS-Server antwortet."
|
||||
"title": "Typ"
|
||||
},
|
||||
"thresholds": {
|
||||
"title": "Alarmschwellenwerte",
|
||||
@@ -946,8 +909,7 @@
|
||||
"lastFinishedAt": "Zuletzt abgeschlossen am",
|
||||
"lastRunTook": "Letzter Lauf dauerte",
|
||||
"lastFailedAt": "Letzter Fehler am",
|
||||
"failReason": "Fehlergrund",
|
||||
"state": "Status"
|
||||
"failReason": "Fehlergrund"
|
||||
}
|
||||
},
|
||||
"queueFallback": {
|
||||
@@ -1137,10 +1099,6 @@
|
||||
"header": {
|
||||
"title": "PageSpeed-Monitore",
|
||||
"description": "Verfolgen Sie Core Web Vitals und Lighthouse-Werte im Zeitverlauf, um Regressionen zu erkennen, bevor Nutzer es tun."
|
||||
},
|
||||
"strategy": {
|
||||
"desktop": "Desktop",
|
||||
"mobile": "Mobil"
|
||||
}
|
||||
},
|
||||
"settings": {
|
||||
@@ -1289,10 +1247,6 @@
|
||||
},
|
||||
"rejectUnauthorized": {
|
||||
"label": "Ungültige Zertifikate ablehnen: Verbindungen mit selbstsignierten oder nicht vertrauenswürdigen Zertifikaten ablehnen"
|
||||
},
|
||||
"displayName": {
|
||||
"label": "Absendername (optional) - Anzeigename im Absenderfeld",
|
||||
"placeholder": "Checkmate-Benachrichtigungen"
|
||||
}
|
||||
}
|
||||
},
|
||||
@@ -1353,20 +1307,6 @@
|
||||
"uptime": {
|
||||
"title": "Verfügbarkeit",
|
||||
"responseTime": "Antwortzeit"
|
||||
},
|
||||
"chart": {
|
||||
"avg": "Ø {{value}}ms",
|
||||
"downTooltip": "Ausgefallen",
|
||||
"heatmapAria": "Heatmap der Antwortzeit",
|
||||
"max": "max. {{value}}ms"
|
||||
},
|
||||
"status": {
|
||||
"breached": "Schwellenwert überschritten",
|
||||
"down": "Ausgefallen",
|
||||
"initializing": "Initialisierung",
|
||||
"maintenance": "Wartung",
|
||||
"paused": "Pausiert",
|
||||
"up": "Betriebsbereit"
|
||||
}
|
||||
},
|
||||
"statusBar": {
|
||||
@@ -1384,9 +1324,7 @@
|
||||
"maintenance": "Einige Systeme befinden sich in Wartung",
|
||||
"partiallyPaused": "Einige Systeme sind pausiert",
|
||||
"initializing": "Einige Systeme werden initialisiert",
|
||||
"noMonitors": "Es wurden keine Monitore konfiguriert",
|
||||
"monitoringSummary": "Überwachung von {{count}} Dienst · Aktualisierung alle 10 Sekunden",
|
||||
"monitoringSummary_other": "Überwachung von {{count}} Diensten · Aktualisierung alle 10 Sekunden"
|
||||
"noMonitors": "Es wurden keine Monitore konfiguriert"
|
||||
},
|
||||
"table": {
|
||||
"headers": {
|
||||
@@ -1477,47 +1415,11 @@
|
||||
"label": "Infrastruktur-Metriken anzeigen"
|
||||
}
|
||||
}
|
||||
},
|
||||
"theme": {
|
||||
"description": "Wählen Sie den visuellen Stil für Ihre öffentliche Statusseite.",
|
||||
"label": "Theme",
|
||||
"options": {
|
||||
"bold": {
|
||||
"description": "Große Schrift und großzügige Abstände. Ideal für markenorientierte Seiten.",
|
||||
"name": "Fett"
|
||||
},
|
||||
"editorial": {
|
||||
"description": "Serifenüberschriften und feine Trennlinien. Markant und ruhig.",
|
||||
"name": "Redaktionell"
|
||||
},
|
||||
"modern": {
|
||||
"description": "SaaS-Niveau mit pulsierendem Statuspunkt und sanft verblassenden Karten.",
|
||||
"name": "Modern"
|
||||
},
|
||||
"refined": {
|
||||
"description": "Sauber, professionell, nah am klassischen Checkmate-Look.",
|
||||
"name": "Verfeinert"
|
||||
}
|
||||
},
|
||||
"title": "Seiten-Theme"
|
||||
},
|
||||
"themeMode": {
|
||||
"auto": "Automatisch (Gerät des Besuchers folgen)",
|
||||
"dark": "Nur dunkel",
|
||||
"label": "Theme-Modus",
|
||||
"light": "Nur hell"
|
||||
}
|
||||
},
|
||||
"header": {
|
||||
"title": "Statusseiten",
|
||||
"description": "Veröffentlichen Sie öffentliche Seiten, die Kunden und Stakeholdern Echtzeit-Verfügbarkeit und Vorfallsverlauf zeigen."
|
||||
},
|
||||
"editorial": {
|
||||
"allUp": "Alle Systeme funktionieren normal.",
|
||||
"reportTitle": "Servicebericht"
|
||||
},
|
||||
"footer": {
|
||||
"poweredBy": "Bereitgestellt von"
|
||||
}
|
||||
},
|
||||
"uptime": {
|
||||
|
||||
+19
-95
@@ -30,6 +30,7 @@
|
||||
"home": "Home"
|
||||
},
|
||||
"buttons": {
|
||||
"selected": "selected",
|
||||
"addMember": "Add member",
|
||||
"cancel": "Cancel",
|
||||
"close": "Close",
|
||||
@@ -43,8 +44,6 @@
|
||||
"pause": "Pause",
|
||||
"resume": "Resume",
|
||||
"save": "Save",
|
||||
"next": "Next",
|
||||
"back": "Back",
|
||||
"sendInvite": "Send invite",
|
||||
"test": "Test",
|
||||
"testNotifications": "Test notifications",
|
||||
@@ -133,8 +132,7 @@
|
||||
"url": "Url",
|
||||
"interval": "Interval",
|
||||
"active": "Active",
|
||||
"responseTime": "Response time",
|
||||
"tags": "Tags"
|
||||
"responseTime": "Response time"
|
||||
}
|
||||
}
|
||||
},
|
||||
@@ -187,7 +185,6 @@
|
||||
"pagespeed": "Pagespeed",
|
||||
"infrastructure": "Infrastructure",
|
||||
"notifications": "Notifications",
|
||||
"tags": "Tags",
|
||||
"checks": "Checks",
|
||||
"incidents": "Incidents",
|
||||
"statusPages": "Status pages",
|
||||
@@ -429,6 +426,20 @@
|
||||
},
|
||||
"common": {
|
||||
"monitors": {
|
||||
"bulkEdit": {
|
||||
"selectAll": "Select All",
|
||||
"editButton": "Edit Notifications",
|
||||
"title": "Edit Notifications",
|
||||
"selectedText": "You are applying changes to {{count}} monitor(s).",
|
||||
"actionAdd": "Add",
|
||||
"actionAddDesc": "Adds the selected notifications to these monitors without removing existing ones.",
|
||||
"actionRemove": "Remove",
|
||||
"actionRemoveDesc": "Removes exclusively the selected notifications from these monitors.",
|
||||
"actionSet": "Replace all",
|
||||
"actionSetDesc": "Replaces all existing notifications. Leave empty to clear all notifications.",
|
||||
"selectLabel": "Notification Channels",
|
||||
"selectPlaceholder": "Select channels..."
|
||||
},
|
||||
"actions": {
|
||||
"configure": "Configure",
|
||||
"delete": "Delete",
|
||||
@@ -452,8 +463,7 @@
|
||||
"paused_one": "{{count}} monitor paused",
|
||||
"paused_other": "{{count}} monitors paused",
|
||||
"resumed_one": "{{count}} monitor resumed",
|
||||
"resumed_other": "{{count}} monitors resumed",
|
||||
"partialFailure": "{{successCount}} monitors updated, but {{failedCount}} failed to sync with the job queue"
|
||||
"resumed_other": "{{count}} monitors resumed"
|
||||
},
|
||||
"statBoxes": {
|
||||
"activeFor": "Active for",
|
||||
@@ -632,10 +642,6 @@
|
||||
"description": "Select the notification channels you want to use",
|
||||
"title": "Notifications"
|
||||
},
|
||||
"tags": {
|
||||
"description": "Select the tags you want to apply to this monitor",
|
||||
"title": "Tags"
|
||||
},
|
||||
"type": {
|
||||
"description": "Select the type of check to perform",
|
||||
"optionDockerDescription": "Use Docker to monitor if a container is running.",
|
||||
@@ -885,37 +891,6 @@
|
||||
"description": "Track server performance, identify bottlenecks, and ensure reliability with real-time infrastructure monitoring."
|
||||
}
|
||||
},
|
||||
"tags": {
|
||||
"header": {
|
||||
"title": "Tags",
|
||||
"description": "Organize your monitors with tags"
|
||||
},
|
||||
"fallback": {
|
||||
"title": "No tags yet",
|
||||
"description": "Organize your monitors with tags. Once you create a tag and assign it to a monitor, you'll be able to filter by that tag across the app and see tag details here.",
|
||||
"actionButton": "Create a tag"
|
||||
},
|
||||
"table": {
|
||||
"headers": {
|
||||
"color": "Color",
|
||||
"appearance": "Appearance"
|
||||
}
|
||||
},
|
||||
"form": {
|
||||
"name": {
|
||||
"title": "Tag name",
|
||||
"description": "Choose a name for your tag",
|
||||
"optionName": "Tag name",
|
||||
"placeholder": "e.g. Group 1"
|
||||
},
|
||||
"color": {
|
||||
"title": "Tag color",
|
||||
"description": "Choose a color for your tag",
|
||||
"optionName": "Tag color",
|
||||
"placeholder": "e.g. #13715B"
|
||||
}
|
||||
}
|
||||
},
|
||||
"logs": {
|
||||
"fallback": {
|
||||
"title": "No logs yet",
|
||||
@@ -933,8 +908,6 @@
|
||||
"logLevelSelect": {
|
||||
"label": "Log level"
|
||||
},
|
||||
"workers": "Workers",
|
||||
"workersExplainers": "Shows worker processes. Worker IDs are truncated, hover for full ID",
|
||||
"jobQueue": "Job queue",
|
||||
"jobQueueExplainer": "<highlight>Highlighted rows</highlight> are jobs currently being processed by a worker.",
|
||||
"failedJobs": "Failed jobs",
|
||||
@@ -956,14 +929,6 @@
|
||||
"memoryCpu": {
|
||||
"title": "Memory & CPU",
|
||||
"description": "How the process is using its allocated memory and host CPU."
|
||||
},
|
||||
"mongoDBStats": {
|
||||
"title": "MongoDB stats",
|
||||
"description": "Snapshot of MongoDB metrics"
|
||||
},
|
||||
"mongoDBCollectionStats": {
|
||||
"title": "MongoDB collection stats",
|
||||
"description": "Stats for MongoDB collections"
|
||||
}
|
||||
},
|
||||
"stats": {
|
||||
@@ -973,26 +938,6 @@
|
||||
"totalHeapSize": "Total heap size",
|
||||
"osMemoryLimit": "OS memory limit"
|
||||
},
|
||||
"mongoDBStats": {
|
||||
"readyState": "Ready state",
|
||||
"readsPerSecond": "Reads/s",
|
||||
"insertsPerSecond": "Inserts/s",
|
||||
"updatesPerSecond": "Updates/s",
|
||||
"deletesPerSecond": "Deletes/s",
|
||||
"writesPerSecond": "Total writes/s",
|
||||
"host": "Host",
|
||||
"port": "Port",
|
||||
"dbName": "Database name",
|
||||
"storageSize": "Storage size"
|
||||
},
|
||||
"mongoDBCollectionStats": {
|
||||
"documents": "Documents: {{count}}",
|
||||
"bucketCount": "Bucket count: {{count}}",
|
||||
"storageSize": "Storage size: {{size}}",
|
||||
"indexSize": "Index size: {{size}}",
|
||||
"totalSize": "Total size: {{size}}",
|
||||
"dbUsageTooltip": "{{percentage}}% of DB storage"
|
||||
},
|
||||
"gauges": {
|
||||
"heapAllocation": "Heap allocation",
|
||||
"heapUsage": "Heap usage",
|
||||
@@ -1007,11 +952,6 @@
|
||||
},
|
||||
"table": {
|
||||
"headers": {
|
||||
"host": "Host",
|
||||
"processId": "Process ID",
|
||||
"workerId": "Worker ID",
|
||||
"workerMode": "Worker mode",
|
||||
"lastSeenAt": "Last seen at",
|
||||
"state": "State",
|
||||
"timestamp": "Timestamp",
|
||||
"level": "Level",
|
||||
@@ -1022,7 +962,6 @@
|
||||
"failCount": "Count",
|
||||
"lastRunAt": "Last run at",
|
||||
"lockedAt": "Locked at",
|
||||
"lockedBy": "Locked by",
|
||||
"lastFinishedAt": "Last finished at",
|
||||
"lastRunTook": "Last run took",
|
||||
"lastFailedAt": "Last failed",
|
||||
@@ -1170,14 +1109,6 @@
|
||||
"placeholderFromNumber": "+15551234567",
|
||||
"optionToNumber": "To number (recipient)",
|
||||
"placeholderToNumber": "+15559876543"
|
||||
},
|
||||
"ntfy": {
|
||||
"title": "ntfy configuration",
|
||||
"description": "Configure an ntfy server and topic for push notifications.",
|
||||
"optionServerUrl": "Server URL",
|
||||
"placeholderServerUrl": "https://ntfy.sh",
|
||||
"optionTopic": "Topic",
|
||||
"placeholderTopic": "checkmate-alerts"
|
||||
}
|
||||
},
|
||||
"table": {
|
||||
@@ -1514,11 +1445,6 @@
|
||||
"url": {
|
||||
"label": "Your status page address",
|
||||
"placeholder": "my-status-page"
|
||||
},
|
||||
"customDomain": {
|
||||
"label": "Custom domain",
|
||||
"placeholder": "status.example.com",
|
||||
"helper": "Optional. Point a DNS record to this Checkmate instance to serve the status page at your own domain."
|
||||
}
|
||||
}
|
||||
},
|
||||
@@ -1612,13 +1538,11 @@
|
||||
"filters": {
|
||||
"search": {
|
||||
"placeholder": "Search monitors..."
|
||||
},
|
||||
"activeTags": "Active tags"
|
||||
}
|
||||
},
|
||||
"table": {
|
||||
"headers": {
|
||||
"responseTime": "Response time",
|
||||
"uptime": "Uptime %"
|
||||
"responseTime": "Response time"
|
||||
}
|
||||
},
|
||||
"fallback": {
|
||||
|
||||
+21
-105
@@ -47,7 +47,14 @@
|
||||
"exportToJSON": "Exportar a JSON",
|
||||
"importFromJSON": "Importar desde JSON",
|
||||
"clearFilters": "Limpiar filtros",
|
||||
"removeUser": "Eliminar usuario"
|
||||
"removeUser": "Eliminar usuario",
|
||||
"testNotification": "Probar notificación",
|
||||
"invite": "Invitar",
|
||||
"copyLink": "Copiar enlace",
|
||||
"regenerateToken": "Regenerar token",
|
||||
"copyToken": "Copiar token",
|
||||
"exportLogs": "Exportar registros",
|
||||
"refresh": "Actualizar"
|
||||
},
|
||||
"charts": {
|
||||
"labels": {
|
||||
@@ -73,9 +80,7 @@
|
||||
"paused": "pausado",
|
||||
"na": "N/D",
|
||||
"resolved": "Resuelto",
|
||||
"responseTime": "Tiempo de respuesta",
|
||||
"idle": "Inactivo",
|
||||
"running": "En ejecución"
|
||||
"responseTime": "Tiempo de respuesta"
|
||||
},
|
||||
"form": {
|
||||
"role": {
|
||||
@@ -122,17 +127,6 @@
|
||||
"active": "Activo",
|
||||
"responseTime": "Tiempo de respuesta"
|
||||
}
|
||||
},
|
||||
"statusCode": {
|
||||
"down": "Caído",
|
||||
"networkError": {
|
||||
"dns": "No se pudo resolver el nombre de host (la búsqueda DNS falló).",
|
||||
"refused": "El servidor rechazó la conexión (puerto cerrado o servicio inactivo).",
|
||||
"reset": "La conexión se restableció antes de recibir una respuesta.",
|
||||
"timeout": "El servidor no respondió a tiempo (tiempo de espera agotado).",
|
||||
"tls": "Falló el protocolo TLS o SSL (problema de certificado o cifrado).",
|
||||
"unknown": "No se recibió ninguna respuesta HTTP del destino."
|
||||
}
|
||||
}
|
||||
},
|
||||
"components": {
|
||||
@@ -465,8 +459,7 @@
|
||||
"optionPagespeed": "PageSpeed",
|
||||
"optionHardware": "Infraestructura",
|
||||
"optionGrpc": "gRPC",
|
||||
"optionWebSocket": "WebSocket",
|
||||
"optionDns": "DNS"
|
||||
"optionWebSocket": "WebSocket"
|
||||
},
|
||||
"bulkPause": {
|
||||
"paused_one": "{{count}} monitor pausado",
|
||||
@@ -476,8 +469,7 @@
|
||||
"alreadyPaused_one": "El monitor seleccionado ya está pausado",
|
||||
"alreadyPaused_other": "Todos los monitores seleccionados ya están pausados",
|
||||
"alreadyRunning_one": "El monitor seleccionado ya se está ejecutando",
|
||||
"alreadyRunning_other": "Todos los monitores seleccionados ya se están ejecutando",
|
||||
"partialFailure": "Se actualizaron {{successCount}} monitores, pero {{failedCount}} fallaron al sincronizarse con la cola de trabajos"
|
||||
"alreadyRunning_other": "Todos los monitores seleccionados ya se están ejecutando"
|
||||
}
|
||||
}
|
||||
},
|
||||
@@ -567,26 +559,6 @@
|
||||
"captureUrl": {
|
||||
"label": "Endpoint de Capture",
|
||||
"placeholder": "http://192.168.1.10:5001/api/v1/metrics"
|
||||
},
|
||||
"dnsRecordType": {
|
||||
"label": "Tipo de registro DNS",
|
||||
"value": {
|
||||
"A": "A",
|
||||
"AAAA": "AAAA",
|
||||
"CNAME": "CNAME",
|
||||
"MX": "MX",
|
||||
"NS": "NS",
|
||||
"TXT": "TXT"
|
||||
}
|
||||
},
|
||||
"dnsServer": {
|
||||
"label": "Servidor DNS",
|
||||
"placeholder": "8.8.8.8"
|
||||
},
|
||||
"strategy": {
|
||||
"desktop": "Escritorio",
|
||||
"label": "Estrategia",
|
||||
"mobile": "Móvil"
|
||||
}
|
||||
},
|
||||
"title": "Configuración general",
|
||||
@@ -599,8 +571,7 @@
|
||||
"pagespeed": "Rastree el rendimiento de carga de página, Core Web Vitals y puntuaciones de optimización de su sitio web.",
|
||||
"grpc": "Ingrese el nombre de host y puerto del servidor gRPC, opcionalmente especifique un nombre de servicio para la verificación de salud, y agregue un nombre para mostrar.",
|
||||
"websocket": "Ingrese la URL de WebSocket a monitorear (p. ej., wss://example.com/socket) y agregue un nombre para mostrar.",
|
||||
"hardware": "Supervisa el uso de CPU, memoria, disco y temperatura de tu infraestructura. La URL del endpoint de Capture debe incluir la ruta completa /api/v1/metrics (p. ej., http://192.168.1.10:5001/api/v1/metrics). Para el secreto de autorización, pega solo la cadena del token — no incluyas 'Bearer'.",
|
||||
"dns": "Monitorea si un servidor DNS específico responde."
|
||||
"hardware": "Supervisa el uso de CPU, memoria, disco y temperatura de tu infraestructura. La URL del endpoint de Capture debe incluir la ruta completa /api/v1/metrics (p. ej., http://192.168.1.10:5001/api/v1/metrics). Para el secreto de autorización, pega solo la cadena del token — no incluyas 'Bearer'."
|
||||
}
|
||||
},
|
||||
"ignoreTls": {
|
||||
@@ -637,8 +608,7 @@
|
||||
"optionHttpDescription": "Use HTTP(S) para monitorear su sitio web o endpoint de API.",
|
||||
"optionPingDescription": "Use ICMP Ping para monitorear si un servidor está en línea.",
|
||||
"optionPortDescription": "Monitoree si un puerto específico de un servidor está abierto.",
|
||||
"title": "Tipo",
|
||||
"optionDnsDescription": "Monitorea si un servidor DNS específico responde."
|
||||
"title": "Tipo"
|
||||
},
|
||||
"thresholds": {
|
||||
"title": "Umbrales de alerta",
|
||||
@@ -946,8 +916,7 @@
|
||||
"lastFinishedAt": "Última finalización",
|
||||
"lastRunTook": "Última ejecución tomó",
|
||||
"lastFailedAt": "Última falla",
|
||||
"failReason": "Razón de falla",
|
||||
"state": "Estado"
|
||||
"failReason": "Razón de falla"
|
||||
}
|
||||
},
|
||||
"queueFallback": {
|
||||
@@ -1137,10 +1106,6 @@
|
||||
"header": {
|
||||
"title": "Monitores de PageSpeed",
|
||||
"description": "Sigue las Core Web Vitals y las puntuaciones de Lighthouse a lo largo del tiempo para detectar regresiones antes que tus usuarios."
|
||||
},
|
||||
"strategy": {
|
||||
"desktop": "Escritorio",
|
||||
"mobile": "Móvil"
|
||||
}
|
||||
},
|
||||
"settings": {
|
||||
@@ -1289,10 +1254,6 @@
|
||||
},
|
||||
"rejectUnauthorized": {
|
||||
"label": "Rechazar certificados inválidos: Rechazar conexiones con certificados autofirmados o no confiables"
|
||||
},
|
||||
"displayName": {
|
||||
"label": "Nombre del remitente (opcional) - Nombre amigable mostrado en el campo De",
|
||||
"placeholder": "Notificaciones de Checkmate"
|
||||
}
|
||||
}
|
||||
},
|
||||
@@ -1353,20 +1314,6 @@
|
||||
"uptime": {
|
||||
"title": "Tiempo de actividad",
|
||||
"responseTime": "Tiempo de respuesta"
|
||||
},
|
||||
"chart": {
|
||||
"avg": "prom {{value}}ms",
|
||||
"downTooltip": "Caído",
|
||||
"heatmapAria": "Mapa de calor del tiempo de respuesta",
|
||||
"max": "máx {{value}}ms"
|
||||
},
|
||||
"status": {
|
||||
"breached": "Umbral superado",
|
||||
"down": "Caído",
|
||||
"initializing": "Inicializando",
|
||||
"maintenance": "Mantenimiento",
|
||||
"paused": "Pausado",
|
||||
"up": "Operativo"
|
||||
}
|
||||
},
|
||||
"statusBar": {
|
||||
@@ -1384,9 +1331,7 @@
|
||||
"maintenance": "Algunos sistemas están en mantenimiento",
|
||||
"partiallyPaused": "Algunos sistemas están en pausa",
|
||||
"initializing": "Algunos sistemas se están inicializando",
|
||||
"noMonitors": "No se ha configurado ningún monitor",
|
||||
"monitoringSummary": "Monitoreando {{count}} servicio · Actualizaciones cada 10 segundos",
|
||||
"monitoringSummary_other": "Monitoreando {{count}} servicios · Actualizaciones cada 10 segundos"
|
||||
"noMonitors": "No se ha configurado ningún monitor"
|
||||
},
|
||||
"table": {
|
||||
"headers": {
|
||||
@@ -1477,47 +1422,18 @@
|
||||
"label": "Mostrar métricas de infraestructura"
|
||||
}
|
||||
}
|
||||
},
|
||||
"theme": {
|
||||
"description": "Elige el estilo visual para tu página de estado pública.",
|
||||
"label": "Tema",
|
||||
"options": {
|
||||
"bold": {
|
||||
"description": "Tipografía grande y espaciado confiado. Ideal para páginas centradas en la marca.",
|
||||
"name": "Audaz"
|
||||
},
|
||||
"editorial": {
|
||||
"description": "Encabezados con serifa y divisores finos. Distintivo y tranquilo.",
|
||||
"name": "Editorial"
|
||||
},
|
||||
"modern": {
|
||||
"description": "Calidad SaaS con un punto de estado pulsante y tarjetas que se desvanecen suavemente.",
|
||||
"name": "Moderno"
|
||||
},
|
||||
"refined": {
|
||||
"description": "Limpio, profesional, cercano al aspecto clásico de Checkmate.",
|
||||
"name": "Refinado"
|
||||
}
|
||||
},
|
||||
"title": "Tema de la página"
|
||||
},
|
||||
"themeMode": {
|
||||
"auto": "Automático (seguir dispositivo del visitante)",
|
||||
"dark": "Solo oscuro",
|
||||
"label": "Modo de tema",
|
||||
"light": "Solo claro"
|
||||
}
|
||||
},
|
||||
"header": {
|
||||
"title": "Páginas de estado",
|
||||
"description": "Publica páginas públicas que muestren a tus clientes y partes interesadas la disponibilidad en tiempo real y el historial de incidentes."
|
||||
},
|
||||
"editorial": {
|
||||
"allUp": "Todos los sistemas funcionan con normalidad.",
|
||||
"reportTitle": "Informe de servicio"
|
||||
},
|
||||
"footer": {
|
||||
"poweredBy": "Desarrollado por"
|
||||
"publicPage": {
|
||||
"maintenance": {
|
||||
"upcoming": "Mantenimiento programado",
|
||||
"inProgress": "Mantenimiento en curso",
|
||||
"completed": "Mantenimiento completado"
|
||||
}
|
||||
}
|
||||
},
|
||||
"uptime": {
|
||||
|
||||
+44
-142
@@ -73,9 +73,7 @@
|
||||
"paused": "keskeytetty",
|
||||
"na": "Ei saatavilla",
|
||||
"resolved": "Ratkaistu",
|
||||
"responseTime": "Vasteaika",
|
||||
"idle": "Toimeton",
|
||||
"running": "Käynnissä"
|
||||
"responseTime": "Vasteaika"
|
||||
},
|
||||
"form": {
|
||||
"role": {
|
||||
@@ -122,17 +120,6 @@
|
||||
"active": "Aktiivinen",
|
||||
"responseTime": "Vasteaika"
|
||||
}
|
||||
},
|
||||
"statusCode": {
|
||||
"down": "Alhaalla",
|
||||
"networkError": {
|
||||
"dns": "Isäntänimeä ei voitu selvittää (DNS-haku epäonnistui).",
|
||||
"refused": "Palvelin hylkäsi yhteyden (portti suljettu tai palvelu ei kuuntele).",
|
||||
"reset": "Yhteys nollattiin ennen vastauksen vastaanottamista.",
|
||||
"timeout": "Palvelin ei vastannut ajoissa (pyynnön aikakatkaisu).",
|
||||
"tls": "TLS- tai SSL-kättely epäonnistui (sertifikaatti- tai salausongelma).",
|
||||
"unknown": "Kohteesta ei vastaanotettu HTTP-vastausta."
|
||||
}
|
||||
}
|
||||
},
|
||||
"components": {
|
||||
@@ -319,28 +306,28 @@
|
||||
"common": {
|
||||
"passwordRules": {
|
||||
"length": {
|
||||
"beginning": "Vähintään",
|
||||
"highlighted": "8 merkkiä pitkä"
|
||||
"beginning": "",
|
||||
"highlighted": ""
|
||||
},
|
||||
"lowercase": {
|
||||
"beginning": "Sisällettävä vähintään",
|
||||
"highlighted": "yksi pieni kirjain"
|
||||
"beginning": "",
|
||||
"highlighted": ""
|
||||
},
|
||||
"match": {
|
||||
"beginning": "Salasanat",
|
||||
"highlighted": "täytyy täsmätä"
|
||||
"beginning": "",
|
||||
"highlighted": ""
|
||||
},
|
||||
"number": {
|
||||
"beginning": "Sisällettävä vähintään",
|
||||
"highlighted": "yksi numero"
|
||||
"beginning": "",
|
||||
"highlighted": ""
|
||||
},
|
||||
"special": {
|
||||
"beginning": "Sisällettävä vähintään",
|
||||
"highlighted": "yksi erikoismerkki (!?@#$%^&*()-_=+[]{}|;:'\",./\\~`)"
|
||||
"beginning": "",
|
||||
"highlighted": ""
|
||||
},
|
||||
"uppercase": {
|
||||
"beginning": "Sisällettävä vähintään",
|
||||
"highlighted": "yksi iso kirjain"
|
||||
"beginning": "",
|
||||
"highlighted": ""
|
||||
}
|
||||
},
|
||||
"form": {
|
||||
@@ -465,8 +452,7 @@
|
||||
"optionPagespeed": "PageSpeed",
|
||||
"optionHardware": "Infrastruktuuri",
|
||||
"optionGrpc": "gRPC",
|
||||
"optionWebSocket": "WebSocket",
|
||||
"optionDns": "DNS"
|
||||
"optionWebSocket": "WebSocket"
|
||||
},
|
||||
"bulkPause": {
|
||||
"paused_one": "{{count}} näyttö keskeytetty",
|
||||
@@ -476,8 +462,7 @@
|
||||
"alreadyPaused_one": "Valittu näyttö on jo keskeytetty",
|
||||
"alreadyPaused_other": "Kaikki valitut näytöt on jo keskeytetty",
|
||||
"alreadyRunning_one": "Valittu näyttö on jo käynnissä",
|
||||
"alreadyRunning_other": "Kaikki valitut näytöt ovat jo käynnissä",
|
||||
"partialFailure": "{{successCount}} monitoria päivitettiin, mutta {{failedCount}} epäonnistui synkronoinnissa työjonon kanssa"
|
||||
"alreadyRunning_other": "Kaikki valitut näytöt ovat jo käynnissä"
|
||||
}
|
||||
}
|
||||
},
|
||||
@@ -498,9 +483,9 @@
|
||||
},
|
||||
"matchMethod": {
|
||||
"label": "Vertailutapa",
|
||||
"equal": "Yhtä suuri",
|
||||
"include": "Sisältää",
|
||||
"regex": "Säännöllinen lauseke"
|
||||
"equal": "",
|
||||
"include": "",
|
||||
"regex": ""
|
||||
}
|
||||
},
|
||||
"title": "Lisäasetukset"
|
||||
@@ -512,15 +497,15 @@
|
||||
"label": "Tarkistusväli",
|
||||
"value": {
|
||||
"fifteenMinutes": "15 minuuttia",
|
||||
"fifteenSeconds": "15 sekuntia",
|
||||
"fifteenSeconds": "",
|
||||
"fiveMinutes": "5 minuuttia",
|
||||
"fourMinutes": "4 minuuttia",
|
||||
"oneMinute": "1 minuutti",
|
||||
"fourMinutes": "",
|
||||
"oneMinute": "",
|
||||
"tenMinutes": "10 minuuttia",
|
||||
"thirtyMinutes": "30 minuuttia",
|
||||
"thirtySeconds": "30 sekuntia",
|
||||
"threeMinutes": "3 minuuttia",
|
||||
"twoMinutes": "2 minuuttia"
|
||||
"thirtySeconds": "",
|
||||
"threeMinutes": "",
|
||||
"twoMinutes": ""
|
||||
}
|
||||
}
|
||||
},
|
||||
@@ -549,8 +534,8 @@
|
||||
"placeholder": "https://www.google.com"
|
||||
},
|
||||
"game": {
|
||||
"label": "Valitse peli",
|
||||
"placeholder": "Valitse peli"
|
||||
"label": "",
|
||||
"placeholder": ""
|
||||
},
|
||||
"port": {
|
||||
"label": "Monitoroitava portti",
|
||||
@@ -567,40 +552,19 @@
|
||||
"captureUrl": {
|
||||
"label": "Capture-päätepiste",
|
||||
"placeholder": "http://192.168.1.10:5001/api/v1/metrics"
|
||||
},
|
||||
"dnsRecordType": {
|
||||
"label": "DNS-tietuetyyppi",
|
||||
"value": {
|
||||
"A": "A",
|
||||
"AAAA": "AAAA",
|
||||
"CNAME": "CNAME",
|
||||
"MX": "MX",
|
||||
"NS": "NS",
|
||||
"TXT": "TXT"
|
||||
}
|
||||
},
|
||||
"dnsServer": {
|
||||
"label": "DNS-palvelin",
|
||||
"placeholder": "8.8.8.8"
|
||||
},
|
||||
"strategy": {
|
||||
"desktop": "Työpöytä",
|
||||
"label": "Strategia",
|
||||
"mobile": "Mobiili"
|
||||
}
|
||||
},
|
||||
"title": "Yleiset asetukset",
|
||||
"description": {
|
||||
"http": "Syötä monitoroitava URL tai IP (esim. https://example.com/ tai 192.168.1.100) ja lisää selkeä näyttönimi, joka näkyy hallintapaneelissa.",
|
||||
"ping": "Anna pingattava IP-osoite tai isäntänimi (esim. 192.168.1.100 tai example.com) ja lisää selkeä näyttönimi, joka näkyy hallintapaneelissa.",
|
||||
"port": "Anna palvelimen URL tai IP, portin numero ja selkeä näyttönimi, joka näkyy hallintapaneelissa.",
|
||||
"docker": "Anna Docker-kontin nimi tai tunnus. Voit käyttää joko kontin nimeä (esim. my-app) tai kontin tunnusta (täysi 64-merkkinen tunnus tai lyhyt tunnus).",
|
||||
"ping": "",
|
||||
"port": "",
|
||||
"docker": "",
|
||||
"game": "Anna IP-osoite tai isäntänimi ja portin numero pingausta varten (esim. 192.168.1.100 tai example.com) ja valitse pelityyppi. Jotkin pelit vaativat palvelinkyselyiden käyttöönoton asetustiedostossaan — tarkista pelipalvelimesi dokumentaatio. Katso protokollatiedot <gamedigLink>tuettujen pelien luettelosta</gamedigLink>.",
|
||||
"pagespeed": "Seuraa sivun latausnopeutta, Core Web Vitals -arvoja ja optimointipisteitä verkkosivustollasi.",
|
||||
"grpc": "Syötä gRPC-palvelimen isäntänimi ja portti, määritä halutessasi palvelun nimi terveystarkistusta varten ja lisää näyttönimi.",
|
||||
"websocket": "Syötä monitoroitava WebSocket URL (esim. wss://example.com/socket) ja lisää näyttönimi.",
|
||||
"hardware": "Seuraa infrastruktuurisi suorittimen, muistin, levyn käyttöä ja lämpötilaa. Capture-päätepisteen URL-osoitteen on sisällettävä koko polku /api/v1/metrics (esim. http://192.168.1.10:5001/api/v1/metrics). Liitä valtuutusavaimeen vain tokenin merkkijono — älä sisällytä sanaa 'Bearer'.",
|
||||
"dns": "Tarkkaile, vastaako tietty DNS-palvelin."
|
||||
"hardware": "Seuraa infrastruktuurisi suorittimen, muistin, levyn käyttöä ja lämpötilaa. Capture-päätepisteen URL-osoitteen on sisällettävä koko polku /api/v1/metrics (esim. http://192.168.1.10:5001/api/v1/metrics). Liitä valtuutusavaimeen vain tokenin merkkijono — älä sisällytä sanaa 'Bearer'."
|
||||
}
|
||||
},
|
||||
"ignoreTls": {
|
||||
@@ -637,8 +601,7 @@
|
||||
"optionHttpDescription": "Käytä HTTP(S)-protokollaa verkkosivustosi tai API-päätepisteen monitorointiin.",
|
||||
"optionPingDescription": "Käytä ICMP Ping -komentoa monitoroimaan, onko palvelin verkossa.",
|
||||
"optionPortDescription": "Monitoroi, onko tietty palvelimen portti auki.",
|
||||
"title": "Tyyppi",
|
||||
"optionDnsDescription": "Tarkkaile, vastaako tietty DNS-palvelin."
|
||||
"title": "Tyyppi"
|
||||
},
|
||||
"thresholds": {
|
||||
"title": "Hälytysrajat",
|
||||
@@ -802,7 +765,7 @@
|
||||
"headers": {
|
||||
"endTime": "Päättymisaika",
|
||||
"resolutionType": "Ratkaisun tyyppi",
|
||||
"startTime": "Aloitusaika",
|
||||
"startTime": "",
|
||||
"statusCode": "Tilakoodi"
|
||||
},
|
||||
"resolvedIncidents": "Ratkaistut häiriöt",
|
||||
@@ -846,13 +809,13 @@
|
||||
}
|
||||
},
|
||||
"statBoxes": {
|
||||
"avgCpuTemperature": "Keskimääräinen CPU-lämpötila",
|
||||
"cpuFrequency": "CPU-taajuus",
|
||||
"cpuLogical": "CPU (looginen)",
|
||||
"cpuPhysical": "CPU (fyysinen)",
|
||||
"avgCpuTemperature": "",
|
||||
"cpuFrequency": "",
|
||||
"cpuLogical": "",
|
||||
"cpuPhysical": "",
|
||||
"disk": "Levy",
|
||||
"memory": "Muisti",
|
||||
"os": "Käyttöjärjestelmä"
|
||||
"os": ""
|
||||
},
|
||||
"table": {
|
||||
"headers": {
|
||||
@@ -863,7 +826,7 @@
|
||||
},
|
||||
"tabs": {
|
||||
"labels": {
|
||||
"network": "Verkko",
|
||||
"network": "",
|
||||
"overview": "Yleiskatsaus"
|
||||
}
|
||||
},
|
||||
@@ -946,8 +909,7 @@
|
||||
"lastFinishedAt": "Viimeisin valmistuminen",
|
||||
"lastRunTook": "Viimeisin suoritus kesti",
|
||||
"lastFailedAt": "Viimeisin epäonnistuminen",
|
||||
"failReason": "Epäonnistumisen syy",
|
||||
"state": "Tila"
|
||||
"failReason": "Epäonnistumisen syy"
|
||||
}
|
||||
},
|
||||
"queueFallback": {
|
||||
@@ -967,8 +929,8 @@
|
||||
},
|
||||
"table": {
|
||||
"headers": {
|
||||
"nextWindow": "Seuraava ikkuna",
|
||||
"repeat": "Toista"
|
||||
"nextWindow": "",
|
||||
"repeat": ""
|
||||
}
|
||||
},
|
||||
"form": {
|
||||
@@ -1070,7 +1032,7 @@
|
||||
},
|
||||
"telegram": {
|
||||
"title": "Telegram-määritykset",
|
||||
"description": "Määritä Telegram-bottisi lähettämään ilmoituksia.",
|
||||
"description": "",
|
||||
"optionBotToken": "Bottitunniste",
|
||||
"placeholderBotToken": "123456789:ABCdefGhIJKlmNoPQRsTUVwxyZ",
|
||||
"optionChatId": "Chat-tunnus",
|
||||
@@ -1137,10 +1099,6 @@
|
||||
"header": {
|
||||
"title": "PageSpeed-monitorit",
|
||||
"description": "Seuraa Core Web Vitals -mittareita ja Lighthouse-pisteitä ajan mittaan ja huomaa heikennykset ennen käyttäjiä."
|
||||
},
|
||||
"strategy": {
|
||||
"desktop": "Työpöytä",
|
||||
"mobile": "Mobiili"
|
||||
}
|
||||
},
|
||||
"settings": {
|
||||
@@ -1243,7 +1201,7 @@
|
||||
"email": {
|
||||
"title": "Sähköpostiasetukset",
|
||||
"description": "Määritä järjestelmäsi sähköpostiasetukset. Niitä käytetään ilmoitusten ja hälytysten lähettämiseen.",
|
||||
"descriptionTransport": "Tämä rakentaa SMTP-kuljetuksen NodeMailerille",
|
||||
"descriptionTransport": "",
|
||||
"descriptionTransportLink": "Katso tekniset tiedot täältä",
|
||||
"option": {
|
||||
"host": {
|
||||
@@ -1289,10 +1247,6 @@
|
||||
},
|
||||
"rejectUnauthorized": {
|
||||
"label": "Hylkää virheelliset varmenteet: Hylkää yhteydet itseallekirjoitetuilla tai ei-luotetuilla varmenteilla"
|
||||
},
|
||||
"displayName": {
|
||||
"label": "Lähettäjän nimi (valinnainen) - Lähettäjäkentässä näkyvä ystävällinen nimi",
|
||||
"placeholder": "Checkmate-ilmoitukset"
|
||||
}
|
||||
}
|
||||
},
|
||||
@@ -1353,20 +1307,6 @@
|
||||
"uptime": {
|
||||
"title": "Käytettävyys",
|
||||
"responseTime": "Vasteaika"
|
||||
},
|
||||
"chart": {
|
||||
"avg": "ka {{value}}ms",
|
||||
"downTooltip": "Alhaalla",
|
||||
"heatmapAria": "Vasteajan lämpökartta",
|
||||
"max": "max {{value}}ms"
|
||||
},
|
||||
"status": {
|
||||
"breached": "Kynnys ylittyi",
|
||||
"down": "Alhaalla",
|
||||
"initializing": "Alustetaan",
|
||||
"maintenance": "Huolto",
|
||||
"paused": "Keskeytetty",
|
||||
"up": "Toiminnassa"
|
||||
}
|
||||
},
|
||||
"statusBar": {
|
||||
@@ -1384,9 +1324,7 @@
|
||||
"maintenance": "Jotkin järjestelmät ovat huollossa",
|
||||
"partiallyPaused": "Jotkin järjestelmät on keskeytetty",
|
||||
"initializing": "Jotkin järjestelmät alustuvat",
|
||||
"noMonitors": "Yhtään monitoria ei ole määritetty",
|
||||
"monitoringSummary": "Tarkkaillaan {{count}} palvelua · Päivitykset 10 sekunnin välein",
|
||||
"monitoringSummary_other": "Tarkkaillaan {{count}} palvelua · Päivitykset 10 sekunnin välein"
|
||||
"noMonitors": "Yhtään monitoria ei ole määritetty"
|
||||
},
|
||||
"table": {
|
||||
"headers": {
|
||||
@@ -1477,47 +1415,11 @@
|
||||
"label": "Näytä infrastruktuurin mittarit"
|
||||
}
|
||||
}
|
||||
},
|
||||
"theme": {
|
||||
"description": "Valitse julkisen tilasivusi visuaalinen tyyli.",
|
||||
"label": "Teema",
|
||||
"options": {
|
||||
"bold": {
|
||||
"description": "Suuri typografia ja itsevarma välistys. Sopii brändilähtöisille sivuille.",
|
||||
"name": "Rohkea"
|
||||
},
|
||||
"editorial": {
|
||||
"description": "Antiikvaotsikot ja ohuet erottimet. Erottuva ja rauhallinen.",
|
||||
"name": "Toimituksellinen"
|
||||
},
|
||||
"modern": {
|
||||
"description": "SaaS-tasoa sykkivällä tilapisteellä ja pehmeästi haalistuvilla korteilla.",
|
||||
"name": "Moderni"
|
||||
},
|
||||
"refined": {
|
||||
"description": "Siisti, ammattimainen, lähellä klassista Checkmate-ilmettä.",
|
||||
"name": "Hienostunut"
|
||||
}
|
||||
},
|
||||
"title": "Sivun teema"
|
||||
},
|
||||
"themeMode": {
|
||||
"auto": "Automaattinen (seuraa vierailijan laitetta)",
|
||||
"dark": "Vain tumma",
|
||||
"label": "Teematila",
|
||||
"light": "Vain vaalea"
|
||||
}
|
||||
},
|
||||
"header": {
|
||||
"title": "Tilasivut",
|
||||
"description": "Julkaise julkisia sivuja, jotka näyttävät asiakkaille ja sidosryhmille reaaliaikaisen käytettävyyden ja tapaushistorian."
|
||||
},
|
||||
"editorial": {
|
||||
"allUp": "Kaikki järjestelmät toimivat normaalisti.",
|
||||
"reportTitle": "Palveluraportti"
|
||||
},
|
||||
"footer": {
|
||||
"poweredBy": "Tarjoaa"
|
||||
}
|
||||
},
|
||||
"uptime": {
|
||||
|
||||
+10
-108
@@ -73,9 +73,7 @@
|
||||
"paused": "en pause",
|
||||
"na": "N/A",
|
||||
"resolved": "Résolu",
|
||||
"responseTime": "Temps de réponse",
|
||||
"idle": "Inactif",
|
||||
"running": "En cours d'exécution"
|
||||
"responseTime": "Temps de réponse"
|
||||
},
|
||||
"form": {
|
||||
"role": {
|
||||
@@ -122,17 +120,6 @@
|
||||
"active": "Actif",
|
||||
"responseTime": "Temps de réponse"
|
||||
}
|
||||
},
|
||||
"statusCode": {
|
||||
"down": "Hors service",
|
||||
"networkError": {
|
||||
"dns": "Impossible de résoudre le nom d'hôte (échec de la recherche DNS).",
|
||||
"refused": "Le serveur a refusé la connexion (port fermé ou service non à l'écoute).",
|
||||
"reset": "La connexion a été réinitialisée avant la réception d'une réponse.",
|
||||
"timeout": "Le serveur n'a pas répondu à temps (délai d'attente dépassé).",
|
||||
"tls": "Échec de la négociation TLS ou SSL (problème de certificat ou de chiffrement).",
|
||||
"unknown": "Aucune réponse HTTP reçue de la cible."
|
||||
}
|
||||
}
|
||||
},
|
||||
"components": {
|
||||
@@ -465,8 +452,7 @@
|
||||
"optionPagespeed": "PageSpeed",
|
||||
"optionHardware": "Infrastructure",
|
||||
"optionGrpc": "gRPC",
|
||||
"optionWebSocket": "WebSocket",
|
||||
"optionDns": "DNS"
|
||||
"optionWebSocket": "WebSocket"
|
||||
},
|
||||
"bulkPause": {
|
||||
"paused_one": "{{count}} moniteur en pause",
|
||||
@@ -476,8 +462,7 @@
|
||||
"alreadyPaused_one": "Le moniteur sélectionné est déjà en pause",
|
||||
"alreadyPaused_other": "Tous les moniteurs sélectionnés sont déjà en pause",
|
||||
"alreadyRunning_one": "Le moniteur sélectionné est déjà en cours d'exécution",
|
||||
"alreadyRunning_other": "Tous les moniteurs sélectionnés sont déjà en cours d'exécution",
|
||||
"partialFailure": "{{successCount}} moniteurs mis à jour, mais {{failedCount}} n'ont pas pu se synchroniser avec la file d'attente des tâches"
|
||||
"alreadyRunning_other": "Tous les moniteurs sélectionnés sont déjà en cours d'exécution"
|
||||
}
|
||||
}
|
||||
},
|
||||
@@ -549,8 +534,8 @@
|
||||
"placeholder": "https://www.google.com"
|
||||
},
|
||||
"game": {
|
||||
"label": "Choisir un jeu",
|
||||
"placeholder": "Sélectionner un jeu"
|
||||
"label": "",
|
||||
"placeholder": ""
|
||||
},
|
||||
"port": {
|
||||
"label": "Port à surveiller",
|
||||
@@ -567,26 +552,6 @@
|
||||
"captureUrl": {
|
||||
"label": "Point de terminaison Capture",
|
||||
"placeholder": "http://192.168.1.10:5001/api/v1/metrics"
|
||||
},
|
||||
"dnsRecordType": {
|
||||
"label": "Type d'enregistrement DNS",
|
||||
"value": {
|
||||
"A": "A",
|
||||
"AAAA": "AAAA",
|
||||
"CNAME": "CNAME",
|
||||
"MX": "MX",
|
||||
"NS": "NS",
|
||||
"TXT": "TXT"
|
||||
}
|
||||
},
|
||||
"dnsServer": {
|
||||
"label": "Serveur DNS",
|
||||
"placeholder": "8.8.8.8"
|
||||
},
|
||||
"strategy": {
|
||||
"desktop": "Bureau",
|
||||
"label": "Stratégie",
|
||||
"mobile": "Mobile"
|
||||
}
|
||||
},
|
||||
"title": "Paramètres généraux",
|
||||
@@ -599,8 +564,7 @@
|
||||
"pagespeed": "Suivez les performances de chargement, les Core Web Vitals et les scores d'optimisation de votre site web.",
|
||||
"grpc": "Saisissez le nom d'hôte et le port du serveur gRPC, spécifiez éventuellement un nom de service pour le bilan de santé, et ajoutez un nom d'affichage.",
|
||||
"websocket": "Saisissez l'URL WebSocket à surveiller (ex. wss://example.com/socket) et ajoutez un nom d'affichage.",
|
||||
"hardware": "Surveillez l'utilisation du processeur, de la mémoire, du disque et la température de votre infrastructure. L'URL du point de terminaison Capture doit inclure le chemin complet /api/v1/metrics (par ex. http://192.168.1.10:5001/api/v1/metrics). Pour le secret d'autorisation, collez uniquement la chaîne du jeton — n'incluez pas 'Bearer'.",
|
||||
"dns": "Surveillez si un serveur DNS spécifique répond."
|
||||
"hardware": "Surveillez l'utilisation du processeur, de la mémoire, du disque et la température de votre infrastructure. L'URL du point de terminaison Capture doit inclure le chemin complet /api/v1/metrics (par ex. http://192.168.1.10:5001/api/v1/metrics). Pour le secret d'autorisation, collez uniquement la chaîne du jeton — n'incluez pas 'Bearer'."
|
||||
}
|
||||
},
|
||||
"ignoreTls": {
|
||||
@@ -637,8 +601,7 @@
|
||||
"optionHttpDescription": "Utilisez HTTP(S) pour surveiller votre site web ou point de terminaison API.",
|
||||
"optionPingDescription": "Utilisez le Ping ICMP pour surveiller si un serveur est en ligne.",
|
||||
"optionPortDescription": "Surveillez si un port spécifique sur un serveur est ouvert.",
|
||||
"title": "Type",
|
||||
"optionDnsDescription": "Surveillez si un serveur DNS spécifique répond."
|
||||
"title": "Type"
|
||||
},
|
||||
"thresholds": {
|
||||
"title": "Seuils d'alerte",
|
||||
@@ -863,7 +826,7 @@
|
||||
},
|
||||
"tabs": {
|
||||
"labels": {
|
||||
"network": "Réseau",
|
||||
"network": "",
|
||||
"overview": "Aperçu"
|
||||
}
|
||||
},
|
||||
@@ -946,8 +909,7 @@
|
||||
"lastFinishedAt": "Dernière fin",
|
||||
"lastRunTook": "Durée dernière exécution",
|
||||
"lastFailedAt": "Dernier échec",
|
||||
"failReason": "Raison de l'échec",
|
||||
"state": "État"
|
||||
"failReason": "Raison de l'échec"
|
||||
}
|
||||
},
|
||||
"queueFallback": {
|
||||
@@ -1137,10 +1099,6 @@
|
||||
"header": {
|
||||
"title": "Moniteurs PageSpeed",
|
||||
"description": "Suivez les Core Web Vitals et les scores Lighthouse au fil du temps pour détecter les régressions avant vos utilisateurs."
|
||||
},
|
||||
"strategy": {
|
||||
"desktop": "Bureau",
|
||||
"mobile": "Mobile"
|
||||
}
|
||||
},
|
||||
"settings": {
|
||||
@@ -1289,10 +1247,6 @@
|
||||
},
|
||||
"rejectUnauthorized": {
|
||||
"label": "Rejeter les certificats invalides : refuser les connexions avec des certificats auto-signés ou non fiables"
|
||||
},
|
||||
"displayName": {
|
||||
"label": "Nom de l'expéditeur (facultatif) - Nom convivial affiché dans le champ De",
|
||||
"placeholder": "Notifications Checkmate"
|
||||
}
|
||||
}
|
||||
},
|
||||
@@ -1353,20 +1307,6 @@
|
||||
"uptime": {
|
||||
"title": "Disponibilité",
|
||||
"responseTime": "Temps de réponse"
|
||||
},
|
||||
"chart": {
|
||||
"avg": "moy {{value}}ms",
|
||||
"downTooltip": "Hors service",
|
||||
"heatmapAria": "Carte thermique des temps de réponse",
|
||||
"max": "max {{value}}ms"
|
||||
},
|
||||
"status": {
|
||||
"breached": "Seuil dépassé",
|
||||
"down": "Hors service",
|
||||
"initializing": "Initialisation",
|
||||
"maintenance": "Maintenance",
|
||||
"paused": "En pause",
|
||||
"up": "Opérationnel"
|
||||
}
|
||||
},
|
||||
"statusBar": {
|
||||
@@ -1384,9 +1324,7 @@
|
||||
"maintenance": "Certains systèmes sont en maintenance",
|
||||
"partiallyPaused": "Certains systèmes sont en pause",
|
||||
"initializing": "Certains systèmes sont en cours d'initialisation",
|
||||
"noMonitors": "Aucun moniteur n'a été configuré",
|
||||
"monitoringSummary": "Surveillance de {{count}} service · Mises à jour toutes les 10 secondes",
|
||||
"monitoringSummary_other": "Surveillance de {{count}} services · Mises à jour toutes les 10 secondes"
|
||||
"noMonitors": "Aucun moniteur n'a été configuré"
|
||||
},
|
||||
"table": {
|
||||
"headers": {
|
||||
@@ -1477,47 +1415,11 @@
|
||||
"label": "Afficher les métriques d'infrastructure"
|
||||
}
|
||||
}
|
||||
},
|
||||
"theme": {
|
||||
"description": "Choisissez le style visuel de votre page de statut publique.",
|
||||
"label": "Thème",
|
||||
"options": {
|
||||
"bold": {
|
||||
"description": "Grande typographie et espacement assuré. Idéal pour les pages axées sur la marque.",
|
||||
"name": "Audacieux"
|
||||
},
|
||||
"editorial": {
|
||||
"description": "Titres avec serif et séparateurs fins. Distinctif et calme.",
|
||||
"name": "Éditorial"
|
||||
},
|
||||
"modern": {
|
||||
"description": "Qualité SaaS avec un point de statut pulsant et des cartes qui s'estompent doucement.",
|
||||
"name": "Moderne"
|
||||
},
|
||||
"refined": {
|
||||
"description": "Propre, professionnel, proche du look classique de Checkmate.",
|
||||
"name": "Raffiné"
|
||||
}
|
||||
},
|
||||
"title": "Thème de la page"
|
||||
},
|
||||
"themeMode": {
|
||||
"auto": "Automatique (selon l'appareil du visiteur)",
|
||||
"dark": "Sombre uniquement",
|
||||
"label": "Mode de thème",
|
||||
"light": "Clair uniquement"
|
||||
}
|
||||
},
|
||||
"header": {
|
||||
"title": "Pages de statut",
|
||||
"description": "Publiez des pages publiques montrant à vos clients et parties prenantes la disponibilité en temps réel et l'historique des incidents."
|
||||
},
|
||||
"editorial": {
|
||||
"allUp": "Tous les systèmes fonctionnent normalement.",
|
||||
"reportTitle": "Rapport de service"
|
||||
},
|
||||
"footer": {
|
||||
"poweredBy": "Propulsé par"
|
||||
}
|
||||
},
|
||||
"uptime": {
|
||||
|
||||
+18
-116
@@ -73,9 +73,7 @@
|
||||
"paused": "一時停止中",
|
||||
"na": "N/A",
|
||||
"resolved": "解決済み",
|
||||
"responseTime": "応答時間",
|
||||
"idle": "アイドル",
|
||||
"running": "実行中"
|
||||
"responseTime": "応答時間"
|
||||
},
|
||||
"form": {
|
||||
"role": {
|
||||
@@ -122,17 +120,6 @@
|
||||
"active": "アクティブ",
|
||||
"responseTime": "応答時間"
|
||||
}
|
||||
},
|
||||
"statusCode": {
|
||||
"down": "ダウン",
|
||||
"networkError": {
|
||||
"dns": "ホスト名を解決できませんでした(DNSルックアップに失敗)。",
|
||||
"refused": "サーバーが接続を拒否しました(ポートが閉じているか、サービスがリッスンしていません)。",
|
||||
"reset": "応答を受信する前に接続がリセットされました。",
|
||||
"timeout": "サーバーがタイムアウト内に応答しませんでした(リクエストタイムアウト)。",
|
||||
"tls": "TLSまたはSSLハンドシェイクに失敗しました(証明書または暗号化の問題)。",
|
||||
"unknown": "ターゲットからのHTTP応答がありませんでした。"
|
||||
}
|
||||
}
|
||||
},
|
||||
"components": {
|
||||
@@ -465,8 +452,7 @@
|
||||
"optionPagespeed": "PageSpeed",
|
||||
"optionHardware": "インフラストラクチャ",
|
||||
"optionGrpc": "gRPC",
|
||||
"optionWebSocket": "WebSocket",
|
||||
"optionDns": "DNS"
|
||||
"optionWebSocket": "WebSocket"
|
||||
},
|
||||
"bulkPause": {
|
||||
"paused_one": "{{count}} 個のモニターを一時停止しました",
|
||||
@@ -476,8 +462,7 @@
|
||||
"alreadyPaused_one": "選択したモニターはすでに一時停止されています",
|
||||
"alreadyPaused_other": "選択したすべてのモニターはすでに一時停止されています",
|
||||
"alreadyRunning_one": "選択したモニターはすでに実行中です",
|
||||
"alreadyRunning_other": "選択したすべてのモニターはすでに実行中です",
|
||||
"partialFailure": "{{successCount}} 個のモニターが更新されましたが、{{failedCount}} 個はジョブキューとの同期に失敗しました"
|
||||
"alreadyRunning_other": "選択したすべてのモニターはすでに実行中です"
|
||||
}
|
||||
}
|
||||
},
|
||||
@@ -498,9 +483,9 @@
|
||||
},
|
||||
"matchMethod": {
|
||||
"label": "マッチ方法",
|
||||
"equal": "等しい",
|
||||
"include": "含む",
|
||||
"regex": "正規表現"
|
||||
"equal": "",
|
||||
"include": "",
|
||||
"regex": ""
|
||||
}
|
||||
},
|
||||
"title": "詳細設定"
|
||||
@@ -512,15 +497,15 @@
|
||||
"label": "チェック頻度",
|
||||
"value": {
|
||||
"fifteenMinutes": "15分",
|
||||
"fifteenSeconds": "15秒",
|
||||
"fifteenSeconds": "",
|
||||
"fiveMinutes": "5分",
|
||||
"fourMinutes": "4分",
|
||||
"oneMinute": "1分",
|
||||
"fourMinutes": "",
|
||||
"oneMinute": "",
|
||||
"tenMinutes": "10分",
|
||||
"thirtyMinutes": "30分",
|
||||
"thirtySeconds": "30秒",
|
||||
"thirtySeconds": "",
|
||||
"threeMinutes": "3分",
|
||||
"twoMinutes": "2分"
|
||||
"twoMinutes": ""
|
||||
}
|
||||
}
|
||||
},
|
||||
@@ -549,8 +534,8 @@
|
||||
"placeholder": "https://www.google.com"
|
||||
},
|
||||
"game": {
|
||||
"label": "ゲームを選択",
|
||||
"placeholder": "ゲームを選択"
|
||||
"label": "",
|
||||
"placeholder": ""
|
||||
},
|
||||
"port": {
|
||||
"label": "監視するポート",
|
||||
@@ -567,26 +552,6 @@
|
||||
"captureUrl": {
|
||||
"label": "Capture エンドポイント",
|
||||
"placeholder": "http://192.168.1.10:5001/api/v1/metrics"
|
||||
},
|
||||
"dnsRecordType": {
|
||||
"label": "DNSレコードタイプ",
|
||||
"value": {
|
||||
"A": "A",
|
||||
"AAAA": "AAAA",
|
||||
"CNAME": "CNAME",
|
||||
"MX": "MX",
|
||||
"NS": "NS",
|
||||
"TXT": "TXT"
|
||||
}
|
||||
},
|
||||
"dnsServer": {
|
||||
"label": "DNSサーバー",
|
||||
"placeholder": "8.8.8.8"
|
||||
},
|
||||
"strategy": {
|
||||
"desktop": "デスクトップ",
|
||||
"label": "ストラテジー",
|
||||
"mobile": "モバイル"
|
||||
}
|
||||
},
|
||||
"title": "一般設定",
|
||||
@@ -599,8 +564,7 @@
|
||||
"pagespeed": "Webサイトのページ読み込みパフォーマンス、Core Web Vitals、最適化スコアを追跡します。",
|
||||
"grpc": "gRPCサーバーのホスト名とポートを入力し、必要に応じてヘルスチェック用のサービス名を指定し、表示名を追加してください。",
|
||||
"websocket": "監視するWebSocket URLを入力し(例: wss://example.com/socket)、表示名を追加してください。",
|
||||
"hardware": "インフラの CPU、メモリ、ディスク使用率、温度を監視します。Capture エンドポイント URL には完全なパス /api/v1/metrics を含める必要があります (例: http://192.168.1.10:5001/api/v1/metrics)。認証シークレットにはトークン文字列のみを貼り付けてください — 'Bearer' は含めないでください。",
|
||||
"dns": "特定のDNSサーバーが応答しているかを監視します。"
|
||||
"hardware": "インフラの CPU、メモリ、ディスク使用率、温度を監視します。Capture エンドポイント URL には完全なパス /api/v1/metrics を含める必要があります (例: http://192.168.1.10:5001/api/v1/metrics)。認証シークレットにはトークン文字列のみを貼り付けてください — 'Bearer' は含めないでください。"
|
||||
}
|
||||
},
|
||||
"ignoreTls": {
|
||||
@@ -637,8 +601,7 @@
|
||||
"optionHttpDescription": "HTTP(S)を使用してWebサイトまたはAPIエンドポイントを監視します。",
|
||||
"optionPingDescription": "ICMP Pingを使用してサーバーがオンラインかどうかを監視します。",
|
||||
"optionPortDescription": "サーバーの特定のポートが開いているかどうかを監視します。",
|
||||
"title": "タイプ",
|
||||
"optionDnsDescription": "特定のDNSサーバーが応答しているかを監視します。"
|
||||
"title": "タイプ"
|
||||
},
|
||||
"thresholds": {
|
||||
"title": "アラートしきい値",
|
||||
@@ -863,7 +826,7 @@
|
||||
},
|
||||
"tabs": {
|
||||
"labels": {
|
||||
"network": "ネットワーク",
|
||||
"network": "",
|
||||
"overview": "概要"
|
||||
}
|
||||
},
|
||||
@@ -946,8 +909,7 @@
|
||||
"lastFinishedAt": "最終完了日時",
|
||||
"lastRunTook": "最終実行時間",
|
||||
"lastFailedAt": "最終失敗日時",
|
||||
"failReason": "失敗理由",
|
||||
"state": "状態"
|
||||
"failReason": "失敗理由"
|
||||
}
|
||||
},
|
||||
"queueFallback": {
|
||||
@@ -1137,10 +1099,6 @@
|
||||
"header": {
|
||||
"title": "PageSpeed監視",
|
||||
"description": "Core Web VitalsとLighthouseスコアを継続的に追跡し、ユーザーが気付く前に劣化を発見します。"
|
||||
},
|
||||
"strategy": {
|
||||
"desktop": "デスクトップ",
|
||||
"mobile": "モバイル"
|
||||
}
|
||||
},
|
||||
"settings": {
|
||||
@@ -1289,10 +1247,6 @@
|
||||
},
|
||||
"rejectUnauthorized": {
|
||||
"label": "無効な証明書を拒否: 自己署名または信頼されていない証明書の接続を拒否"
|
||||
},
|
||||
"displayName": {
|
||||
"label": "送信者名(任意)- 差出人フィールドに表示されるわかりやすい名前",
|
||||
"placeholder": "Checkmate通知"
|
||||
}
|
||||
}
|
||||
},
|
||||
@@ -1353,20 +1307,6 @@
|
||||
"uptime": {
|
||||
"title": "稼働時間",
|
||||
"responseTime": "応答時間"
|
||||
},
|
||||
"chart": {
|
||||
"avg": "平均 {{value}}ms",
|
||||
"downTooltip": "ダウン",
|
||||
"heatmapAria": "応答時間のヒートマップ",
|
||||
"max": "最大 {{value}}ms"
|
||||
},
|
||||
"status": {
|
||||
"breached": "しきい値超過",
|
||||
"down": "ダウン",
|
||||
"initializing": "初期化中",
|
||||
"maintenance": "メンテナンス",
|
||||
"paused": "一時停止中",
|
||||
"up": "稼働中"
|
||||
}
|
||||
},
|
||||
"statusBar": {
|
||||
@@ -1384,9 +1324,7 @@
|
||||
"maintenance": "一部のシステムがメンテナンス中です",
|
||||
"partiallyPaused": "一部のシステムが一時停止中です",
|
||||
"initializing": "一部のシステムが初期化中です",
|
||||
"noMonitors": "モニターが設定されていません",
|
||||
"monitoringSummary": "{{count}}サービスを監視中 · 10秒ごとに更新",
|
||||
"monitoringSummary_other": "{{count}}サービスを監視中 · 10秒ごとに更新"
|
||||
"noMonitors": "モニターが設定されていません"
|
||||
},
|
||||
"table": {
|
||||
"headers": {
|
||||
@@ -1477,47 +1415,11 @@
|
||||
"label": "インフラストラクチャメトリクスを表示"
|
||||
}
|
||||
}
|
||||
},
|
||||
"theme": {
|
||||
"description": "公開ステータスページの視覚スタイルを選択します。",
|
||||
"label": "テーマ",
|
||||
"options": {
|
||||
"bold": {
|
||||
"description": "大きな書体と自信のある間隔。ブランド中心のページに最適です。",
|
||||
"name": "ボールド"
|
||||
},
|
||||
"editorial": {
|
||||
"description": "セリフ見出しと細い区切り線。独特で落ち着いています。",
|
||||
"name": "エディトリアル"
|
||||
},
|
||||
"modern": {
|
||||
"description": "脈動するステータスドットと柔らかくフェードするカードを備えたSaaS品質。",
|
||||
"name": "モダン"
|
||||
},
|
||||
"refined": {
|
||||
"description": "クリーンでプロフェッショナル、Checkmateのクラシックな外観に近い。",
|
||||
"name": "リファインド"
|
||||
}
|
||||
},
|
||||
"title": "ページテーマ"
|
||||
},
|
||||
"themeMode": {
|
||||
"auto": "自動(訪問者のデバイスに従う)",
|
||||
"dark": "ダークのみ",
|
||||
"label": "テーマモード",
|
||||
"light": "ライトのみ"
|
||||
}
|
||||
},
|
||||
"header": {
|
||||
"title": "ステータスページ",
|
||||
"description": "顧客と関係者にリアルタイムの稼働状況とインシデント履歴を表示する公開ページを公開します。"
|
||||
},
|
||||
"editorial": {
|
||||
"allUp": "すべてのシステムは正常に動作しています。",
|
||||
"reportTitle": "サービスレポート"
|
||||
},
|
||||
"footer": {
|
||||
"poweredBy": "提供元"
|
||||
}
|
||||
},
|
||||
"uptime": {
|
||||
|
||||
+14
-112
@@ -73,9 +73,7 @@
|
||||
"paused": "pausado",
|
||||
"na": "N/D",
|
||||
"resolved": "Resolvido",
|
||||
"responseTime": "Tempo de resposta",
|
||||
"idle": "Inativo",
|
||||
"running": "Em execução"
|
||||
"responseTime": "Tempo de resposta"
|
||||
},
|
||||
"form": {
|
||||
"role": {
|
||||
@@ -122,17 +120,6 @@
|
||||
"active": "Ativo",
|
||||
"responseTime": "Tempo de resposta"
|
||||
}
|
||||
},
|
||||
"statusCode": {
|
||||
"down": "Fora do ar",
|
||||
"networkError": {
|
||||
"dns": "Não foi possível resolver o nome do host (a busca DNS falhou).",
|
||||
"refused": "O servidor recusou a conexão (porta fechada ou serviço não escutando).",
|
||||
"reset": "A conexão foi redefinida antes que uma resposta fosse recebida.",
|
||||
"timeout": "O servidor não respondeu a tempo (tempo limite da solicitação esgotado).",
|
||||
"tls": "Falha no handshake TLS ou SSL (problema de certificado ou criptografia).",
|
||||
"unknown": "Nenhuma resposta HTTP recebida do destino."
|
||||
}
|
||||
}
|
||||
},
|
||||
"components": {
|
||||
@@ -465,8 +452,7 @@
|
||||
"optionPagespeed": "PageSpeed",
|
||||
"optionHardware": "Infraestrutura",
|
||||
"optionGrpc": "gRPC",
|
||||
"optionWebSocket": "WebSocket",
|
||||
"optionDns": "DNS"
|
||||
"optionWebSocket": "WebSocket"
|
||||
},
|
||||
"bulkPause": {
|
||||
"paused_one": "{{count}} monitor pausado",
|
||||
@@ -476,8 +462,7 @@
|
||||
"alreadyPaused_one": "O monitor selecionado já está pausado",
|
||||
"alreadyPaused_other": "Todos os monitores selecionados já estão pausados",
|
||||
"alreadyRunning_one": "O monitor selecionado já está em execução",
|
||||
"alreadyRunning_other": "Todos os monitores selecionados já estão em execução",
|
||||
"partialFailure": "{{successCount}} monitores atualizados, mas {{failedCount}} falharam ao sincronizar com a fila de trabalhos"
|
||||
"alreadyRunning_other": "Todos os monitores selecionados já estão em execução"
|
||||
}
|
||||
}
|
||||
},
|
||||
@@ -498,8 +483,8 @@
|
||||
},
|
||||
"matchMethod": {
|
||||
"label": "Método de correspondência",
|
||||
"equal": "Igual",
|
||||
"include": "Inclui",
|
||||
"equal": "",
|
||||
"include": "",
|
||||
"regex": "Regex"
|
||||
}
|
||||
},
|
||||
@@ -512,13 +497,13 @@
|
||||
"label": "Frequência de verificação",
|
||||
"value": {
|
||||
"fifteenMinutes": "15 minutos",
|
||||
"fifteenSeconds": "15 segundos",
|
||||
"fifteenSeconds": "",
|
||||
"fiveMinutes": "5 minutos",
|
||||
"fourMinutes": "4 minutos",
|
||||
"oneMinute": "1 minuto",
|
||||
"tenMinutes": "10 minutos",
|
||||
"thirtyMinutes": "30 minutos",
|
||||
"thirtySeconds": "30 segundos",
|
||||
"thirtySeconds": "",
|
||||
"threeMinutes": "3 minutos",
|
||||
"twoMinutes": "2 minutos"
|
||||
}
|
||||
@@ -549,8 +534,8 @@
|
||||
"placeholder": "https://www.google.com"
|
||||
},
|
||||
"game": {
|
||||
"label": "Escolher jogo",
|
||||
"placeholder": "Selecione um jogo"
|
||||
"label": "",
|
||||
"placeholder": ""
|
||||
},
|
||||
"port": {
|
||||
"label": "Porta para monitorar",
|
||||
@@ -567,26 +552,6 @@
|
||||
"captureUrl": {
|
||||
"label": "Endpoint do Capture",
|
||||
"placeholder": "http://192.168.1.10:5001/api/v1/metrics"
|
||||
},
|
||||
"dnsRecordType": {
|
||||
"label": "Tipo de registro DNS",
|
||||
"value": {
|
||||
"A": "A",
|
||||
"AAAA": "AAAA",
|
||||
"CNAME": "CNAME",
|
||||
"MX": "MX",
|
||||
"NS": "NS",
|
||||
"TXT": "TXT"
|
||||
}
|
||||
},
|
||||
"dnsServer": {
|
||||
"label": "Servidor DNS",
|
||||
"placeholder": "8.8.8.8"
|
||||
},
|
||||
"strategy": {
|
||||
"desktop": "Desktop",
|
||||
"label": "Estratégia",
|
||||
"mobile": "Mobile"
|
||||
}
|
||||
},
|
||||
"title": "Configurações gerais",
|
||||
@@ -599,8 +564,7 @@
|
||||
"pagespeed": "Acompanhe o desempenho de carregamento da página, Core Web Vitals e pontuações de otimização do seu site.",
|
||||
"grpc": "Digite o hostname e a porta do servidor gRPC, opcionalmente especifique um nome de serviço para a verificação de saúde e adicione um nome de exibição.",
|
||||
"websocket": "Digite a URL do WebSocket para monitorar (ex.: wss://exemplo.com/socket) e adicione um nome de exibição.",
|
||||
"hardware": "Monitore o uso de CPU, memória, disco e temperatura da sua infraestrutura. A URL do endpoint do Capture deve incluir o caminho completo /api/v1/metrics (por exemplo, http://192.168.1.10:5001/api/v1/metrics). Para a chave de autorização, cole apenas a string do token — não inclua 'Bearer'.",
|
||||
"dns": "Monitore se um servidor DNS específico está respondendo."
|
||||
"hardware": "Monitore o uso de CPU, memória, disco e temperatura da sua infraestrutura. A URL do endpoint do Capture deve incluir o caminho completo /api/v1/metrics (por exemplo, http://192.168.1.10:5001/api/v1/metrics). Para a chave de autorização, cole apenas a string do token — não inclua 'Bearer'."
|
||||
}
|
||||
},
|
||||
"ignoreTls": {
|
||||
@@ -637,8 +601,7 @@
|
||||
"optionHttpDescription": "Use HTTP(S) para monitorar seu site ou endpoint de API.",
|
||||
"optionPingDescription": "Use ICMP Ping para monitorar se um servidor está online.",
|
||||
"optionPortDescription": "Monitore se uma porta específica em um servidor está aberta.",
|
||||
"title": "Tipo",
|
||||
"optionDnsDescription": "Monitore se um servidor DNS específico está respondendo."
|
||||
"title": "Tipo"
|
||||
},
|
||||
"thresholds": {
|
||||
"title": "Limites de alerta",
|
||||
@@ -863,7 +826,7 @@
|
||||
},
|
||||
"tabs": {
|
||||
"labels": {
|
||||
"network": "Rede",
|
||||
"network": "",
|
||||
"overview": "Visão geral"
|
||||
}
|
||||
},
|
||||
@@ -946,8 +909,7 @@
|
||||
"lastFinishedAt": "Última conclusão em",
|
||||
"lastRunTook": "Última execução durou",
|
||||
"lastFailedAt": "Última falha em",
|
||||
"failReason": "Motivo da falha",
|
||||
"state": "Estado"
|
||||
"failReason": "Motivo da falha"
|
||||
}
|
||||
},
|
||||
"queueFallback": {
|
||||
@@ -1137,10 +1099,6 @@
|
||||
"header": {
|
||||
"title": "Monitores PageSpeed",
|
||||
"description": "Acompanhe Core Web Vitals e pontuações do Lighthouse ao longo do tempo para detectar regressões antes dos seus usuários."
|
||||
},
|
||||
"strategy": {
|
||||
"desktop": "Desktop",
|
||||
"mobile": "Mobile"
|
||||
}
|
||||
},
|
||||
"settings": {
|
||||
@@ -1289,10 +1247,6 @@
|
||||
},
|
||||
"rejectUnauthorized": {
|
||||
"label": "Rejeitar certificados inválidos: Rejeitar conexões com certificados autoassinados ou não confiáveis"
|
||||
},
|
||||
"displayName": {
|
||||
"label": "Nome do remetente (opcional) - Nome amigável exibido no campo De",
|
||||
"placeholder": "Notificações do Checkmate"
|
||||
}
|
||||
}
|
||||
},
|
||||
@@ -1353,20 +1307,6 @@
|
||||
"uptime": {
|
||||
"title": "Uptime",
|
||||
"responseTime": "Tempo de resposta"
|
||||
},
|
||||
"chart": {
|
||||
"avg": "méd {{value}}ms",
|
||||
"downTooltip": "Fora do ar",
|
||||
"heatmapAria": "Mapa de calor do tempo de resposta",
|
||||
"max": "máx {{value}}ms"
|
||||
},
|
||||
"status": {
|
||||
"breached": "Limite excedido",
|
||||
"down": "Fora do ar",
|
||||
"initializing": "Inicializando",
|
||||
"maintenance": "Manutenção",
|
||||
"paused": "Pausado",
|
||||
"up": "Operacional"
|
||||
}
|
||||
},
|
||||
"statusBar": {
|
||||
@@ -1384,9 +1324,7 @@
|
||||
"maintenance": "Alguns sistemas estão em manutenção",
|
||||
"partiallyPaused": "Alguns sistemas estão pausados",
|
||||
"initializing": "Alguns sistemas estão inicializando",
|
||||
"noMonitors": "Nenhum monitor foi configurado",
|
||||
"monitoringSummary": "Monitorando {{count}} serviço · Atualizações a cada 10 segundos",
|
||||
"monitoringSummary_other": "Monitorando {{count}} serviços · Atualizações a cada 10 segundos"
|
||||
"noMonitors": "Nenhum monitor foi configurado"
|
||||
},
|
||||
"table": {
|
||||
"headers": {
|
||||
@@ -1477,47 +1415,11 @@
|
||||
"label": "Mostrar métricas de infraestrutura"
|
||||
}
|
||||
}
|
||||
},
|
||||
"theme": {
|
||||
"description": "Escolha o estilo visual da sua página de status pública.",
|
||||
"label": "Tema",
|
||||
"options": {
|
||||
"bold": {
|
||||
"description": "Tipografia grande e espaçamento confiante. Ótimo para páginas voltadas à marca.",
|
||||
"name": "Negrito"
|
||||
},
|
||||
"editorial": {
|
||||
"description": "Títulos com serifa e divisores finos. Distinto e calmo.",
|
||||
"name": "Editorial"
|
||||
},
|
||||
"modern": {
|
||||
"description": "Qualidade SaaS com um ponto de status pulsante e cartões que desaparecem suavemente.",
|
||||
"name": "Moderno"
|
||||
},
|
||||
"refined": {
|
||||
"description": "Limpo, profissional, próximo ao visual clássico do Checkmate.",
|
||||
"name": "Refinado"
|
||||
}
|
||||
},
|
||||
"title": "Tema da página"
|
||||
},
|
||||
"themeMode": {
|
||||
"auto": "Automático (seguir dispositivo do visitante)",
|
||||
"dark": "Apenas escuro",
|
||||
"label": "Modo de tema",
|
||||
"light": "Apenas claro"
|
||||
}
|
||||
},
|
||||
"header": {
|
||||
"title": "Páginas de status",
|
||||
"description": "Publique páginas públicas que mostram aos seus clientes e partes interessadas o tempo de atividade em tempo real e o histórico de incidentes."
|
||||
},
|
||||
"editorial": {
|
||||
"allUp": "Todos os sistemas estão operando normalmente.",
|
||||
"reportTitle": "Relatório de serviço"
|
||||
},
|
||||
"footer": {
|
||||
"poweredBy": "Desenvolvido por"
|
||||
}
|
||||
},
|
||||
"uptime": {
|
||||
|
||||
+7
-105
@@ -73,9 +73,7 @@
|
||||
"paused": "приостановлен",
|
||||
"na": "Н/Д",
|
||||
"resolved": "Решён",
|
||||
"responseTime": "Время ответа",
|
||||
"idle": "Бездействие",
|
||||
"running": "Выполняется"
|
||||
"responseTime": "Время ответа"
|
||||
},
|
||||
"form": {
|
||||
"role": {
|
||||
@@ -122,17 +120,6 @@
|
||||
"active": "Активный",
|
||||
"responseTime": "Время ответа"
|
||||
}
|
||||
},
|
||||
"statusCode": {
|
||||
"down": "Не работает",
|
||||
"networkError": {
|
||||
"dns": "Не удалось разрешить имя хоста (поиск DNS не удался).",
|
||||
"refused": "Сервер отказал в соединении (порт закрыт или служба не прослушивает).",
|
||||
"reset": "Соединение было сброшено до получения ответа.",
|
||||
"timeout": "Сервер не ответил вовремя (тайм-аут запроса).",
|
||||
"tls": "Сбой рукопожатия TLS или SSL (проблема с сертификатом или шифрованием).",
|
||||
"unknown": "HTTP-ответ от цели не получен."
|
||||
}
|
||||
}
|
||||
},
|
||||
"components": {
|
||||
@@ -465,8 +452,7 @@
|
||||
"optionPagespeed": "PageSpeed",
|
||||
"optionHardware": "Инфраструктура",
|
||||
"optionGrpc": "gRPC",
|
||||
"optionWebSocket": "WebSocket",
|
||||
"optionDns": "DNS"
|
||||
"optionWebSocket": "WebSocket"
|
||||
},
|
||||
"bulkPause": {
|
||||
"paused_one": "{{count}} монитор приостановлен",
|
||||
@@ -476,8 +462,7 @@
|
||||
"alreadyPaused_one": "Выбранный монитор уже приостановлен",
|
||||
"alreadyPaused_other": "Все выбранные мониторы уже приостановлены",
|
||||
"alreadyRunning_one": "Выбранный монитор уже запущен",
|
||||
"alreadyRunning_other": "Все выбранные мониторы уже запущены",
|
||||
"partialFailure": "Обновлено {{successCount}} мониторов, но {{failedCount}} не удалось синхронизировать с очередью задач"
|
||||
"alreadyRunning_other": "Все выбранные мониторы уже запущены"
|
||||
}
|
||||
}
|
||||
},
|
||||
@@ -567,26 +552,6 @@
|
||||
"captureUrl": {
|
||||
"label": "Эндпоинт Capture",
|
||||
"placeholder": "http://192.168.1.10:5001/api/v1/metrics"
|
||||
},
|
||||
"dnsRecordType": {
|
||||
"label": "Тип записи DNS",
|
||||
"value": {
|
||||
"A": "A",
|
||||
"AAAA": "AAAA",
|
||||
"CNAME": "CNAME",
|
||||
"MX": "MX",
|
||||
"NS": "NS",
|
||||
"TXT": "TXT"
|
||||
}
|
||||
},
|
||||
"dnsServer": {
|
||||
"label": "DNS-сервер",
|
||||
"placeholder": "8.8.8.8"
|
||||
},
|
||||
"strategy": {
|
||||
"desktop": "Десктоп",
|
||||
"label": "Стратегия",
|
||||
"mobile": "Мобильный"
|
||||
}
|
||||
},
|
||||
"title": "Основные настройки",
|
||||
@@ -599,8 +564,7 @@
|
||||
"pagespeed": "Отслеживайте производительность загрузки, Core Web Vitals и показатели оптимизации для Вашего сайта.",
|
||||
"grpc": "Введите имя хоста и порт gRPC-сервера, при необходимости укажите имя сервиса для проверки состояния и добавьте отображаемое имя.",
|
||||
"websocket": "Введите WebSocket URL для мониторинга (напр., wss://example.com/socket) и добавьте отображаемое имя.",
|
||||
"hardware": "Отслеживайте использование ЦП, памяти, диска и температуру вашей инфраструктуры. URL эндпоинта Capture должен включать полный путь /api/v1/metrics (например, http://192.168.1.10:5001/api/v1/metrics). В секрете авторизации укажите только строку токена — не включайте 'Bearer'.",
|
||||
"dns": "Отслеживайте, отвечает ли конкретный DNS-сервер."
|
||||
"hardware": "Отслеживайте использование ЦП, памяти, диска и температуру вашей инфраструктуры. URL эндпоинта Capture должен включать полный путь /api/v1/metrics (например, http://192.168.1.10:5001/api/v1/metrics). В секрете авторизации укажите только строку токена — не включайте 'Bearer'."
|
||||
}
|
||||
},
|
||||
"ignoreTls": {
|
||||
@@ -637,8 +601,7 @@
|
||||
"optionHttpDescription": "Используйте HTTP(S) для мониторинга Вашего сайта или API-эндпоинта.",
|
||||
"optionPingDescription": "Используйте ICMP Ping для проверки доступности сервера.",
|
||||
"optionPortDescription": "Мониторинг доступности определённого порта на сервере.",
|
||||
"title": "Тип",
|
||||
"optionDnsDescription": "Отслеживайте, отвечает ли конкретный DNS-сервер."
|
||||
"title": "Тип"
|
||||
},
|
||||
"thresholds": {
|
||||
"title": "Пороги оповещений",
|
||||
@@ -946,8 +909,7 @@
|
||||
"lastFinishedAt": "Последнее завершение",
|
||||
"lastRunTook": "Последний запуск занял",
|
||||
"lastFailedAt": "Последняя ошибка",
|
||||
"failReason": "Причина ошибки",
|
||||
"state": "Состояние"
|
||||
"failReason": "Причина ошибки"
|
||||
}
|
||||
},
|
||||
"queueFallback": {
|
||||
@@ -1137,10 +1099,6 @@
|
||||
"header": {
|
||||
"title": "Мониторы PageSpeed",
|
||||
"description": "Отслеживайте Core Web Vitals и оценки Lighthouse во времени, чтобы заметить регрессии раньше пользователей."
|
||||
},
|
||||
"strategy": {
|
||||
"desktop": "Десктоп",
|
||||
"mobile": "Мобильный"
|
||||
}
|
||||
},
|
||||
"settings": {
|
||||
@@ -1289,10 +1247,6 @@
|
||||
},
|
||||
"rejectUnauthorized": {
|
||||
"label": "Отклонять недействительные сертификаты: отклонять соединения с самоподписанными или ненадёжными сертификатами"
|
||||
},
|
||||
"displayName": {
|
||||
"label": "Имя отправителя (необязательно) - Понятное имя в поле От",
|
||||
"placeholder": "Уведомления Checkmate"
|
||||
}
|
||||
}
|
||||
},
|
||||
@@ -1353,20 +1307,6 @@
|
||||
"uptime": {
|
||||
"title": "Аптайм",
|
||||
"responseTime": "Время ответа"
|
||||
},
|
||||
"chart": {
|
||||
"avg": "ср {{value}}мс",
|
||||
"downTooltip": "Не работает",
|
||||
"heatmapAria": "Тепловая карта времени отклика",
|
||||
"max": "макс {{value}}мс"
|
||||
},
|
||||
"status": {
|
||||
"breached": "Превышен порог",
|
||||
"down": "Не работает",
|
||||
"initializing": "Инициализация",
|
||||
"maintenance": "Обслуживание",
|
||||
"paused": "Приостановлено",
|
||||
"up": "Работает"
|
||||
}
|
||||
},
|
||||
"statusBar": {
|
||||
@@ -1384,9 +1324,7 @@
|
||||
"maintenance": "Некоторые системы на техобслуживании",
|
||||
"partiallyPaused": "Некоторые системы приостановлены",
|
||||
"initializing": "Некоторые системы инициализируются",
|
||||
"noMonitors": "Мониторы не настроены",
|
||||
"monitoringSummary": "Отслеживается {{count}} сервис · Обновление каждые 10 секунд",
|
||||
"monitoringSummary_other": "Отслеживается {{count}} сервисов · Обновление каждые 10 секунд"
|
||||
"noMonitors": "Мониторы не настроены"
|
||||
},
|
||||
"table": {
|
||||
"headers": {
|
||||
@@ -1477,47 +1415,11 @@
|
||||
"label": "Показывать метрики инфраструктуры"
|
||||
}
|
||||
}
|
||||
},
|
||||
"theme": {
|
||||
"description": "Выберите визуальный стиль для вашей публичной страницы состояния.",
|
||||
"label": "Тема",
|
||||
"options": {
|
||||
"bold": {
|
||||
"description": "Крупная типографика и уверенные отступы. Отлично подходит для брендовых страниц.",
|
||||
"name": "Жирный"
|
||||
},
|
||||
"editorial": {
|
||||
"description": "Заголовки с засечками и тонкие разделители. Отличительный и спокойный.",
|
||||
"name": "Редакционный"
|
||||
},
|
||||
"modern": {
|
||||
"description": "Уровень SaaS с пульсирующей точкой состояния и плавно исчезающими карточками.",
|
||||
"name": "Современный"
|
||||
},
|
||||
"refined": {
|
||||
"description": "Чистый, профессиональный, близкий к классическому виду Checkmate.",
|
||||
"name": "Утонченный"
|
||||
}
|
||||
},
|
||||
"title": "Тема страницы"
|
||||
},
|
||||
"themeMode": {
|
||||
"auto": "Авто (по устройству посетителя)",
|
||||
"dark": "Только темная",
|
||||
"label": "Режим темы",
|
||||
"light": "Только светлая"
|
||||
}
|
||||
},
|
||||
"header": {
|
||||
"title": "Страницы состояния",
|
||||
"description": "Публикуйте публичные страницы со временем работы и историей инцидентов для клиентов и заинтересованных сторон."
|
||||
},
|
||||
"editorial": {
|
||||
"allUp": "Все системы работают в нормальном режиме.",
|
||||
"reportTitle": "Отчет о сервисе"
|
||||
},
|
||||
"footer": {
|
||||
"poweredBy": "Работает на"
|
||||
}
|
||||
},
|
||||
"uptime": {
|
||||
|
||||
+7
-105
@@ -73,9 +73,7 @@
|
||||
"paused": "หยุดชั่วคราว",
|
||||
"na": "ไม่มีข้อมูล",
|
||||
"resolved": "แก้ไขแล้ว",
|
||||
"responseTime": "เวลาตอบสนอง",
|
||||
"idle": "ไม่ทำงาน",
|
||||
"running": "กำลังทำงาน"
|
||||
"responseTime": "เวลาตอบสนอง"
|
||||
},
|
||||
"form": {
|
||||
"role": {
|
||||
@@ -122,17 +120,6 @@
|
||||
"active": "ใช้งานอยู่",
|
||||
"responseTime": "เวลาตอบสนอง"
|
||||
}
|
||||
},
|
||||
"statusCode": {
|
||||
"down": "ไม่พร้อมใช้งาน",
|
||||
"networkError": {
|
||||
"dns": "ไม่สามารถแก้ไขชื่อโฮสต์ได้ (การค้นหา DNS ล้มเหลว)",
|
||||
"refused": "เซิร์ฟเวอร์ปฏิเสธการเชื่อมต่อ (พอร์ตปิดอยู่หรือบริการไม่ได้รับฟัง)",
|
||||
"reset": "การเชื่อมต่อถูกรีเซ็ตก่อนที่จะได้รับการตอบกลับ",
|
||||
"timeout": "เซิร์ฟเวอร์ไม่ตอบกลับทันเวลา (คำขอหมดเวลา)",
|
||||
"tls": "การจับมือ TLS หรือ SSL ล้มเหลว (ปัญหาใบรับรองหรือการเข้ารหัส)",
|
||||
"unknown": "ไม่ได้รับการตอบกลับ HTTP จากเป้าหมาย"
|
||||
}
|
||||
}
|
||||
},
|
||||
"components": {
|
||||
@@ -465,8 +452,7 @@
|
||||
"optionPagespeed": "PageSpeed",
|
||||
"optionHardware": "โครงสร้างพื้นฐาน",
|
||||
"optionGrpc": "gRPC",
|
||||
"optionWebSocket": "WebSocket",
|
||||
"optionDns": "DNS"
|
||||
"optionWebSocket": "WebSocket"
|
||||
},
|
||||
"bulkPause": {
|
||||
"paused_one": "หยุดจอภาพชั่วคราว {{count}} จอ",
|
||||
@@ -476,8 +462,7 @@
|
||||
"alreadyPaused_one": "จอภาพที่เลือกถูกหยุดชั่วคราวแล้ว",
|
||||
"alreadyPaused_other": "จอภาพที่เลือกทั้งหมดถูกหยุดชั่วคราวแล้ว",
|
||||
"alreadyRunning_one": "จอภาพที่เลือกกำลังทำงานอยู่แล้ว",
|
||||
"alreadyRunning_other": "จอภาพที่เลือกทั้งหมดกำลังทำงานอยู่แล้ว",
|
||||
"partialFailure": "อัปเดตมอนิเตอร์ {{successCount}} รายการแล้ว แต่ {{failedCount}} รายการไม่สามารถซิงค์กับคิวงานได้"
|
||||
"alreadyRunning_other": "จอภาพที่เลือกทั้งหมดกำลังทำงานอยู่แล้ว"
|
||||
}
|
||||
}
|
||||
},
|
||||
@@ -567,26 +552,6 @@
|
||||
"captureUrl": {
|
||||
"label": "ปลายทาง Capture",
|
||||
"placeholder": "http://192.168.1.10:5001/api/v1/metrics"
|
||||
},
|
||||
"dnsRecordType": {
|
||||
"label": "ประเภทเรกคอร์ด DNS",
|
||||
"value": {
|
||||
"A": "A",
|
||||
"AAAA": "AAAA",
|
||||
"CNAME": "CNAME",
|
||||
"MX": "MX",
|
||||
"NS": "NS",
|
||||
"TXT": "TXT"
|
||||
}
|
||||
},
|
||||
"dnsServer": {
|
||||
"label": "เซิร์ฟเวอร์ DNS",
|
||||
"placeholder": "8.8.8.8"
|
||||
},
|
||||
"strategy": {
|
||||
"desktop": "เดสก์ท็อป",
|
||||
"label": "กลยุทธ์",
|
||||
"mobile": "มือถือ"
|
||||
}
|
||||
},
|
||||
"title": "ตั้งค่าทั่วไป",
|
||||
@@ -599,8 +564,7 @@
|
||||
"pagespeed": "ติดตามประสิทธิภาพการโหลดหน้า Core Web Vitals และคะแนนการเพิ่มประสิทธิภาพของเว็บไซต์",
|
||||
"grpc": "กรอกชื่อโฮสต์และพอร์ตของเซิร์ฟเวอร์ gRPC ระบุชื่อบริการสำหรับ health check (ไม่บังคับ) และตั้งชื่อที่แสดง",
|
||||
"websocket": "กรอก URL ของ WebSocket ที่ต้องการตรวจสอบ (เช่น wss://example.com/socket) และตั้งชื่อที่แสดง",
|
||||
"hardware": "ตรวจสอบการใช้ CPU หน่วยความจำ ดิสก์ และอุณหภูมิของโครงสร้างพื้นฐานของคุณ URL ของปลายทาง Capture ต้องรวมเส้นทางแบบเต็ม /api/v1/metrics (ตัวอย่าง: http://192.168.1.10:5001/api/v1/metrics) สำหรับรหัสลับสำหรับยืนยันตัวตน ให้วางเฉพาะสตริงโทเค็น — อย่ารวมคำว่า 'Bearer'",
|
||||
"dns": "ติดตามว่าเซิร์ฟเวอร์ DNS เฉพาะตอบกลับหรือไม่"
|
||||
"hardware": "ตรวจสอบการใช้ CPU หน่วยความจำ ดิสก์ และอุณหภูมิของโครงสร้างพื้นฐานของคุณ URL ของปลายทาง Capture ต้องรวมเส้นทางแบบเต็ม /api/v1/metrics (ตัวอย่าง: http://192.168.1.10:5001/api/v1/metrics) สำหรับรหัสลับสำหรับยืนยันตัวตน ให้วางเฉพาะสตริงโทเค็น — อย่ารวมคำว่า 'Bearer'"
|
||||
}
|
||||
},
|
||||
"ignoreTls": {
|
||||
@@ -637,8 +601,7 @@
|
||||
"optionHttpDescription": "ใช้ HTTP(S) เพื่อตรวจสอบเว็บไซต์หรือ API endpoint",
|
||||
"optionPingDescription": "ใช้ ICMP Ping เพื่อตรวจสอบว่าเซิร์ฟเวอร์ออนไลน์อยู่หรือไม่",
|
||||
"optionPortDescription": "ตรวจสอบว่าพอร์ตเฉพาะบนเซิร์ฟเวอร์เปิดอยู่หรือไม่",
|
||||
"title": "ประเภท",
|
||||
"optionDnsDescription": "ติดตามว่าเซิร์ฟเวอร์ DNS เฉพาะตอบกลับหรือไม่"
|
||||
"title": "ประเภท"
|
||||
},
|
||||
"thresholds": {
|
||||
"title": "เกณฑ์การแจ้งเตือน",
|
||||
@@ -946,8 +909,7 @@
|
||||
"lastFinishedAt": "เสร็จสิ้นล่าสุดเมื่อ",
|
||||
"lastRunTook": "รันล่าสุดใช้เวลา",
|
||||
"lastFailedAt": "ล้มเหลวล่าสุดเมื่อ",
|
||||
"failReason": "สาเหตุที่ล้มเหลว",
|
||||
"state": "สถานะ"
|
||||
"failReason": "สาเหตุที่ล้มเหลว"
|
||||
}
|
||||
},
|
||||
"queueFallback": {
|
||||
@@ -1137,10 +1099,6 @@
|
||||
"header": {
|
||||
"title": "ตัวตรวจสอบ PageSpeed",
|
||||
"description": "ติดตาม Core Web Vitals และคะแนน Lighthouse เพื่อจับความถดถอยก่อนที่ผู้ใช้จะสังเกตเห็น"
|
||||
},
|
||||
"strategy": {
|
||||
"desktop": "เดสก์ท็อป",
|
||||
"mobile": "มือถือ"
|
||||
}
|
||||
},
|
||||
"settings": {
|
||||
@@ -1289,10 +1247,6 @@
|
||||
},
|
||||
"rejectUnauthorized": {
|
||||
"label": "ปฏิเสธใบรับรองที่ไม่ถูกต้อง: ปฏิเสธการเชื่อมต่อด้วยใบรับรอง self-signed หรือไม่น่าเชื่อถือ"
|
||||
},
|
||||
"displayName": {
|
||||
"label": "ชื่อผู้ส่ง (ไม่บังคับ) - ชื่อที่เป็นมิตรซึ่งแสดงในช่องจาก",
|
||||
"placeholder": "การแจ้งเตือน Checkmate"
|
||||
}
|
||||
}
|
||||
},
|
||||
@@ -1353,20 +1307,6 @@
|
||||
"uptime": {
|
||||
"title": "อัปไทม์",
|
||||
"responseTime": "เวลาตอบสนอง"
|
||||
},
|
||||
"chart": {
|
||||
"avg": "เฉลี่ย {{value}}ms",
|
||||
"downTooltip": "ไม่พร้อมใช้งาน",
|
||||
"heatmapAria": "แผนที่ความร้อนของเวลาตอบสนอง",
|
||||
"max": "สูงสุด {{value}}ms"
|
||||
},
|
||||
"status": {
|
||||
"breached": "เกินขีดจำกัด",
|
||||
"down": "ไม่พร้อมใช้งาน",
|
||||
"initializing": "กำลังเริ่มต้น",
|
||||
"maintenance": "การบำรุงรักษา",
|
||||
"paused": "หยุดชั่วคราว",
|
||||
"up": "ใช้งานได้"
|
||||
}
|
||||
},
|
||||
"statusBar": {
|
||||
@@ -1384,9 +1324,7 @@
|
||||
"maintenance": "บางระบบอยู่ระหว่างการบำรุงรักษา",
|
||||
"partiallyPaused": "บางระบบถูกหยุดชั่วคราว",
|
||||
"initializing": "บางระบบกำลังเริ่มต้น",
|
||||
"noMonitors": "ยังไม่มีการกำหนดค่ามอนิเตอร์",
|
||||
"monitoringSummary": "กำลังตรวจสอบ {{count}} บริการ · อัปเดตทุก 10 วินาที",
|
||||
"monitoringSummary_other": "กำลังตรวจสอบ {{count}} บริการ · อัปเดตทุก 10 วินาที"
|
||||
"noMonitors": "ยังไม่มีการกำหนดค่ามอนิเตอร์"
|
||||
},
|
||||
"table": {
|
||||
"headers": {
|
||||
@@ -1477,47 +1415,11 @@
|
||||
"label": "แสดงเมตริกโครงสร้างพื้นฐาน"
|
||||
}
|
||||
}
|
||||
},
|
||||
"theme": {
|
||||
"description": "เลือกรูปแบบภาพสำหรับหน้าสถานะสาธารณะของคุณ",
|
||||
"label": "ธีม",
|
||||
"options": {
|
||||
"bold": {
|
||||
"description": "ตัวอักษรขนาดใหญ่และการเว้นระยะที่มั่นใจ เหมาะสำหรับหน้าที่เน้นแบรนด์",
|
||||
"name": "ตัวหนา"
|
||||
},
|
||||
"editorial": {
|
||||
"description": "หัวเรื่องแบบเซริฟและตัวคั่นบาง โดดเด่นและสงบ",
|
||||
"name": "บรรณาธิการ"
|
||||
},
|
||||
"modern": {
|
||||
"description": "ระดับ SaaS พร้อมจุดสถานะที่เต้นและการ์ดที่จางหายอย่างนุ่มนวล",
|
||||
"name": "ทันสมัย"
|
||||
},
|
||||
"refined": {
|
||||
"description": "สะอาด เป็นมืออาชีพ ใกล้เคียงกับรูปลักษณ์คลาสสิกของ Checkmate",
|
||||
"name": "ละเอียดอ่อน"
|
||||
}
|
||||
},
|
||||
"title": "ธีมของหน้า"
|
||||
},
|
||||
"themeMode": {
|
||||
"auto": "อัตโนมัติ (ตามอุปกรณ์ของผู้เข้าชม)",
|
||||
"dark": "มืดเท่านั้น",
|
||||
"label": "โหมดธีม",
|
||||
"light": "สว่างเท่านั้น"
|
||||
}
|
||||
},
|
||||
"header": {
|
||||
"title": "หน้าสถานะ",
|
||||
"description": "เผยแพร่หน้าสาธารณะที่แสดง uptime แบบเรียลไทม์และประวัติเหตุการณ์ให้กับลูกค้าและผู้มีส่วนได้ส่วนเสีย"
|
||||
},
|
||||
"editorial": {
|
||||
"allUp": "ทุกระบบทำงานเป็นปกติ",
|
||||
"reportTitle": "รายงานบริการ"
|
||||
},
|
||||
"footer": {
|
||||
"poweredBy": "ขับเคลื่อนโดย"
|
||||
}
|
||||
},
|
||||
"uptime": {
|
||||
|
||||
+25
-123
@@ -73,9 +73,7 @@
|
||||
"paused": "duraklatıldı",
|
||||
"na": "N/A",
|
||||
"resolved": "Çözüldü",
|
||||
"responseTime": "Yanıt süresi",
|
||||
"idle": "Boşta",
|
||||
"running": "Çalışıyor"
|
||||
"responseTime": "Yanıt süresi"
|
||||
},
|
||||
"form": {
|
||||
"role": {
|
||||
@@ -122,17 +120,6 @@
|
||||
"active": "Aktif",
|
||||
"responseTime": "Yanıt süresi"
|
||||
}
|
||||
},
|
||||
"statusCode": {
|
||||
"down": "Çalışmıyor",
|
||||
"networkError": {
|
||||
"dns": "Ana bilgisayar adı çözümlenemedi (DNS araması başarısız oldu).",
|
||||
"refused": "Sunucu bağlantıyı reddetti (bağlantı noktası kapalı veya hizmet dinlemiyor).",
|
||||
"reset": "Yanıt alınmadan bağlantı sıfırlandı.",
|
||||
"timeout": "Sunucu zamanında yanıt vermedi (istek zaman aşımına uğradı).",
|
||||
"tls": "TLS veya SSL el sıkışması başarısız (sertifika veya şifreleme sorunu).",
|
||||
"unknown": "Hedeften HTTP yanıtı alınamadı."
|
||||
}
|
||||
}
|
||||
},
|
||||
"components": {
|
||||
@@ -319,7 +306,7 @@
|
||||
"common": {
|
||||
"passwordRules": {
|
||||
"length": {
|
||||
"beginning": "En az",
|
||||
"beginning": "",
|
||||
"highlighted": "8 karakter uzunluğunda"
|
||||
},
|
||||
"lowercase": {
|
||||
@@ -327,7 +314,7 @@
|
||||
"highlighted": "Bir küçük harf"
|
||||
},
|
||||
"match": {
|
||||
"beginning": "Parolalar",
|
||||
"beginning": "",
|
||||
"highlighted": "eşleşmelidir"
|
||||
},
|
||||
"number": {
|
||||
@@ -465,8 +452,7 @@
|
||||
"optionPagespeed": "PageSpeed",
|
||||
"optionHardware": "Altyapı",
|
||||
"optionGrpc": "gRPC",
|
||||
"optionWebSocket": "WebSocket",
|
||||
"optionDns": "DNS"
|
||||
"optionWebSocket": "WebSocket"
|
||||
},
|
||||
"bulkPause": {
|
||||
"paused_one": "{{count}} monitör duraklatıldı",
|
||||
@@ -476,8 +462,7 @@
|
||||
"alreadyPaused_one": "Seçili monitör zaten duraklatıldı",
|
||||
"alreadyPaused_other": "Seçili tüm monitörler zaten duraklatıldı",
|
||||
"alreadyRunning_one": "Seçili monitör zaten çalışıyor",
|
||||
"alreadyRunning_other": "Seçili tüm monitörler zaten çalışıyor",
|
||||
"partialFailure": "{{successCount}} monitör güncellendi, ancak {{failedCount}} tanesi iş kuyruğuyla senkronize edilemedi"
|
||||
"alreadyRunning_other": "Seçili tüm monitörler zaten çalışıyor"
|
||||
}
|
||||
}
|
||||
},
|
||||
@@ -498,9 +483,9 @@
|
||||
},
|
||||
"matchMethod": {
|
||||
"label": "Eşleştirme yöntemi",
|
||||
"equal": "Eşit",
|
||||
"include": "İçerir",
|
||||
"regex": "Regex"
|
||||
"equal": "",
|
||||
"include": "",
|
||||
"regex": ""
|
||||
}
|
||||
},
|
||||
"title": "Gelişmiş ayarlar"
|
||||
@@ -512,15 +497,15 @@
|
||||
"label": "Kontrol sıklığı",
|
||||
"value": {
|
||||
"fifteenMinutes": "15 dakika",
|
||||
"fifteenSeconds": "15 saniye",
|
||||
"fifteenSeconds": "",
|
||||
"fiveMinutes": "5 dakika",
|
||||
"fourMinutes": "4 dakika",
|
||||
"oneMinute": "1 dakika",
|
||||
"fourMinutes": "",
|
||||
"oneMinute": "",
|
||||
"tenMinutes": "10 dakika",
|
||||
"thirtyMinutes": "30 dakika",
|
||||
"thirtySeconds": "30 saniye",
|
||||
"threeMinutes": "3 dakika",
|
||||
"twoMinutes": "2 dakika"
|
||||
"thirtySeconds": "",
|
||||
"threeMinutes": "",
|
||||
"twoMinutes": ""
|
||||
}
|
||||
}
|
||||
},
|
||||
@@ -549,8 +534,8 @@
|
||||
"placeholder": "https://www.google.com"
|
||||
},
|
||||
"game": {
|
||||
"label": "Oyun seç",
|
||||
"placeholder": "Bir oyun seçin"
|
||||
"label": "",
|
||||
"placeholder": ""
|
||||
},
|
||||
"port": {
|
||||
"label": "İzlenecek port",
|
||||
@@ -567,40 +552,19 @@
|
||||
"captureUrl": {
|
||||
"label": "Capture uç noktası",
|
||||
"placeholder": "http://192.168.1.10:5001/api/v1/metrics"
|
||||
},
|
||||
"dnsRecordType": {
|
||||
"label": "DNS kayıt türü",
|
||||
"value": {
|
||||
"A": "A",
|
||||
"AAAA": "AAAA",
|
||||
"CNAME": "CNAME",
|
||||
"MX": "MX",
|
||||
"NS": "NS",
|
||||
"TXT": "TXT"
|
||||
}
|
||||
},
|
||||
"dnsServer": {
|
||||
"label": "DNS sunucusu",
|
||||
"placeholder": "8.8.8.8"
|
||||
},
|
||||
"strategy": {
|
||||
"desktop": "Masaüstü",
|
||||
"label": "Strateji",
|
||||
"mobile": "Mobil"
|
||||
}
|
||||
},
|
||||
"title": "Genel ayarlar",
|
||||
"description": {
|
||||
"http": "İzlenecek URL veya IP adresini girin (örn. https://example.com/ veya 192.168.1.100) ve panoda görünecek açık bir ad ekleyin.",
|
||||
"ping": "Ping atılacak IP adresini veya ana bilgisayar adını girin (ör. 192.168.1.100 veya example.com) ve panoda görünen net bir görünen ad ekleyin.",
|
||||
"port": "Sunucunun URL veya IP adresini, port numarasını ve panoda görünen net bir görünen ad girin.",
|
||||
"docker": "Docker kapsayıcı adını veya kimliğini girin. Kapsayıcı adını (ör. my-app) veya kapsayıcı kimliğini (tam 64 karakterli kimlik veya kısa kimlik) kullanabilirsiniz.",
|
||||
"ping": "",
|
||||
"port": "",
|
||||
"docker": "",
|
||||
"game": "Ping atılacak IP adresini veya ana bilgisayar adını ve port numarasını girin (ör. 192.168.1.100 veya example.com) ve oyun türünü seçin. Bazı oyunlar yapılandırma dosyasında sunucu sorgularının etkinleştirilmesini gerektirir — oyun sunucunuzun belgelerine bakın. Protokol ayrıntıları için <gamedigLink>desteklenen oyunlar listesine</gamedigLink> bakın.",
|
||||
"pagespeed": "Web sitenizin sayfa yükleme performansını, Core Web Vitals metriklerini ve optimizasyon puanlarını takip edin.",
|
||||
"grpc": "gRPC sunucusunun ana bilgisayar adını ve portunu girin, isteğe bağlı olarak sağlık kontrolü için bir servis adı belirtin ve bir görünen ad ekleyin.",
|
||||
"websocket": "İzlenecek WebSocket URL'sini girin (örn. wss://example.com/socket) ve bir görünen ad ekleyin.",
|
||||
"hardware": "Altyapınızın CPU, bellek, disk kullanımını ve sıcaklığını izleyin. Capture uç nokta URL'si tam yolu /api/v1/metrics içermelidir (ör. http://192.168.1.10:5001/api/v1/metrics). Yetkilendirme anahtarına yalnızca token dizesini yapıştırın — 'Bearer' eklemeyin.",
|
||||
"dns": "Belirli bir DNS sunucusunun yanıt verip vermediğini izleyin."
|
||||
"hardware": "Altyapınızın CPU, bellek, disk kullanımını ve sıcaklığını izleyin. Capture uç nokta URL'si tam yolu /api/v1/metrics içermelidir (ör. http://192.168.1.10:5001/api/v1/metrics). Yetkilendirme anahtarına yalnızca token dizesini yapıştırın — 'Bearer' eklemeyin."
|
||||
}
|
||||
},
|
||||
"ignoreTls": {
|
||||
@@ -637,8 +601,7 @@
|
||||
"optionHttpDescription": "Web sitenizi veya API uç noktanızı izlemek için HTTP(S) kullanın.",
|
||||
"optionPingDescription": "Bir sunucunun çevrimiçi olup olmadığını izlemek için ICMP Ping kullanın.",
|
||||
"optionPortDescription": "Bir sunucuda belirli bir portun açık olup olmadığını izleyin.",
|
||||
"title": "Tür",
|
||||
"optionDnsDescription": "Belirli bir DNS sunucusunun yanıt verip vermediğini izleyin."
|
||||
"title": "Tür"
|
||||
},
|
||||
"thresholds": {
|
||||
"title": "Uyarı eşikleri",
|
||||
@@ -863,7 +826,7 @@
|
||||
},
|
||||
"tabs": {
|
||||
"labels": {
|
||||
"network": "Ağ",
|
||||
"network": "",
|
||||
"overview": "Genel bakış"
|
||||
}
|
||||
},
|
||||
@@ -946,8 +909,7 @@
|
||||
"lastFinishedAt": "Son tamamlanma zamanı",
|
||||
"lastRunTook": "Son çalışma süresi",
|
||||
"lastFailedAt": "Son başarısızlık zamanı",
|
||||
"failReason": "Başarısızlık nedeni",
|
||||
"state": "Durum"
|
||||
"failReason": "Başarısızlık nedeni"
|
||||
}
|
||||
},
|
||||
"queueFallback": {
|
||||
@@ -1137,10 +1099,6 @@
|
||||
"header": {
|
||||
"title": "PageSpeed izleyicileri",
|
||||
"description": "Core Web Vitals ve Lighthouse puanlarını zaman içinde izleyerek kullanıcılarınız fark etmeden gerilemeleri yakalayın."
|
||||
},
|
||||
"strategy": {
|
||||
"desktop": "Masaüstü",
|
||||
"mobile": "Mobil"
|
||||
}
|
||||
},
|
||||
"settings": {
|
||||
@@ -1243,7 +1201,7 @@
|
||||
"email": {
|
||||
"title": "E-posta ayarları",
|
||||
"description": "Sisteminiz için e-posta ayarlarını yapılandırın. Bu, bildirim ve uyarı göndermek için kullanılır.",
|
||||
"descriptionTransport": "Bu, NodeMailer için SMTP aktarımı oluşturur",
|
||||
"descriptionTransport": "",
|
||||
"descriptionTransportLink": "Özellikleri burada görün",
|
||||
"option": {
|
||||
"host": {
|
||||
@@ -1289,10 +1247,6 @@
|
||||
},
|
||||
"rejectUnauthorized": {
|
||||
"label": "Geçersiz sertifikaları reddet: Kendinden imzalı veya güvenilmeyen sertifikalı bağlantıları reddet"
|
||||
},
|
||||
"displayName": {
|
||||
"label": "Gönderen adı (isteğe bağlı) - Gönderen alanında gösterilen kullanıcı dostu ad",
|
||||
"placeholder": "Checkmate bildirimleri"
|
||||
}
|
||||
}
|
||||
},
|
||||
@@ -1353,20 +1307,6 @@
|
||||
"uptime": {
|
||||
"title": "Çalışma süresi",
|
||||
"responseTime": "Yanıt süresi"
|
||||
},
|
||||
"chart": {
|
||||
"avg": "ort {{value}}ms",
|
||||
"downTooltip": "Çalışmıyor",
|
||||
"heatmapAria": "Yanıt süresi ısı haritası",
|
||||
"max": "maks {{value}}ms"
|
||||
},
|
||||
"status": {
|
||||
"breached": "Eşik aşıldı",
|
||||
"down": "Çalışmıyor",
|
||||
"initializing": "Başlatılıyor",
|
||||
"maintenance": "Bakım",
|
||||
"paused": "Duraklatıldı",
|
||||
"up": "Çalışıyor"
|
||||
}
|
||||
},
|
||||
"statusBar": {
|
||||
@@ -1384,9 +1324,7 @@
|
||||
"maintenance": "Bazı sistemler bakımda",
|
||||
"partiallyPaused": "Bazı sistemler duraklatıldı",
|
||||
"initializing": "Bazı sistemler başlatılıyor",
|
||||
"noMonitors": "Hiç monitör yapılandırılmadı",
|
||||
"monitoringSummary": "{{count}} hizmet izleniyor · 10 saniyede bir güncellenir",
|
||||
"monitoringSummary_other": "{{count}} hizmet izleniyor · 10 saniyede bir güncellenir"
|
||||
"noMonitors": "Hiç monitör yapılandırılmadı"
|
||||
},
|
||||
"table": {
|
||||
"headers": {
|
||||
@@ -1477,47 +1415,11 @@
|
||||
"label": "Altyapı metriklerini göster"
|
||||
}
|
||||
}
|
||||
},
|
||||
"theme": {
|
||||
"description": "Genel durum sayfanız için görsel stili seçin.",
|
||||
"label": "Tema",
|
||||
"options": {
|
||||
"bold": {
|
||||
"description": "Büyük tipografi ve kendinden emin aralıklar. Marka odaklı sayfalar için harika.",
|
||||
"name": "Kalın"
|
||||
},
|
||||
"editorial": {
|
||||
"description": "Serifli başlıklar ve ince ayraçlar. Belirgin ve sakin.",
|
||||
"name": "Editöryal"
|
||||
},
|
||||
"modern": {
|
||||
"description": "Atan bir durum noktası ve yumuşakça solan kartlarla SaaS kalitesinde.",
|
||||
"name": "Modern"
|
||||
},
|
||||
"refined": {
|
||||
"description": "Temiz, profesyonel, klasik Checkmate görünümüne yakın.",
|
||||
"name": "Zarif"
|
||||
}
|
||||
},
|
||||
"title": "Sayfa teması"
|
||||
},
|
||||
"themeMode": {
|
||||
"auto": "Otomatik (ziyaretçinin cihazına göre)",
|
||||
"dark": "Yalnızca koyu",
|
||||
"label": "Tema modu",
|
||||
"light": "Yalnızca açık"
|
||||
}
|
||||
},
|
||||
"header": {
|
||||
"title": "Durum sayfaları",
|
||||
"description": "Müşterilerinize ve paydaşlarınıza gerçek zamanlı çalışma süresi ve olay geçmişini gösteren herkese açık sayfalar yayınlayın."
|
||||
},
|
||||
"editorial": {
|
||||
"allUp": "Tüm sistemler normal şekilde çalışıyor.",
|
||||
"reportTitle": "Hizmet raporu"
|
||||
},
|
||||
"footer": {
|
||||
"poweredBy": "Sağlayan"
|
||||
}
|
||||
},
|
||||
"uptime": {
|
||||
|
||||
+32
-130
@@ -73,9 +73,7 @@
|
||||
"paused": "призупинено",
|
||||
"na": "Н/Д",
|
||||
"resolved": "Вирішено",
|
||||
"responseTime": "Час відповіді",
|
||||
"idle": "Очікування",
|
||||
"running": "Виконується"
|
||||
"responseTime": "Час відповіді"
|
||||
},
|
||||
"form": {
|
||||
"role": {
|
||||
@@ -122,17 +120,6 @@
|
||||
"active": "Активний",
|
||||
"responseTime": "Час відповіді"
|
||||
}
|
||||
},
|
||||
"statusCode": {
|
||||
"down": "Не працює",
|
||||
"networkError": {
|
||||
"dns": "Не вдалося розв'язати ім'я хоста (пошук DNS не вдався).",
|
||||
"refused": "Сервер відхилив з'єднання (порт закрито або служба не слухає).",
|
||||
"reset": "З'єднання було скинуто до отримання відповіді.",
|
||||
"timeout": "Сервер не відповів вчасно (час очікування запиту вичерпано).",
|
||||
"tls": "Збій рукостискання TLS або SSL (проблема з сертифікатом або шифруванням).",
|
||||
"unknown": "HTTP-відповідь від цілі не отримана."
|
||||
}
|
||||
}
|
||||
},
|
||||
"components": {
|
||||
@@ -319,28 +306,28 @@
|
||||
"common": {
|
||||
"passwordRules": {
|
||||
"length": {
|
||||
"beginning": "Має бути щонайменше",
|
||||
"highlighted": "8 символів"
|
||||
"beginning": "",
|
||||
"highlighted": ""
|
||||
},
|
||||
"lowercase": {
|
||||
"beginning": "Має містити щонайменше",
|
||||
"highlighted": "одну малу літеру"
|
||||
"beginning": "",
|
||||
"highlighted": ""
|
||||
},
|
||||
"match": {
|
||||
"beginning": "Паролі",
|
||||
"highlighted": "мають збігатися"
|
||||
"beginning": "",
|
||||
"highlighted": ""
|
||||
},
|
||||
"number": {
|
||||
"beginning": "Має містити щонайменше",
|
||||
"highlighted": "одну цифру"
|
||||
"beginning": "",
|
||||
"highlighted": ""
|
||||
},
|
||||
"special": {
|
||||
"beginning": "Має містити щонайменше",
|
||||
"highlighted": "один спеціальний символ (!?@#$%^&*()-_=+[]{}|;:'\",./\\~`)"
|
||||
"beginning": "",
|
||||
"highlighted": ""
|
||||
},
|
||||
"uppercase": {
|
||||
"beginning": "Має містити щонайменше",
|
||||
"highlighted": "одну велику літеру"
|
||||
"beginning": "",
|
||||
"highlighted": ""
|
||||
}
|
||||
},
|
||||
"form": {
|
||||
@@ -465,8 +452,7 @@
|
||||
"optionPagespeed": "PageSpeed",
|
||||
"optionHardware": "Інфраструктура",
|
||||
"optionGrpc": "gRPC",
|
||||
"optionWebSocket": "WebSocket",
|
||||
"optionDns": "DNS"
|
||||
"optionWebSocket": "WebSocket"
|
||||
},
|
||||
"bulkPause": {
|
||||
"paused_one": "{{count}} монітор призупинено",
|
||||
@@ -476,8 +462,7 @@
|
||||
"alreadyPaused_one": "Вибраний монітор уже призупинено",
|
||||
"alreadyPaused_other": "Всі вибрані монітори уже призупинено",
|
||||
"alreadyRunning_one": "Вибраний монітор уже запущено",
|
||||
"alreadyRunning_other": "Всі вибрані монітори уже запущено",
|
||||
"partialFailure": "Оновлено {{successCount}} моніторів, але {{failedCount}} не вдалося синхронізувати з чергою завдань"
|
||||
"alreadyRunning_other": "Всі вибрані монітори уже запущено"
|
||||
}
|
||||
}
|
||||
},
|
||||
@@ -567,40 +552,19 @@
|
||||
"captureUrl": {
|
||||
"label": "Точка доступу Capture",
|
||||
"placeholder": "http://192.168.1.10:5001/api/v1/metrics"
|
||||
},
|
||||
"dnsRecordType": {
|
||||
"label": "Тип запису DNS",
|
||||
"value": {
|
||||
"A": "A",
|
||||
"AAAA": "AAAA",
|
||||
"CNAME": "CNAME",
|
||||
"MX": "MX",
|
||||
"NS": "NS",
|
||||
"TXT": "TXT"
|
||||
}
|
||||
},
|
||||
"dnsServer": {
|
||||
"label": "DNS-сервер",
|
||||
"placeholder": "8.8.8.8"
|
||||
},
|
||||
"strategy": {
|
||||
"desktop": "Десктоп",
|
||||
"label": "Стратегія",
|
||||
"mobile": "Мобільний"
|
||||
}
|
||||
},
|
||||
"title": "Загальні налаштування",
|
||||
"description": {
|
||||
"http": "Введіть URL або IP для моніторингу (напр., https://example.com/ або 192.168.1.100) та додайте зрозуміле ім'я для відображення на панелі.",
|
||||
"ping": "Введіть IP-адресу або ім'я хоста для пінгу (наприклад, 192.168.1.100 або example.com) і додайте чітку відображувану назву, що з'явиться на дашборді.",
|
||||
"port": "Введіть URL або IP сервера, номер порту та чітку відображувану назву, що з'явиться на дашборді.",
|
||||
"docker": "Введіть назву або ідентифікатор Docker-контейнера. Можна використовувати назву контейнера (наприклад, my-app) або ідентифікатор (повний 64-символьний або скорочений).",
|
||||
"ping": "",
|
||||
"port": "",
|
||||
"docker": "",
|
||||
"game": "Введіть IP-адресу або ім'я хоста та номер порту для пінгу (наприклад, 192.168.1.100 або example.com) і виберіть тип гри. Деяким іграм потрібно ввімкнути серверні запити у файлі конфігурації — перевірте документацію вашого ігрового сервера. Деталі протоколу див. у <gamedigLink>списку підтримуваних ігор</gamedigLink>.",
|
||||
"pagespeed": "Відстежуйте швидкість завантаження сторінки, показники Core Web Vitals та оцінки оптимізації Вашого сайту.",
|
||||
"grpc": "Введіть ім'я хоста та порт gRPC-сервера, за бажанням вкажіть назву сервісу для перевірки стану та додайте відображуване ім'я.",
|
||||
"websocket": "Введіть WebSocket URL для моніторингу (напр., wss://example.com/socket) та додайте відображуване ім'я.",
|
||||
"hardware": "Відстежуйте використання ЦП, пам'яті, диска та температуру вашої інфраструктури. URL точки доступу Capture має містити повний шлях /api/v1/metrics (наприклад, http://192.168.1.10:5001/api/v1/metrics). У секрет авторизації вставте лише рядок токена — не додавайте 'Bearer'.",
|
||||
"dns": "Стежте, чи відповідає певний DNS-сервер."
|
||||
"hardware": "Відстежуйте використання ЦП, пам'яті, диска та температуру вашої інфраструктури. URL точки доступу Capture має містити повний шлях /api/v1/metrics (наприклад, http://192.168.1.10:5001/api/v1/metrics). У секрет авторизації вставте лише рядок токена — не додавайте 'Bearer'."
|
||||
}
|
||||
},
|
||||
"ignoreTls": {
|
||||
@@ -637,8 +601,7 @@
|
||||
"optionHttpDescription": "Використовуйте HTTP(S) для моніторингу Вашого сайту або API-ендпоінту.",
|
||||
"optionPingDescription": "Використовуйте ICMP Ping для моніторингу доступності сервера.",
|
||||
"optionPortDescription": "Моніторинг відкритості конкретного порту на сервері.",
|
||||
"title": "Тип",
|
||||
"optionDnsDescription": "Стежте, чи відповідає певний DNS-сервер."
|
||||
"title": "Тип"
|
||||
},
|
||||
"thresholds": {
|
||||
"title": "Порогові значення сповіщень",
|
||||
@@ -802,7 +765,7 @@
|
||||
"headers": {
|
||||
"endTime": "Час завершення",
|
||||
"resolutionType": "Тип вирішення",
|
||||
"startTime": "Час початку",
|
||||
"startTime": "",
|
||||
"statusCode": "Код статусу"
|
||||
},
|
||||
"resolvedIncidents": "Вирішені інциденти",
|
||||
@@ -846,13 +809,13 @@
|
||||
}
|
||||
},
|
||||
"statBoxes": {
|
||||
"avgCpuTemperature": "Середня температура CPU",
|
||||
"cpuFrequency": "Частота CPU",
|
||||
"cpuLogical": "CPU (логічний)",
|
||||
"cpuPhysical": "CPU (фізичний)",
|
||||
"avgCpuTemperature": "",
|
||||
"cpuFrequency": "",
|
||||
"cpuLogical": "",
|
||||
"cpuPhysical": "",
|
||||
"disk": "Диск",
|
||||
"memory": "Пам'ять",
|
||||
"os": "ОС"
|
||||
"os": ""
|
||||
},
|
||||
"table": {
|
||||
"headers": {
|
||||
@@ -946,8 +909,7 @@
|
||||
"lastFinishedAt": "Останнє завершення",
|
||||
"lastRunTook": "Останній запуск тривав",
|
||||
"lastFailedAt": "Остання помилка",
|
||||
"failReason": "Причина помилки",
|
||||
"state": "Стан"
|
||||
"failReason": "Причина помилки"
|
||||
}
|
||||
},
|
||||
"queueFallback": {
|
||||
@@ -967,8 +929,8 @@
|
||||
},
|
||||
"table": {
|
||||
"headers": {
|
||||
"nextWindow": "Наступне вікно",
|
||||
"repeat": "Повторити"
|
||||
"nextWindow": "",
|
||||
"repeat": ""
|
||||
}
|
||||
},
|
||||
"form": {
|
||||
@@ -1070,7 +1032,7 @@
|
||||
},
|
||||
"telegram": {
|
||||
"title": "Налаштування Telegram",
|
||||
"description": "Налаштуйте свого Telegram-бота для надсилання сповіщень.",
|
||||
"description": "",
|
||||
"optionBotToken": "Токен бота",
|
||||
"placeholderBotToken": "123456789:ABCdefGhIJKlmNoPQRsTUVwxyZ",
|
||||
"optionChatId": "ID чату",
|
||||
@@ -1137,10 +1099,6 @@
|
||||
"header": {
|
||||
"title": "Монітори PageSpeed",
|
||||
"description": "Відстежуйте Core Web Vitals і оцінки Lighthouse у часі, щоб помітити регресії раніше за користувачів."
|
||||
},
|
||||
"strategy": {
|
||||
"desktop": "Десктоп",
|
||||
"mobile": "Мобільний"
|
||||
}
|
||||
},
|
||||
"settings": {
|
||||
@@ -1243,7 +1201,7 @@
|
||||
"email": {
|
||||
"title": "Налаштування пошти",
|
||||
"description": "Налаштуйте параметри електронної пошти для Вашої системи. Використовується для надсилання сповіщень та попереджень.",
|
||||
"descriptionTransport": "Це створює SMTP-транспорт для NodeMailer",
|
||||
"descriptionTransport": "",
|
||||
"descriptionTransportLink": "Дивіться специфікації тут",
|
||||
"option": {
|
||||
"host": {
|
||||
@@ -1289,10 +1247,6 @@
|
||||
},
|
||||
"rejectUnauthorized": {
|
||||
"label": "Відхиляти недійсні сертифікати: відхиляти з'єднання із самопідписаними або ненадійними сертифікатами"
|
||||
},
|
||||
"displayName": {
|
||||
"label": "Ім'я відправника (необов'язково) - Дружнє ім'я, що відображається в полі Від",
|
||||
"placeholder": "Сповіщення Checkmate"
|
||||
}
|
||||
}
|
||||
},
|
||||
@@ -1353,20 +1307,6 @@
|
||||
"uptime": {
|
||||
"title": "Час роботи",
|
||||
"responseTime": "Час відповіді"
|
||||
},
|
||||
"chart": {
|
||||
"avg": "сер {{value}}мс",
|
||||
"downTooltip": "Не працює",
|
||||
"heatmapAria": "Теплова карта часу відгуку",
|
||||
"max": "макс {{value}}мс"
|
||||
},
|
||||
"status": {
|
||||
"breached": "Перевищено поріг",
|
||||
"down": "Не працює",
|
||||
"initializing": "Ініціалізація",
|
||||
"maintenance": "Обслуговування",
|
||||
"paused": "Призупинено",
|
||||
"up": "Працює"
|
||||
}
|
||||
},
|
||||
"statusBar": {
|
||||
@@ -1384,9 +1324,7 @@
|
||||
"maintenance": "Деякі системи на техобслуговуванні",
|
||||
"partiallyPaused": "Деякі системи призупинено",
|
||||
"initializing": "Деякі системи ініціалізуються",
|
||||
"noMonitors": "Не налаштовано жодного монітора",
|
||||
"monitoringSummary": "Відстежується {{count}} сервіс · Оновлення кожні 10 секунд",
|
||||
"monitoringSummary_other": "Відстежується {{count}} сервісів · Оновлення кожні 10 секунд"
|
||||
"noMonitors": "Не налаштовано жодного монітора"
|
||||
},
|
||||
"table": {
|
||||
"headers": {
|
||||
@@ -1477,47 +1415,11 @@
|
||||
"label": "Показувати метрики інфраструктури"
|
||||
}
|
||||
}
|
||||
},
|
||||
"theme": {
|
||||
"description": "Виберіть візуальний стиль для вашої публічної сторінки стану.",
|
||||
"label": "Тема",
|
||||
"options": {
|
||||
"bold": {
|
||||
"description": "Велика типографіка та впевнені відступи. Чудово для брендових сторінок.",
|
||||
"name": "Жирний"
|
||||
},
|
||||
"editorial": {
|
||||
"description": "Заголовки з засічками та тонкі роздільники. Відмінний і спокійний.",
|
||||
"name": "Редакційний"
|
||||
},
|
||||
"modern": {
|
||||
"description": "Рівень SaaS з пульсуючою крапкою стану та м'яко зникаючими картками.",
|
||||
"name": "Сучасний"
|
||||
},
|
||||
"refined": {
|
||||
"description": "Чистий, професійний, близький до класичного вигляду Checkmate.",
|
||||
"name": "Витончений"
|
||||
}
|
||||
},
|
||||
"title": "Тема сторінки"
|
||||
},
|
||||
"themeMode": {
|
||||
"auto": "Авто (за пристроєм відвідувача)",
|
||||
"dark": "Тільки темна",
|
||||
"label": "Режим теми",
|
||||
"light": "Тільки світла"
|
||||
}
|
||||
},
|
||||
"header": {
|
||||
"title": "Сторінки статусу",
|
||||
"description": "Публікуйте публічні сторінки з часом роботи в реальному часі та історією інцидентів для клієнтів і зацікавлених сторін."
|
||||
},
|
||||
"editorial": {
|
||||
"allUp": "Усі системи працюють у нормальному режимі.",
|
||||
"reportTitle": "Звіт про обслуговування"
|
||||
},
|
||||
"footer": {
|
||||
"poweredBy": "Працює на"
|
||||
}
|
||||
},
|
||||
"uptime": {
|
||||
|
||||
+32
-130
@@ -73,9 +73,7 @@
|
||||
"paused": "tạm dừng",
|
||||
"na": "N/A",
|
||||
"resolved": "Đã giải quyết",
|
||||
"responseTime": "Thời gian phản hồi",
|
||||
"idle": "Không hoạt động",
|
||||
"running": "Đang chạy"
|
||||
"responseTime": "Thời gian phản hồi"
|
||||
},
|
||||
"form": {
|
||||
"role": {
|
||||
@@ -122,17 +120,6 @@
|
||||
"active": "Đang hoạt động",
|
||||
"responseTime": "Thời gian phản hồi"
|
||||
}
|
||||
},
|
||||
"statusCode": {
|
||||
"down": "Ngừng hoạt động",
|
||||
"networkError": {
|
||||
"dns": "Không thể phân giải tên máy chủ (tra cứu DNS thất bại).",
|
||||
"refused": "Máy chủ từ chối kết nối (cổng đã đóng hoặc dịch vụ không lắng nghe).",
|
||||
"reset": "Kết nối đã được đặt lại trước khi nhận được phản hồi.",
|
||||
"timeout": "Máy chủ không phản hồi kịp thời (yêu cầu hết thời gian chờ).",
|
||||
"tls": "Bắt tay TLS hoặc SSL thất bại (vấn đề chứng chỉ hoặc mã hóa).",
|
||||
"unknown": "Không nhận được phản hồi HTTP từ mục tiêu."
|
||||
}
|
||||
}
|
||||
},
|
||||
"components": {
|
||||
@@ -319,28 +306,28 @@
|
||||
"common": {
|
||||
"passwordRules": {
|
||||
"length": {
|
||||
"beginning": "Phải có ít nhất",
|
||||
"highlighted": "8 ký tự"
|
||||
"beginning": "",
|
||||
"highlighted": ""
|
||||
},
|
||||
"lowercase": {
|
||||
"beginning": "Phải chứa ít nhất",
|
||||
"highlighted": "một chữ thường"
|
||||
"beginning": "",
|
||||
"highlighted": ""
|
||||
},
|
||||
"match": {
|
||||
"beginning": "Mật khẩu",
|
||||
"highlighted": "phải khớp"
|
||||
"beginning": "",
|
||||
"highlighted": ""
|
||||
},
|
||||
"number": {
|
||||
"beginning": "Phải chứa ít nhất",
|
||||
"highlighted": "một chữ số"
|
||||
"beginning": "",
|
||||
"highlighted": ""
|
||||
},
|
||||
"special": {
|
||||
"beginning": "Phải chứa ít nhất",
|
||||
"highlighted": "một ký tự đặc biệt (!?@#$%^&*()-_=+[]{}|;:'\",./\\~`)"
|
||||
"beginning": "",
|
||||
"highlighted": ""
|
||||
},
|
||||
"uppercase": {
|
||||
"beginning": "Phải chứa ít nhất",
|
||||
"highlighted": "một chữ hoa"
|
||||
"beginning": "",
|
||||
"highlighted": ""
|
||||
}
|
||||
},
|
||||
"form": {
|
||||
@@ -465,8 +452,7 @@
|
||||
"optionPagespeed": "PageSpeed",
|
||||
"optionHardware": "Hạ tầng",
|
||||
"optionGrpc": "gRPC",
|
||||
"optionWebSocket": "WebSocket",
|
||||
"optionDns": "DNS"
|
||||
"optionWebSocket": "WebSocket"
|
||||
},
|
||||
"bulkPause": {
|
||||
"paused_one": "Đã tạm dừng {{count}} màn hình",
|
||||
@@ -476,8 +462,7 @@
|
||||
"alreadyPaused_one": "Màn hình đã chọn đã được tạm dừng",
|
||||
"alreadyPaused_other": "Tất cả các màn hình đã chọn đã được tạm dừng",
|
||||
"alreadyRunning_one": "Màn hình đã chọn đã đang chạy",
|
||||
"alreadyRunning_other": "Tất cả các màn hình đã chọn đã đang chạy",
|
||||
"partialFailure": "Đã cập nhật {{successCount}} trình giám sát, nhưng {{failedCount}} trình giám sát không thể đồng bộ hóa với hàng đợi công việc"
|
||||
"alreadyRunning_other": "Tất cả các màn hình đã chọn đã đang chạy"
|
||||
}
|
||||
}
|
||||
},
|
||||
@@ -567,40 +552,19 @@
|
||||
"captureUrl": {
|
||||
"label": "Điểm cuối Capture",
|
||||
"placeholder": "http://192.168.1.10:5001/api/v1/metrics"
|
||||
},
|
||||
"dnsRecordType": {
|
||||
"label": "Loại bản ghi DNS",
|
||||
"value": {
|
||||
"A": "A",
|
||||
"AAAA": "AAAA",
|
||||
"CNAME": "CNAME",
|
||||
"MX": "MX",
|
||||
"NS": "NS",
|
||||
"TXT": "TXT"
|
||||
}
|
||||
},
|
||||
"dnsServer": {
|
||||
"label": "Máy chủ DNS",
|
||||
"placeholder": "8.8.8.8"
|
||||
},
|
||||
"strategy": {
|
||||
"desktop": "Máy tính để bàn",
|
||||
"label": "Chiến lược",
|
||||
"mobile": "Di động"
|
||||
}
|
||||
},
|
||||
"title": "Cài đặt chung",
|
||||
"description": {
|
||||
"http": "Nhập URL hoặc IP cần giám sát (vd: https://example.com/ hoặc 192.168.1.100) và thêm tên hiển thị rõ ràng trên bảng điều khiển.",
|
||||
"ping": "Nhập địa chỉ IP hoặc tên máy chủ để ping (ví dụ: 192.168.1.100 hoặc example.com) và thêm tên hiển thị rõ ràng xuất hiện trên bảng điều khiển.",
|
||||
"port": "Nhập URL hoặc IP của máy chủ, số cổng và tên hiển thị rõ ràng xuất hiện trên bảng điều khiển.",
|
||||
"docker": "Nhập tên hoặc ID của container Docker. Bạn có thể sử dụng tên container (ví dụ: my-app) hoặc ID container (ID đầy đủ 64 ký tự hoặc ID ngắn).",
|
||||
"ping": "",
|
||||
"port": "",
|
||||
"docker": "",
|
||||
"game": "Nhập địa chỉ IP hoặc tên máy chủ và số cổng để ping (ví dụ: 192.168.1.100 hoặc example.com) và chọn loại trò chơi. Một số trò chơi yêu cầu bật truy vấn máy chủ trong tệp cấu hình của chúng — hãy xem tài liệu của máy chủ trò chơi. Xem <gamedigLink>danh sách các trò chơi được hỗ trợ</gamedigLink> để biết chi tiết giao thức.",
|
||||
"pagespeed": "Theo dõi hiệu suất tải trang, Core Web Vitals và điểm tối ưu hóa cho trang web của bạn.",
|
||||
"grpc": "Nhập tên máy chủ và cổng của máy chủ gRPC, tùy chọn chỉ định tên dịch vụ cho kiểm tra sức khỏe và thêm tên hiển thị.",
|
||||
"websocket": "Nhập URL WebSocket cần giám sát (vd: wss://example.com/socket) và thêm tên hiển thị.",
|
||||
"hardware": "Giám sát mức sử dụng CPU, bộ nhớ, ổ đĩa và nhiệt độ của hạ tầng. URL điểm cuối Capture phải bao gồm đường dẫn đầy đủ /api/v1/metrics (ví dụ: http://192.168.1.10:5001/api/v1/metrics). Đối với khóa xác thực, chỉ dán chuỗi token — không bao gồm 'Bearer'.",
|
||||
"dns": "Giám sát xem một máy chủ DNS cụ thể có phản hồi hay không."
|
||||
"hardware": "Giám sát mức sử dụng CPU, bộ nhớ, ổ đĩa và nhiệt độ của hạ tầng. URL điểm cuối Capture phải bao gồm đường dẫn đầy đủ /api/v1/metrics (ví dụ: http://192.168.1.10:5001/api/v1/metrics). Đối với khóa xác thực, chỉ dán chuỗi token — không bao gồm 'Bearer'."
|
||||
}
|
||||
},
|
||||
"ignoreTls": {
|
||||
@@ -637,8 +601,7 @@
|
||||
"optionHttpDescription": "Sử dụng HTTP(S) để giám sát trang web hoặc điểm cuối API của bạn.",
|
||||
"optionPingDescription": "Sử dụng ICMP Ping để giám sát xem máy chủ có trực tuyến không.",
|
||||
"optionPortDescription": "Giám sát xem một cổng cụ thể trên máy chủ có mở không.",
|
||||
"title": "Loại",
|
||||
"optionDnsDescription": "Giám sát xem một máy chủ DNS cụ thể có phản hồi hay không."
|
||||
"title": "Loại"
|
||||
},
|
||||
"thresholds": {
|
||||
"title": "Ngưỡng cảnh báo",
|
||||
@@ -802,7 +765,7 @@
|
||||
"headers": {
|
||||
"endTime": "Thời gian kết thúc",
|
||||
"resolutionType": "Loại giải quyết",
|
||||
"startTime": "Thời gian bắt đầu",
|
||||
"startTime": "",
|
||||
"statusCode": "Mã trạng thái"
|
||||
},
|
||||
"resolvedIncidents": "Sự cố đã giải quyết",
|
||||
@@ -846,13 +809,13 @@
|
||||
}
|
||||
},
|
||||
"statBoxes": {
|
||||
"avgCpuTemperature": "Nhiệt độ CPU trung bình",
|
||||
"cpuFrequency": "Tần số CPU",
|
||||
"cpuLogical": "CPU (logic)",
|
||||
"cpuPhysical": "CPU (vật lý)",
|
||||
"avgCpuTemperature": "",
|
||||
"cpuFrequency": "",
|
||||
"cpuLogical": "",
|
||||
"cpuPhysical": "",
|
||||
"disk": "Ổ đĩa",
|
||||
"memory": "Bộ nhớ",
|
||||
"os": "Hệ điều hành"
|
||||
"os": ""
|
||||
},
|
||||
"table": {
|
||||
"headers": {
|
||||
@@ -946,8 +909,7 @@
|
||||
"lastFinishedAt": "Hoàn thành lần cuối lúc",
|
||||
"lastRunTook": "Lần chạy cuối mất",
|
||||
"lastFailedAt": "Lỗi lần cuối lúc",
|
||||
"failReason": "Lý do lỗi",
|
||||
"state": "Trạng thái"
|
||||
"failReason": "Lý do lỗi"
|
||||
}
|
||||
},
|
||||
"queueFallback": {
|
||||
@@ -967,8 +929,8 @@
|
||||
},
|
||||
"table": {
|
||||
"headers": {
|
||||
"nextWindow": "Cửa sổ tiếp theo",
|
||||
"repeat": "Lặp lại"
|
||||
"nextWindow": "",
|
||||
"repeat": ""
|
||||
}
|
||||
},
|
||||
"form": {
|
||||
@@ -1070,7 +1032,7 @@
|
||||
},
|
||||
"telegram": {
|
||||
"title": "Cấu hình Telegram",
|
||||
"description": "Cấu hình bot Telegram của bạn để gửi thông báo.",
|
||||
"description": "",
|
||||
"optionBotToken": "Token bot",
|
||||
"placeholderBotToken": "123456789:ABCdefGhIJKlmNoPQRsTUVwxyZ",
|
||||
"optionChatId": "ID cuộc trò chuyện",
|
||||
@@ -1137,10 +1099,6 @@
|
||||
"header": {
|
||||
"title": "Trình giám sát PageSpeed",
|
||||
"description": "Theo dõi Core Web Vitals và điểm Lighthouse theo thời gian để phát hiện sự suy giảm trước khi người dùng nhận ra."
|
||||
},
|
||||
"strategy": {
|
||||
"desktop": "Máy tính để bàn",
|
||||
"mobile": "Di động"
|
||||
}
|
||||
},
|
||||
"settings": {
|
||||
@@ -1243,7 +1201,7 @@
|
||||
"email": {
|
||||
"title": "Cài đặt email",
|
||||
"description": "Cấu hình cài đặt email cho hệ thống. Được sử dụng để gửi thông báo và cảnh báo.",
|
||||
"descriptionTransport": "Điều này xây dựng một SMTP transport cho NodeMailer",
|
||||
"descriptionTransport": "",
|
||||
"descriptionTransportLink": "Xem thông số kỹ thuật tại đây",
|
||||
"option": {
|
||||
"host": {
|
||||
@@ -1289,10 +1247,6 @@
|
||||
},
|
||||
"rejectUnauthorized": {
|
||||
"label": "Từ chối chứng chỉ không hợp lệ: Từ chối kết nối với chứng chỉ tự ký hoặc không đáng tin cậy"
|
||||
},
|
||||
"displayName": {
|
||||
"label": "Tên người gửi (tùy chọn) - Tên thân thiện hiển thị trong trường Từ",
|
||||
"placeholder": "Thông báo Checkmate"
|
||||
}
|
||||
}
|
||||
},
|
||||
@@ -1353,20 +1307,6 @@
|
||||
"uptime": {
|
||||
"title": "Thời gian hoạt động",
|
||||
"responseTime": "Thời gian phản hồi"
|
||||
},
|
||||
"chart": {
|
||||
"avg": "TB {{value}}ms",
|
||||
"downTooltip": "Ngừng hoạt động",
|
||||
"heatmapAria": "Bản đồ nhiệt thời gian phản hồi",
|
||||
"max": "tối đa {{value}}ms"
|
||||
},
|
||||
"status": {
|
||||
"breached": "Vượt ngưỡng",
|
||||
"down": "Ngừng hoạt động",
|
||||
"initializing": "Đang khởi tạo",
|
||||
"maintenance": "Bảo trì",
|
||||
"paused": "Tạm dừng",
|
||||
"up": "Hoạt động"
|
||||
}
|
||||
},
|
||||
"statusBar": {
|
||||
@@ -1384,9 +1324,7 @@
|
||||
"maintenance": "Một số hệ thống đang bảo trì",
|
||||
"partiallyPaused": "Một số hệ thống đã tạm dừng",
|
||||
"initializing": "Một số hệ thống đang khởi tạo",
|
||||
"noMonitors": "Chưa cấu hình màn hình giám sát nào",
|
||||
"monitoringSummary": "Đang giám sát {{count}} dịch vụ · Cập nhật mỗi 10 giây",
|
||||
"monitoringSummary_other": "Đang giám sát {{count}} dịch vụ · Cập nhật mỗi 10 giây"
|
||||
"noMonitors": "Chưa cấu hình màn hình giám sát nào"
|
||||
},
|
||||
"table": {
|
||||
"headers": {
|
||||
@@ -1477,47 +1415,11 @@
|
||||
"label": "Hiển thị số liệu hạ tầng"
|
||||
}
|
||||
}
|
||||
},
|
||||
"theme": {
|
||||
"description": "Chọn kiểu hiển thị cho trang trạng thái công khai của bạn.",
|
||||
"label": "Chủ đề",
|
||||
"options": {
|
||||
"bold": {
|
||||
"description": "Kiểu chữ lớn và khoảng cách tự tin. Tuyệt vời cho các trang tập trung vào thương hiệu.",
|
||||
"name": "Đậm"
|
||||
},
|
||||
"editorial": {
|
||||
"description": "Tiêu đề serif và dải phân cách mỏng. Đặc biệt và tĩnh lặng.",
|
||||
"name": "Biên tập"
|
||||
},
|
||||
"modern": {
|
||||
"description": "Chất lượng SaaS với chấm trạng thái nhấp nháy và thẻ mờ dần nhẹ nhàng.",
|
||||
"name": "Hiện đại"
|
||||
},
|
||||
"refined": {
|
||||
"description": "Sạch sẽ, chuyên nghiệp, gần với giao diện Checkmate cổ điển.",
|
||||
"name": "Tinh tế"
|
||||
}
|
||||
},
|
||||
"title": "Chủ đề trang"
|
||||
},
|
||||
"themeMode": {
|
||||
"auto": "Tự động (theo thiết bị của khách)",
|
||||
"dark": "Chỉ tối",
|
||||
"label": "Chế độ chủ đề",
|
||||
"light": "Chỉ sáng"
|
||||
}
|
||||
},
|
||||
"header": {
|
||||
"title": "Trang trạng thái",
|
||||
"description": "Công bố các trang công khai cho khách hàng và các bên liên quan thấy thời gian hoạt động theo thời gian thực và lịch sử sự cố."
|
||||
},
|
||||
"editorial": {
|
||||
"allUp": "Tất cả các hệ thống đang hoạt động bình thường.",
|
||||
"reportTitle": "Báo cáo dịch vụ"
|
||||
},
|
||||
"footer": {
|
||||
"poweredBy": "Được cung cấp bởi"
|
||||
}
|
||||
},
|
||||
"uptime": {
|
||||
|
||||
@@ -73,9 +73,7 @@
|
||||
"paused": "已暂停",
|
||||
"na": "不适用",
|
||||
"resolved": "已解决",
|
||||
"responseTime": "响应时间",
|
||||
"idle": "空闲",
|
||||
"running": "运行中"
|
||||
"responseTime": "响应时间"
|
||||
},
|
||||
"form": {
|
||||
"role": {
|
||||
@@ -122,17 +120,6 @@
|
||||
"active": "活跃",
|
||||
"responseTime": "响应时间"
|
||||
}
|
||||
},
|
||||
"statusCode": {
|
||||
"down": "宕机",
|
||||
"networkError": {
|
||||
"dns": "无法解析主机名(DNS查找失败)。",
|
||||
"refused": "服务器拒绝连接(端口关闭或服务未监听)。",
|
||||
"reset": "在收到响应之前连接被重置。",
|
||||
"timeout": "服务器未及时响应(请求超时)。",
|
||||
"tls": "TLS或SSL握手失败(证书或加密问题)。",
|
||||
"unknown": "未从目标接收HTTP响应。"
|
||||
}
|
||||
}
|
||||
},
|
||||
"components": {
|
||||
@@ -465,8 +452,7 @@
|
||||
"optionPagespeed": "PageSpeed",
|
||||
"optionHardware": "基础设施",
|
||||
"optionGrpc": "gRPC",
|
||||
"optionWebSocket": "WebSocket",
|
||||
"optionDns": "DNS"
|
||||
"optionWebSocket": "WebSocket"
|
||||
},
|
||||
"bulkPause": {
|
||||
"paused_one": "已暂停 {{count}} 个监视器",
|
||||
@@ -476,8 +462,7 @@
|
||||
"alreadyPaused_one": "所选监视器已暂停",
|
||||
"alreadyPaused_other": "所有选定的监视器均已暂停",
|
||||
"alreadyRunning_one": "所选监视器已经在运行",
|
||||
"alreadyRunning_other": "所有选定的监视器均已在运行",
|
||||
"partialFailure": "已更新 {{successCount}} 个监控,但有 {{failedCount}} 个无法与任务队列同步"
|
||||
"alreadyRunning_other": "所有选定的监视器均已在运行"
|
||||
}
|
||||
}
|
||||
},
|
||||
@@ -567,26 +552,6 @@
|
||||
"captureUrl": {
|
||||
"label": "Capture 端点",
|
||||
"placeholder": "http://192.168.1.10:5001/api/v1/metrics"
|
||||
},
|
||||
"dnsRecordType": {
|
||||
"label": "DNS记录类型",
|
||||
"value": {
|
||||
"A": "A",
|
||||
"AAAA": "AAAA",
|
||||
"CNAME": "CNAME",
|
||||
"MX": "MX",
|
||||
"NS": "NS",
|
||||
"TXT": "TXT"
|
||||
}
|
||||
},
|
||||
"dnsServer": {
|
||||
"label": "DNS服务器",
|
||||
"placeholder": "8.8.8.8"
|
||||
},
|
||||
"strategy": {
|
||||
"desktop": "桌面",
|
||||
"label": "策略",
|
||||
"mobile": "移动端"
|
||||
}
|
||||
},
|
||||
"title": "常规设置",
|
||||
@@ -599,8 +564,7 @@
|
||||
"pagespeed": "跟踪网站的页面加载性能、Core Web Vitals 和优化评分。",
|
||||
"grpc": "输入 gRPC 服务器的主机名和端口,可选指定健康检查的服务名称,并添加显示名称。",
|
||||
"websocket": "输入要监控的 WebSocket URL(例如 wss://example.com/socket),并添加显示名称。",
|
||||
"hardware": "监控基础设施的 CPU、内存、磁盘使用情况和温度。Capture 端点 URL 必须包含完整路径 /api/v1/metrics(例如 http://192.168.1.10:5001/api/v1/metrics)。授权密钥只需粘贴令牌字符串——请勿包含 'Bearer'。",
|
||||
"dns": "监控特定DNS服务器是否响应。"
|
||||
"hardware": "监控基础设施的 CPU、内存、磁盘使用情况和温度。Capture 端点 URL 必须包含完整路径 /api/v1/metrics(例如 http://192.168.1.10:5001/api/v1/metrics)。授权密钥只需粘贴令牌字符串——请勿包含 'Bearer'。"
|
||||
}
|
||||
},
|
||||
"ignoreTls": {
|
||||
@@ -637,8 +601,7 @@
|
||||
"optionHttpDescription": "使用 HTTP(S) 监控您的网站或 API 端点。",
|
||||
"optionPingDescription": "使用 ICMP Ping 监控服务器是否在线。",
|
||||
"optionPortDescription": "监控服务器上的特定端口是否开放。",
|
||||
"title": "类型",
|
||||
"optionDnsDescription": "监控特定DNS服务器是否响应。"
|
||||
"title": "类型"
|
||||
},
|
||||
"thresholds": {
|
||||
"title": "告警阈值",
|
||||
@@ -946,8 +909,7 @@
|
||||
"lastFinishedAt": "上次完成于",
|
||||
"lastRunTook": "上次运行耗时",
|
||||
"lastFailedAt": "上次失败于",
|
||||
"failReason": "失败原因",
|
||||
"state": "状态"
|
||||
"failReason": "失败原因"
|
||||
}
|
||||
},
|
||||
"queueFallback": {
|
||||
@@ -1137,10 +1099,6 @@
|
||||
"header": {
|
||||
"title": "PageSpeed 监控器",
|
||||
"description": "持续追踪 Core Web Vitals 和 Lighthouse 评分,在用户察觉之前发现性能回退。"
|
||||
},
|
||||
"strategy": {
|
||||
"desktop": "桌面",
|
||||
"mobile": "移动端"
|
||||
}
|
||||
},
|
||||
"settings": {
|
||||
@@ -1289,10 +1247,6 @@
|
||||
},
|
||||
"rejectUnauthorized": {
|
||||
"label": "拒绝无效证书:拒绝自签名或不受信任证书的连接"
|
||||
},
|
||||
"displayName": {
|
||||
"label": "发件人姓名(可选)- 显示在发件人字段中的友好名称",
|
||||
"placeholder": "Checkmate通知"
|
||||
}
|
||||
}
|
||||
},
|
||||
@@ -1353,20 +1307,6 @@
|
||||
"uptime": {
|
||||
"title": "正常运行时间",
|
||||
"responseTime": "响应时间"
|
||||
},
|
||||
"chart": {
|
||||
"avg": "平均 {{value}}ms",
|
||||
"downTooltip": "宕机",
|
||||
"heatmapAria": "响应时间热图",
|
||||
"max": "最大 {{value}}ms"
|
||||
},
|
||||
"status": {
|
||||
"breached": "超出阈值",
|
||||
"down": "宕机",
|
||||
"initializing": "初始化中",
|
||||
"maintenance": "维护中",
|
||||
"paused": "已暂停",
|
||||
"up": "运行中"
|
||||
}
|
||||
},
|
||||
"statusBar": {
|
||||
@@ -1384,9 +1324,7 @@
|
||||
"maintenance": "部分系统正在维护",
|
||||
"partiallyPaused": "部分系统已暂停",
|
||||
"initializing": "部分系统正在初始化",
|
||||
"noMonitors": "尚未配置任何监控器",
|
||||
"monitoringSummary": "正在监控{{count}}个服务 · 每10秒更新一次",
|
||||
"monitoringSummary_other": "正在监控{{count}}个服务 · 每10秒更新一次"
|
||||
"noMonitors": "尚未配置任何监控器"
|
||||
},
|
||||
"table": {
|
||||
"headers": {
|
||||
@@ -1477,47 +1415,11 @@
|
||||
"label": "显示基础设施指标"
|
||||
}
|
||||
}
|
||||
},
|
||||
"theme": {
|
||||
"description": "为您的公共状态页面选择视觉样式。",
|
||||
"label": "主题",
|
||||
"options": {
|
||||
"bold": {
|
||||
"description": "大字体和自信的间距。非常适合品牌导向的页面。",
|
||||
"name": "粗体"
|
||||
},
|
||||
"editorial": {
|
||||
"description": "衬线标题和细分隔线。独特而平静。",
|
||||
"name": "编辑风格"
|
||||
},
|
||||
"modern": {
|
||||
"description": "SaaS级品质,带有脉动状态点和柔和褪色卡片。",
|
||||
"name": "现代"
|
||||
},
|
||||
"refined": {
|
||||
"description": "干净、专业,接近经典Checkmate外观。",
|
||||
"name": "精致"
|
||||
}
|
||||
},
|
||||
"title": "页面主题"
|
||||
},
|
||||
"themeMode": {
|
||||
"auto": "自动(跟随访客设备)",
|
||||
"dark": "仅深色",
|
||||
"label": "主题模式",
|
||||
"light": "仅浅色"
|
||||
}
|
||||
},
|
||||
"header": {
|
||||
"title": "状态页面",
|
||||
"description": "发布公开页面,向客户和利益相关者展示实时运行情况和事件历史。"
|
||||
},
|
||||
"editorial": {
|
||||
"allUp": "所有系统运行正常。",
|
||||
"reportTitle": "服务报告"
|
||||
},
|
||||
"footer": {
|
||||
"poweredBy": "技术支持"
|
||||
}
|
||||
},
|
||||
"uptime": {
|
||||
|
||||
@@ -73,9 +73,7 @@
|
||||
"paused": "已暫停",
|
||||
"na": "N/A",
|
||||
"resolved": "已解決",
|
||||
"responseTime": "回應時間",
|
||||
"idle": "閒置",
|
||||
"running": "執行中"
|
||||
"responseTime": "回應時間"
|
||||
},
|
||||
"form": {
|
||||
"role": {
|
||||
@@ -122,17 +120,6 @@
|
||||
"active": "啟用中",
|
||||
"responseTime": "回應時間"
|
||||
}
|
||||
},
|
||||
"statusCode": {
|
||||
"down": "停機",
|
||||
"networkError": {
|
||||
"dns": "無法解析主機名稱(DNS查詢失敗)。",
|
||||
"refused": "伺服器拒絕連線(連接埠關閉或服務未監聽)。",
|
||||
"reset": "在收到回應之前連線被重設。",
|
||||
"timeout": "伺服器未及時回應(請求逾時)。",
|
||||
"tls": "TLS或SSL交握失敗(憑證或加密問題)。",
|
||||
"unknown": "未從目標接收HTTP回應。"
|
||||
}
|
||||
}
|
||||
},
|
||||
"components": {
|
||||
@@ -465,8 +452,7 @@
|
||||
"optionPagespeed": "PageSpeed",
|
||||
"optionHardware": "基礎架構",
|
||||
"optionGrpc": "gRPC",
|
||||
"optionWebSocket": "WebSocket",
|
||||
"optionDns": "DNS"
|
||||
"optionWebSocket": "WebSocket"
|
||||
},
|
||||
"bulkPause": {
|
||||
"paused_one": "已暫停 {{count}} 個監視器",
|
||||
@@ -476,8 +462,7 @@
|
||||
"alreadyPaused_one": "所選監視器已暫停",
|
||||
"alreadyPaused_other": "所有選定的監視器均已暫停",
|
||||
"alreadyRunning_one": "所選監視器已經在運行",
|
||||
"alreadyRunning_other": "所有選定的監視器均已在運行",
|
||||
"partialFailure": "已更新 {{successCount}} 個監控,但有 {{failedCount}} 個無法與工作佇列同步"
|
||||
"alreadyRunning_other": "所有選定的監視器均已在運行"
|
||||
}
|
||||
}
|
||||
},
|
||||
@@ -567,26 +552,6 @@
|
||||
"captureUrl": {
|
||||
"label": "Capture 端點",
|
||||
"placeholder": "http://192.168.1.10:5001/api/v1/metrics"
|
||||
},
|
||||
"dnsRecordType": {
|
||||
"label": "DNS記錄類型",
|
||||
"value": {
|
||||
"A": "A",
|
||||
"AAAA": "AAAA",
|
||||
"CNAME": "CNAME",
|
||||
"MX": "MX",
|
||||
"NS": "NS",
|
||||
"TXT": "TXT"
|
||||
}
|
||||
},
|
||||
"dnsServer": {
|
||||
"label": "DNS伺服器",
|
||||
"placeholder": "8.8.8.8"
|
||||
},
|
||||
"strategy": {
|
||||
"desktop": "桌面",
|
||||
"label": "策略",
|
||||
"mobile": "行動裝置"
|
||||
}
|
||||
},
|
||||
"title": "一般設定",
|
||||
@@ -599,8 +564,7 @@
|
||||
"pagespeed": "追蹤您網站的頁面載入效能、Core Web Vitals 和最佳化分數。",
|
||||
"grpc": "輸入 gRPC 伺服器的主機名稱和連接埠,可選擇指定健康檢查的服務名稱,並新增一個顯示名稱。",
|
||||
"websocket": "輸入要監控的 WebSocket URL(例如 wss://example.com/socket),並新增一個顯示名稱。",
|
||||
"hardware": "監控基礎架構的 CPU、記憶體、磁碟使用情況和溫度。Capture 端點 URL 必須包含完整路徑 /api/v1/metrics(例如 http://192.168.1.10:5001/api/v1/metrics)。授權密鑰僅貼上權杖字串——請勿包含 'Bearer'。",
|
||||
"dns": "監控特定DNS伺服器是否回應。"
|
||||
"hardware": "監控基礎架構的 CPU、記憶體、磁碟使用情況和溫度。Capture 端點 URL 必須包含完整路徑 /api/v1/metrics(例如 http://192.168.1.10:5001/api/v1/metrics)。授權密鑰僅貼上權杖字串——請勿包含 'Bearer'。"
|
||||
}
|
||||
},
|
||||
"ignoreTls": {
|
||||
@@ -637,8 +601,7 @@
|
||||
"optionHttpDescription": "使用 HTTP(S) 監控您的網站或 API 端點。",
|
||||
"optionPingDescription": "使用 ICMP Ping 監控伺服器是否上線。",
|
||||
"optionPortDescription": "監控伺服器上的特定連接埠是否開啟。",
|
||||
"title": "類型",
|
||||
"optionDnsDescription": "監控特定DNS伺服器是否回應。"
|
||||
"title": "類型"
|
||||
},
|
||||
"thresholds": {
|
||||
"title": "警報閾值",
|
||||
@@ -946,8 +909,7 @@
|
||||
"lastFinishedAt": "最後完成於",
|
||||
"lastRunTook": "最後執行耗時",
|
||||
"lastFailedAt": "最後失敗於",
|
||||
"failReason": "失敗原因",
|
||||
"state": "狀態"
|
||||
"failReason": "失敗原因"
|
||||
}
|
||||
},
|
||||
"queueFallback": {
|
||||
@@ -1137,10 +1099,6 @@
|
||||
"header": {
|
||||
"title": "PageSpeed 監視器",
|
||||
"description": "持續追蹤 Core Web Vitals 與 Lighthouse 評分,在使用者察覺前發現效能退化。"
|
||||
},
|
||||
"strategy": {
|
||||
"desktop": "桌面",
|
||||
"mobile": "行動裝置"
|
||||
}
|
||||
},
|
||||
"settings": {
|
||||
@@ -1289,10 +1247,6 @@
|
||||
},
|
||||
"rejectUnauthorized": {
|
||||
"label": "拒絕無效憑證:拒絕使用自簽或不受信任憑證的連線"
|
||||
},
|
||||
"displayName": {
|
||||
"label": "寄件者名稱(選填)- 顯示在寄件者欄位的友善名稱",
|
||||
"placeholder": "Checkmate通知"
|
||||
}
|
||||
}
|
||||
},
|
||||
@@ -1353,20 +1307,6 @@
|
||||
"uptime": {
|
||||
"title": "正常運行時間",
|
||||
"responseTime": "回應時間"
|
||||
},
|
||||
"chart": {
|
||||
"avg": "平均 {{value}}ms",
|
||||
"downTooltip": "停機",
|
||||
"heatmapAria": "回應時間熱圖",
|
||||
"max": "最大 {{value}}ms"
|
||||
},
|
||||
"status": {
|
||||
"breached": "超過閾值",
|
||||
"down": "停機",
|
||||
"initializing": "初始化中",
|
||||
"maintenance": "維護中",
|
||||
"paused": "已暫停",
|
||||
"up": "運行中"
|
||||
}
|
||||
},
|
||||
"statusBar": {
|
||||
@@ -1384,9 +1324,7 @@
|
||||
"maintenance": "部分系統正在維護",
|
||||
"partiallyPaused": "部分系統已暫停",
|
||||
"initializing": "部分系統正在初始化",
|
||||
"noMonitors": "尚未設定任何監視器",
|
||||
"monitoringSummary": "正在監控{{count}}個服務 · 每10秒更新一次",
|
||||
"monitoringSummary_other": "正在監控{{count}}個服務 · 每10秒更新一次"
|
||||
"noMonitors": "尚未設定任何監視器"
|
||||
},
|
||||
"table": {
|
||||
"headers": {
|
||||
@@ -1477,47 +1415,11 @@
|
||||
"label": "顯示基礎架構指標"
|
||||
}
|
||||
}
|
||||
},
|
||||
"theme": {
|
||||
"description": "為您的公開狀態頁面選擇視覺樣式。",
|
||||
"label": "主題",
|
||||
"options": {
|
||||
"bold": {
|
||||
"description": "大字體和自信的間距。非常適合品牌導向的頁面。",
|
||||
"name": "粗體"
|
||||
},
|
||||
"editorial": {
|
||||
"description": "襯線標題和細分隔線。獨特而平靜。",
|
||||
"name": "編輯風格"
|
||||
},
|
||||
"modern": {
|
||||
"description": "SaaS級品質,帶有脈動狀態點和柔和淡出的卡片。",
|
||||
"name": "現代"
|
||||
},
|
||||
"refined": {
|
||||
"description": "乾淨、專業,接近經典Checkmate外觀。",
|
||||
"name": "精緻"
|
||||
}
|
||||
},
|
||||
"title": "頁面主題"
|
||||
},
|
||||
"themeMode": {
|
||||
"auto": "自動(依照訪客裝置)",
|
||||
"dark": "僅深色",
|
||||
"label": "主題模式",
|
||||
"light": "僅淺色"
|
||||
}
|
||||
},
|
||||
"header": {
|
||||
"title": "狀態頁面",
|
||||
"description": "發佈公開頁面,向客戶和利害關係人顯示即時的運行狀態與事件歷史。"
|
||||
},
|
||||
"editorial": {
|
||||
"allUp": "所有系統運作正常。",
|
||||
"reportTitle": "服務報告"
|
||||
},
|
||||
"footer": {
|
||||
"poweredBy": "技術支援"
|
||||
}
|
||||
},
|
||||
"uptime": {
|
||||
|
||||
@@ -0,0 +1,114 @@
|
||||
# Checkmate API documentation
|
||||
|
||||
Public-facing API documentation that powers **https://checkmate.so/docs**.
|
||||
|
||||
The site is built with [Astro Starlight](https://starlight.astro.build/) — a static-site generator that produces a fast, modern docs site with zero JavaScript by default. Starlight is open source and self-hostable; there is no third-party account required to publish.
|
||||
|
||||
## Repository layout
|
||||
|
||||
```
|
||||
docs/
|
||||
├── api-content/ ← markdown prose (this folder — edit here)
|
||||
│ ├── introduction.md
|
||||
│ ├── quickstart.md
|
||||
│ ├── authentication.md
|
||||
│ ├── conventions.md
|
||||
│ ├── errors.md
|
||||
│ ├── rate-limiting.md
|
||||
│ └── api-reference/
|
||||
│ └── overview.md
|
||||
└── api/ ← Astro Starlight project (build tool — leave alone unless changing the site)
|
||||
├── package.json
|
||||
├── astro.config.mjs
|
||||
├── src/content.config.ts
|
||||
└── src/styles/checkmate.css
|
||||
```
|
||||
|
||||
**Contributors editing prose only need to touch `docs/api-content/`**. Astro's content loader picks up the markdown automatically.
|
||||
|
||||
The endpoint reference (every URL + schema) is **auto-generated from [`server/openapi.json`](../../server/openapi.json)** via the `starlight-openapi` plugin. Adding or changing an endpoint means updating that JSON; the public docs pick it up on the next Vercel build.
|
||||
|
||||
## Local preview
|
||||
|
||||
```bash
|
||||
cd docs/api
|
||||
npm install
|
||||
npm run dev
|
||||
```
|
||||
|
||||
Visit http://localhost:4321/docs. Hot-reload works for markdown changes in `docs/api-content/`.
|
||||
|
||||
To produce the static site:
|
||||
|
||||
```bash
|
||||
npm run build # outputs docs/api/dist/
|
||||
npm run preview # serve the built output locally
|
||||
```
|
||||
|
||||
## Deploying to checkmate.so/docs
|
||||
|
||||
Astro Starlight builds a static site. Deploy on Vercel and reverse-proxy `checkmate.so/docs/*` to it.
|
||||
|
||||
### One-time Vercel setup
|
||||
|
||||
1. Go to https://vercel.com → New Project → import the `bluewave-labs/Checkmate` GitHub repo.
|
||||
2. **Root Directory**: set to `docs/api`.
|
||||
3. **Framework Preset**: Vercel auto-detects Astro from `vercel.json`.
|
||||
4. **Build & Output**: leave defaults (`npm run build` → `dist/`).
|
||||
5. **Production Branch**: `develop`.
|
||||
6. Deploy. Vercel returns a URL like `checkmate-docs.vercel.app`.
|
||||
7. Verify the site renders correctly.
|
||||
|
||||
The deployment auto-rebuilds on every push to `develop` and on every PR (as a preview deploy).
|
||||
|
||||
### Reverse-proxy /docs to Vercel
|
||||
|
||||
In whichever edge proxy fronts `checkmate.so`, route `/docs/*` to the Vercel deployment.
|
||||
|
||||
**Cloudflare Workers:**
|
||||
|
||||
```javascript
|
||||
addEventListener("fetch", (event) => {
|
||||
const url = new URL(event.request.url);
|
||||
if (url.pathname === "/docs" || url.pathname.startsWith("/docs/")) {
|
||||
const target = new URL(url.pathname, "https://checkmate-docs.vercel.app");
|
||||
target.search = url.search;
|
||||
return event.respondWith(fetch(target.toString(), event.request));
|
||||
}
|
||||
});
|
||||
```
|
||||
|
||||
**nginx:**
|
||||
|
||||
```nginx
|
||||
location /docs/ {
|
||||
proxy_pass https://checkmate-docs.vercel.app/docs/;
|
||||
proxy_set_header Host checkmate-docs.vercel.app;
|
||||
proxy_ssl_server_name on;
|
||||
}
|
||||
```
|
||||
|
||||
The `base: "/docs"` setting in `astro.config.mjs` ensures every internal link and asset URL is prefixed correctly so the site works at `checkmate.so/docs/...` rather than the root.
|
||||
|
||||
## Updating the docs
|
||||
|
||||
| Task | What to edit |
|
||||
|---|---|
|
||||
| Fix a typo, clarify wording | `docs/api-content/*.md` |
|
||||
| Add a new narrative page | Add the file to `docs/api-content/`, then add a `slug` entry to `astro.config.mjs` → `sidebar` |
|
||||
| Fix something in the API reference | Edit `server/openapi.json` (or the route spec it's built from) — never edit the generated reference pages |
|
||||
| Change branding / colors | `docs/api/src/styles/checkmate.css` |
|
||||
| Change site config (title, logo, social) | `docs/api/astro.config.mjs` |
|
||||
|
||||
Two rules:
|
||||
|
||||
1. **Never hand-edit the API reference.** It's regenerated on every build. Fix the spec.
|
||||
2. **Test code samples against a real instance before merging.** Wrong code in docs is worse than missing code.
|
||||
|
||||
## Why Astro Starlight (and not Mintlify, Docusaurus, etc.)
|
||||
|
||||
- **No third-party account required.** Self-hostable on any static host.
|
||||
- **Best looking** of the modern docs frameworks per multiple 2026 reviews — Distr, among others, migrated away from Docusaurus specifically for Starlight's design.
|
||||
- **Zero JavaScript by default.** Pages are pure HTML — fast load, perfect Lighthouse scores.
|
||||
- **OpenAPI integration is first-class** via `starlight-openapi`.
|
||||
- **Markdown is the source of truth.** No proprietary formats. Easy to migrate later if needed.
|
||||
@@ -0,0 +1,47 @@
|
||||
---
|
||||
title: API reference overview
|
||||
description: All endpoints, grouped by resource. Auto-generated from the OpenAPI spec.
|
||||
---
|
||||
|
||||
# API reference
|
||||
|
||||
The full machine-readable specification is at [`server/openapi.json`](https://github.com/bluewave-labs/Checkmate/blob/develop/server/openapi.json). Mintlify renders an interactive reference from it — each endpoint below is fully documented with request/response schemas, examples, and a built-in "Try it" form.
|
||||
|
||||
## Endpoint groups
|
||||
|
||||
| Group | Description |
|
||||
|---|---|
|
||||
| **auth** | Register, log in, password recovery, manage users |
|
||||
| **invite** | Send and redeem team invites |
|
||||
| **monitors** | Create, update, pause, and delete monitors |
|
||||
| **checks** | Read individual check results and team-wide summaries |
|
||||
| **incidents** | List, filter, and resolve downtime incidents |
|
||||
| **maintenance-window** | Schedule maintenance windows to silence checks |
|
||||
| **notifications** | Configure email, Slack, Discord, and webhook channels |
|
||||
| **status-page** | Manage public status pages |
|
||||
| **geo-checks** | Multi-region check results |
|
||||
| **logs** | Audit and operational logs |
|
||||
| **settings** | Global Checkmate settings |
|
||||
| **queue** | Background-job queue health (operational) |
|
||||
| **diagnostic** | System health and version info |
|
||||
|
||||
## Authentication
|
||||
|
||||
Every endpoint except the unauthenticated auth/recovery routes requires:
|
||||
|
||||
```
|
||||
Authorization: Bearer <jwt>
|
||||
```
|
||||
|
||||
See [Authentication](/api/authentication) for how to obtain a token.
|
||||
|
||||
## Conventions recap
|
||||
|
||||
- Base URL: `https://your-checkmate-host/api/v1`
|
||||
- Response envelope: `{ success, msg, data }`
|
||||
- IDs: 24-character MongoDB ObjectIds
|
||||
- Timestamps: ISO 8601 UTC
|
||||
- Durations: integers in milliseconds
|
||||
- Most resources are team-scoped — pass `teamId` where the path includes `/team/...`
|
||||
|
||||
See [Conventions](/api/conventions) for full details.
|
||||
@@ -0,0 +1,137 @@
|
||||
---
|
||||
title: Authentication
|
||||
description: Obtain a JWT from /auth/login and send it as a Bearer token on every subsequent request.
|
||||
---
|
||||
|
||||
# Authentication
|
||||
|
||||
Checkmate uses **JWT bearer tokens**. There are no API keys, no OAuth, and no client secrets. Every API user is a regular Checkmate user — the credentials you log in to the web UI with are the credentials you use to obtain a token.
|
||||
|
||||
## The flow
|
||||
|
||||
1. **Get a token** by calling `POST /auth/login` with your email and password.
|
||||
2. **Send the token** as `Authorization: Bearer <token>` on every subsequent request.
|
||||
3. **Refresh** by calling `POST /auth/login` again before the token expires.
|
||||
|
||||
## Obtaining a token
|
||||
|
||||
```bash
|
||||
curl -X POST https://your-checkmate-host/api/v1/auth/login \
|
||||
-H "Content-Type: application/json" \
|
||||
-d '{
|
||||
"email": "you@example.com",
|
||||
"password": "YourPass1!"
|
||||
}'
|
||||
```
|
||||
|
||||
A successful response returns the token plus the authenticated user record:
|
||||
|
||||
```json
|
||||
{
|
||||
"success": true,
|
||||
"msg": "OK",
|
||||
"data": {
|
||||
"user": {
|
||||
"_id": "65f1c2a4d8b9e0123456789a",
|
||||
"firstName": "Ada",
|
||||
"lastName": "Lovelace",
|
||||
"email": "you@example.com",
|
||||
"role": ["admin"],
|
||||
"teamId": "65f1c2a4d8b9e01234567890",
|
||||
"createdAt": "2026-04-01T10:00:00.000Z",
|
||||
"updatedAt": "2026-04-15T14:30:00.000Z"
|
||||
},
|
||||
"token": "eyJhbGciOiJIUzI1NiIsInR5cCI6IkpXVCJ9..."
|
||||
}
|
||||
}
|
||||
```
|
||||
|
||||
Store both `token` (for the `Authorization` header) and `user.teamId` (most resource endpoints are scoped by team).
|
||||
|
||||
## Using a token
|
||||
|
||||
Every authenticated request must include:
|
||||
|
||||
```
|
||||
Authorization: Bearer <token>
|
||||
```
|
||||
|
||||
```bash
|
||||
curl https://your-checkmate-host/api/v1/monitors/team/<teamId> \
|
||||
-H "Authorization: Bearer eyJhbGciOiJIUzI1NiIsInR5cCI6IkpXVCJ9..."
|
||||
```
|
||||
|
||||
```javascript
|
||||
const res = await fetch("https://your-checkmate-host/api/v1/monitors/team/<teamId>", {
|
||||
headers: { Authorization: `Bearer ${token}` },
|
||||
});
|
||||
```
|
||||
|
||||
## Token lifetime
|
||||
|
||||
Tokens expire after the duration configured by the operator via the `TOKEN_TTL` environment variable. The default is **99 days**.
|
||||
|
||||
There is no separate refresh-token endpoint. When a token is close to expiry — or after a 401 response — call `POST /auth/login` again to obtain a new one.
|
||||
|
||||
## Roles
|
||||
|
||||
The `user.role` claim is an array. Available roles:
|
||||
|
||||
| Role | Capability |
|
||||
|---|---|
|
||||
| `superadmin` | Full access to all teams and global settings. Can promote other users. |
|
||||
| `admin` | Full access within their team. |
|
||||
| `user` | Read access within their team. |
|
||||
| `demo` | Limited demo-mode access. |
|
||||
|
||||
A user can hold multiple roles simultaneously.
|
||||
|
||||
## Registering the first user
|
||||
|
||||
A fresh Checkmate instance has no users. The first call to `POST /auth/register` creates the first **superadmin** and provisions a team for them:
|
||||
|
||||
```bash
|
||||
curl -X POST https://your-checkmate-host/api/v1/auth/register \
|
||||
-H "Content-Type: application/json" \
|
||||
-d '{
|
||||
"firstName": "Ada",
|
||||
"lastName": "Lovelace",
|
||||
"email": "ada@example.com",
|
||||
"password": "Hunter2!",
|
||||
"role": ["superadmin"],
|
||||
"teamId": ""
|
||||
}'
|
||||
```
|
||||
|
||||
After the first user exists, additional users are usually created via the invite flow rather than `POST /auth/register`:
|
||||
|
||||
```
|
||||
POST /invite/send # superadmin/admin sends an invite
|
||||
POST /auth/register # invitee redeems the invite token
|
||||
```
|
||||
|
||||
You can check whether a superadmin already exists with:
|
||||
|
||||
```bash
|
||||
curl https://your-checkmate-host/api/v1/auth/users/superadmin
|
||||
```
|
||||
|
||||
```json
|
||||
{ "success": true, "data": true }
|
||||
```
|
||||
|
||||
## Password recovery
|
||||
|
||||
The password-recovery flow is three calls, all unauthenticated:
|
||||
|
||||
```
|
||||
POST /auth/recovery/request # user requests a recovery email
|
||||
POST /auth/recovery/validate # client validates the recovery token
|
||||
POST /auth/recovery/reset # user sets a new password
|
||||
```
|
||||
|
||||
## Logging out
|
||||
|
||||
JWTs are stateless — there is no server-side logout. Drop the token from your client storage. If you need to invalidate a token before its expiry (e.g. a compromised device), the operator must rotate the `JWT_SECRET` environment variable, which invalidates every outstanding token.
|
||||
|
||||
Next: [Conventions](/api/conventions).
|
||||
@@ -0,0 +1,122 @@
|
||||
---
|
||||
title: Conventions
|
||||
description: Response envelope, request format, identifiers, pagination, and team scoping.
|
||||
---
|
||||
|
||||
# Conventions
|
||||
|
||||
A small number of conventions apply to every endpoint. Once you've internalized them, the per-resource reference is mostly self-explanatory.
|
||||
|
||||
## Request format
|
||||
|
||||
- **Content-Type**: `application/json` for all POST/PUT/PATCH bodies, except multipart uploads (logos, profile images), which use `multipart/form-data`.
|
||||
- **Charset**: UTF-8.
|
||||
- **Method semantics**:
|
||||
- `GET` — read, never mutates state.
|
||||
- `POST` — create, or action that doesn't fit GET/PATCH/DELETE.
|
||||
- `PATCH` — partial update.
|
||||
- `PUT` — full replace.
|
||||
- `DELETE` — delete.
|
||||
|
||||
## Response envelope
|
||||
|
||||
Every JSON response uses the same shape:
|
||||
|
||||
```json
|
||||
{
|
||||
"success": true,
|
||||
"msg": "OK",
|
||||
"data": { /* endpoint-specific payload */ }
|
||||
}
|
||||
```
|
||||
|
||||
| Field | Type | Meaning |
|
||||
|---|---|---|
|
||||
| `success` | boolean | `true` on 2xx, `false` on 4xx/5xx |
|
||||
| `msg` | string | Human-readable summary — safe to surface in UIs |
|
||||
| `data` | object \| array \| null | Endpoint-specific payload. Absent or `null` for `204 No Content`. |
|
||||
|
||||
Error responses use the same envelope with `success: false` and `data` typically omitted. See [Errors](/api/errors).
|
||||
|
||||
## Identifiers
|
||||
|
||||
- All resource IDs are **MongoDB ObjectIds** (24-character hex strings):
|
||||
```
|
||||
65f1c2a4d8b9e0123456789a
|
||||
```
|
||||
- Treat IDs as opaque strings. Do not attempt to parse the timestamp or counter components.
|
||||
|
||||
## Team scoping
|
||||
|
||||
Most resources belong to a **team**. After login, the user record contains a `teamId`; pass it as a path parameter wherever the endpoint name includes `/team/...`:
|
||||
|
||||
```
|
||||
GET /monitors/team/65f1c2a4d8b9e01234567890
|
||||
GET /incidents/team
|
||||
GET /checks/team
|
||||
```
|
||||
|
||||
Users only see resources belonging to their own team, except for `superadmin`, who can read across teams.
|
||||
|
||||
## Date and time
|
||||
|
||||
- All timestamps in JSON are **ISO 8601** strings in UTC:
|
||||
```
|
||||
"createdAt": "2026-04-01T10:00:00.000Z"
|
||||
```
|
||||
- Durations are typically integers in **milliseconds** (intervals, response times, time windows).
|
||||
|
||||
## Pagination
|
||||
|
||||
Endpoints that return collections accept these optional query parameters:
|
||||
|
||||
| Parameter | Type | Default | Notes |
|
||||
|---|---|---|---|
|
||||
| `limit` | integer | endpoint-dependent | Maximum rows to return. |
|
||||
| `page` | integer | `0` | Zero-indexed page number. |
|
||||
| `sortBy` | string | endpoint-dependent | Field to sort by. |
|
||||
| `sortOrder` | `asc` \| `desc` | `desc` | Sort direction. |
|
||||
| `filter` | string | — | Endpoint-specific filter (e.g. status). |
|
||||
|
||||
When a collection supports pagination, the response `data` includes the rows plus the total count:
|
||||
|
||||
```json
|
||||
{
|
||||
"success": true,
|
||||
"msg": "OK",
|
||||
"data": {
|
||||
"monitors": [ /* … */ ],
|
||||
"filteredMonitors": [ /* … */ ],
|
||||
"summary": { /* counters */ }
|
||||
}
|
||||
}
|
||||
```
|
||||
|
||||
Exact shapes vary per endpoint. See the [API reference](/api/reference) for each endpoint's response schema.
|
||||
|
||||
## File uploads
|
||||
|
||||
Two endpoints accept files:
|
||||
|
||||
- Status page logo: `POST /status-page` (multipart, field `logo`)
|
||||
- User profile picture: `POST /auth/register`, `PATCH /auth/user/:id` (multipart, field `profileImage`)
|
||||
|
||||
Use `multipart/form-data` and include the JSON fields as separate form parts.
|
||||
|
||||
## CORS
|
||||
|
||||
The server's CORS policy is configured via the `CLIENT_HOST` environment variable. Only requests whose `Origin` matches `CLIENT_HOST` are accepted, and credentials (cookies) are allowed.
|
||||
|
||||
If you're calling the API from a browser on a different origin, the operator must add that origin to `CLIENT_HOST`. Server-to-server calls (curl, your backend) are not subject to CORS.
|
||||
|
||||
## Versioning
|
||||
|
||||
The base path includes the API version:
|
||||
|
||||
```
|
||||
/api/v1/...
|
||||
```
|
||||
|
||||
Within `v1`, additive changes (new endpoints, new optional fields) ship without notice. Breaking changes (removed endpoints, changed field types) only ship under a new major version.
|
||||
|
||||
Next: [Errors](/api/errors).
|
||||
@@ -0,0 +1,124 @@
|
||||
---
|
||||
title: Errors
|
||||
description: HTTP status codes Checkmate returns, what they mean, and how to handle them.
|
||||
---
|
||||
|
||||
# Errors
|
||||
|
||||
Failure responses share the same envelope as successful ones, with `success: false` and `data` omitted (or `null`):
|
||||
|
||||
```json
|
||||
{
|
||||
"success": false,
|
||||
"msg": "Validation failed: email must be a valid email"
|
||||
}
|
||||
```
|
||||
|
||||
Always treat the **HTTP status code** as the source of truth for handling logic, and surface `msg` to humans.
|
||||
|
||||
## Status codes
|
||||
|
||||
| Status | Meaning | When you'll see it |
|
||||
|---|---|---|
|
||||
| `200 OK` | Request succeeded with a body | Most GETs, successful mutations that return the new resource |
|
||||
| `204 No Content` | Request succeeded with no body | DELETEs, successful actions like `/status-page/:url/unlock` |
|
||||
| `400 Bad Request` | Malformed request | Missing required path param, malformed JSON, invalid file upload |
|
||||
| `401 Unauthorized` | Missing or invalid JWT | Token expired, token missing, token signed with a different secret |
|
||||
| `403 Forbidden` | Authenticated, but not allowed | Accessing a resource that belongs to a different team, or insufficient role |
|
||||
| `404 Not Found` | Resource doesn't exist | Wrong ID, deleted resource, mistyped path |
|
||||
| `409 Conflict` | Operation would violate a constraint | Duplicate email on register, slug already taken on status page |
|
||||
| `413 Payload Too Large` | File upload exceeded limit | Logo or profile image too big |
|
||||
| `422 Unprocessable Entity` | Request was well-formed but failed validation | Zod / Joi schema rejected the body |
|
||||
| `429 Too Many Requests` | Rate limit exceeded | See [Rate limiting](/api/rate-limiting) |
|
||||
| `500 Internal Server Error` | Unexpected server error | A bug — report it with the request ID |
|
||||
|
||||
## Common shapes
|
||||
|
||||
### 401 — missing or invalid token
|
||||
|
||||
```json
|
||||
{
|
||||
"success": false,
|
||||
"msg": "No auth token provided"
|
||||
}
|
||||
```
|
||||
|
||||
Re-authenticate by calling `POST /auth/login`.
|
||||
|
||||
### 422 — validation error
|
||||
|
||||
```json
|
||||
{
|
||||
"success": false,
|
||||
"msg": "\"email\" must be a valid email"
|
||||
}
|
||||
```
|
||||
|
||||
The `msg` describes the first failing field. Re-send the request with the fix.
|
||||
|
||||
### 403 — forbidden
|
||||
|
||||
```json
|
||||
{
|
||||
"success": false,
|
||||
"msg": "Forbidden"
|
||||
}
|
||||
```
|
||||
|
||||
You're authenticated but the resource isn't visible to you. Common cause: passing a `teamId` that isn't your team's.
|
||||
|
||||
### 429 — rate limited
|
||||
|
||||
```json
|
||||
{
|
||||
"success": false,
|
||||
"msg": "Too many requests"
|
||||
}
|
||||
```
|
||||
|
||||
Inspect `RateLimit-*` response headers and back off. See [Rate limiting](/api/rate-limiting).
|
||||
|
||||
## Error handling pattern
|
||||
|
||||
Client code should branch on status code, not on `msg`:
|
||||
|
||||
```javascript
|
||||
const res = await fetch(url, opts);
|
||||
const body = await res.json().catch(() => ({}));
|
||||
|
||||
switch (res.status) {
|
||||
case 200:
|
||||
case 204:
|
||||
return body.data;
|
||||
|
||||
case 401:
|
||||
// Token expired or missing — re-authenticate, then retry once.
|
||||
await reauthenticate();
|
||||
return retry();
|
||||
|
||||
case 422:
|
||||
// Surface the validation error to the user.
|
||||
throw new ValidationError(body.msg);
|
||||
|
||||
case 429:
|
||||
// Back off using Retry-After if present.
|
||||
const retryAfter = Number(res.headers.get("Retry-After") ?? 60);
|
||||
await sleep(retryAfter * 1000);
|
||||
return retry();
|
||||
|
||||
default:
|
||||
throw new Error(`Checkmate API ${res.status}: ${body.msg ?? res.statusText}`);
|
||||
}
|
||||
```
|
||||
|
||||
## Reporting bugs
|
||||
|
||||
If you see a `500`, capture:
|
||||
|
||||
- The exact request (method, path, body — **redact secrets**)
|
||||
- The full response body and headers
|
||||
- A timestamp in UTC
|
||||
|
||||
Open an issue at https://github.com/bluewave-labs/Checkmate/issues with that information.
|
||||
|
||||
Next: [Rate limiting](/api/rate-limiting).
|
||||
@@ -0,0 +1,84 @@
|
||||
---
|
||||
title: Introduction
|
||||
description: Use the Checkmate REST API to manage monitors, incidents, status pages, notifications, and users programmatically.
|
||||
---
|
||||
|
||||
# Checkmate API
|
||||
|
||||
Checkmate exposes a REST API that mirrors everything the web UI can do. Use it to provision monitors from infrastructure-as-code, build internal dashboards, automate incident workflows, or integrate Checkmate into your existing alerting stack.
|
||||
|
||||
The web UI you log in to is itself just a client of this same API.
|
||||
|
||||
## Base URL
|
||||
|
||||
```
|
||||
https://<your-checkmate-host>/api/v1
|
||||
```
|
||||
|
||||
Replace `<your-checkmate-host>` with the domain where you deployed Checkmate. For local development:
|
||||
|
||||
```
|
||||
http://localhost:52345/api/v1
|
||||
```
|
||||
|
||||
All endpoints are relative to this base. Every path on this page is shown without the `/api/v1` prefix — prepend it when making requests.
|
||||
|
||||
## API stability
|
||||
|
||||
The API is at version **`v1`** and is considered stable. Breaking changes will only ship under a new major version (`/api/v2`).
|
||||
|
||||
## What you can do
|
||||
|
||||
| Resource | What it covers |
|
||||
|---|---|
|
||||
| `monitors` | Create, update, pause, and delete monitors of any type (HTTP, Ping, Port, DNS, Docker, PageSpeed, gRPC, WebSocket, Game, Hardware) |
|
||||
| `checks` | Read individual check results and aggregated stats |
|
||||
| `incidents` | List, filter, and resolve downtime incidents |
|
||||
| `notifications` | Manage notification channels (email, Slack, Discord, webhooks) |
|
||||
| `status-page` | Configure public status pages |
|
||||
| `maintenance-window` | Schedule maintenance windows so checks don't fire incidents |
|
||||
| `geo-checks` | Multi-region check results |
|
||||
| `auth` | Register, log in, manage users |
|
||||
| `invite` | Invite teammates |
|
||||
| `logs` | Audit and operational logs |
|
||||
| `settings` | Tune global Checkmate settings |
|
||||
| `queue` | Inspect the background-job queue (operational) |
|
||||
| `diagnostic` | Health and system info |
|
||||
|
||||
## What you'll need
|
||||
|
||||
1. A running Checkmate instance you administer.
|
||||
2. A user account on that instance.
|
||||
3. A JWT obtained by calling `POST /auth/login` — see [Authentication](/api/authentication).
|
||||
|
||||
There is no separate "API key" concept in Checkmate. The same JWT that authenticates the web UI authenticates every API call.
|
||||
|
||||
## Response shape
|
||||
|
||||
Every endpoint returns the same envelope:
|
||||
|
||||
```json
|
||||
{
|
||||
"success": true,
|
||||
"msg": "OK",
|
||||
"data": { /* endpoint-specific payload */ }
|
||||
}
|
||||
```
|
||||
|
||||
See [Conventions](/api/conventions) for the full contract and [Errors](/api/errors) for failure shapes.
|
||||
|
||||
## Quick example
|
||||
|
||||
```bash
|
||||
# 1. Log in to get a token
|
||||
TOKEN=$(curl -s -X POST https://your-checkmate-host/api/v1/auth/login \
|
||||
-H "Content-Type: application/json" \
|
||||
-d '{"email":"you@example.com","password":"YourPass1!"}' \
|
||||
| jq -r '.data.token')
|
||||
|
||||
# 2. List your team's monitors
|
||||
curl https://your-checkmate-host/api/v1/monitors/team/<teamId> \
|
||||
-H "Authorization: Bearer $TOKEN"
|
||||
```
|
||||
|
||||
Next: [Authentication](/api/authentication).
|
||||
@@ -0,0 +1,117 @@
|
||||
---
|
||||
title: Quickstart
|
||||
description: From zero to a working monitor in under five minutes.
|
||||
---
|
||||
|
||||
# Quickstart
|
||||
|
||||
This walkthrough creates a Checkmate user, logs in, provisions an HTTP monitor, and reads its checks — all via the API.
|
||||
|
||||
It assumes you have a Checkmate instance running and reachable. Substitute `https://your-checkmate-host` with your actual host throughout.
|
||||
|
||||
## 1. Register the first user
|
||||
|
||||
If your instance is fresh, the first user becomes a superadmin:
|
||||
|
||||
```bash
|
||||
curl -X POST https://your-checkmate-host/api/v1/auth/register \
|
||||
-H "Content-Type: application/json" \
|
||||
-d '{
|
||||
"firstName": "Ada",
|
||||
"lastName": "Lovelace",
|
||||
"email": "ada@example.com",
|
||||
"password": "Hunter2!Hunter2!",
|
||||
"role": ["superadmin"],
|
||||
"teamId": ""
|
||||
}'
|
||||
```
|
||||
|
||||
The response includes a JWT and a freshly-created `teamId`. Save both.
|
||||
|
||||
If a superadmin already exists, skip to step 2 and use existing credentials.
|
||||
|
||||
## 2. Log in
|
||||
|
||||
If you already have an account:
|
||||
|
||||
```bash
|
||||
TOKEN=$(curl -s -X POST https://your-checkmate-host/api/v1/auth/login \
|
||||
-H "Content-Type: application/json" \
|
||||
-d '{"email":"ada@example.com","password":"Hunter2!Hunter2!"}' \
|
||||
| jq -r '.data.token')
|
||||
|
||||
TEAM_ID=$(curl -s -X POST https://your-checkmate-host/api/v1/auth/login \
|
||||
-H "Content-Type: application/json" \
|
||||
-d '{"email":"ada@example.com","password":"Hunter2!Hunter2!"}' \
|
||||
| jq -r '.data.user.teamId')
|
||||
|
||||
echo "Token: $TOKEN"
|
||||
echo "Team: $TEAM_ID"
|
||||
```
|
||||
|
||||
## 3. Create a monitor
|
||||
|
||||
This creates an HTTP monitor that probes example.com every 60 seconds:
|
||||
|
||||
```bash
|
||||
curl -X POST https://your-checkmate-host/api/v1/monitors \
|
||||
-H "Authorization: Bearer $TOKEN" \
|
||||
-H "Content-Type: application/json" \
|
||||
-d "{
|
||||
\"name\": \"example.com\",
|
||||
\"type\": \"http\",
|
||||
\"url\": \"https://example.com\",
|
||||
\"interval\": 60000,
|
||||
\"teamId\": \"$TEAM_ID\",
|
||||
\"isActive\": true
|
||||
}"
|
||||
```
|
||||
|
||||
A successful response returns the new monitor including its `_id`.
|
||||
|
||||
## 4. List your team's monitors
|
||||
|
||||
```bash
|
||||
curl https://your-checkmate-host/api/v1/monitors/team/$TEAM_ID \
|
||||
-H "Authorization: Bearer $TOKEN"
|
||||
```
|
||||
|
||||
You should see the monitor you just created. Within a minute, the background worker will have run a few checks against it.
|
||||
|
||||
## 5. Read recent checks
|
||||
|
||||
Replace `<MONITOR_ID>` with the `_id` from step 3:
|
||||
|
||||
```bash
|
||||
curl "https://your-checkmate-host/api/v1/checks/<MONITOR_ID>?limit=10" \
|
||||
-H "Authorization: Bearer $TOKEN"
|
||||
```
|
||||
|
||||
You'll see an array of check results — status code, response time, timestamp, region (if applicable).
|
||||
|
||||
## 6. Pause and delete the monitor
|
||||
|
||||
Pause:
|
||||
|
||||
```bash
|
||||
curl -X PATCH https://your-checkmate-host/api/v1/monitors/<MONITOR_ID> \
|
||||
-H "Authorization: Bearer $TOKEN" \
|
||||
-H "Content-Type: application/json" \
|
||||
-d '{"isActive": false}'
|
||||
```
|
||||
|
||||
Delete:
|
||||
|
||||
```bash
|
||||
curl -X DELETE https://your-checkmate-host/api/v1/monitors/<MONITOR_ID> \
|
||||
-H "Authorization: Bearer $TOKEN"
|
||||
```
|
||||
|
||||
## What's next
|
||||
|
||||
- **Set up notifications** — `POST /notifications` to wire email / Slack / Discord / webhook channels, then attach them to monitors.
|
||||
- **Build a status page** — `POST /status-page` to publish your monitors publicly.
|
||||
- **Schedule maintenance** — `POST /maintenance-window` to silence checks during planned downtime.
|
||||
- **Browse the full API reference** — see every endpoint with request/response schemas.
|
||||
|
||||
See the [reference](/api/reference) for the complete list of endpoints.
|
||||
@@ -0,0 +1,83 @@
|
||||
---
|
||||
title: Rate limiting
|
||||
description: Per-IP request limits, headers, and how to back off.
|
||||
---
|
||||
|
||||
# Rate limiting
|
||||
|
||||
Checkmate applies two per-IP rate limiters, both with a **60-second window**:
|
||||
|
||||
| Limiter | Applies to | Limit |
|
||||
|---|---|---|
|
||||
| General | All requests under `/api/v1/*` | **600 requests / 60 seconds** |
|
||||
| Auth-sensitive | `/auth/login`, `/auth/register`, `/auth/recovery/*`, `/status-page/:url/unlock` | **15 requests / 60 seconds** |
|
||||
|
||||
The two limiters are **independent**. Auth-sensitive endpoints count against both buckets — you can hammer `/auth/login` 15 times in a minute before being rate-limited there, but a single client can never exceed 600 total requests per minute regardless of which endpoints are called.
|
||||
|
||||
## Headers
|
||||
|
||||
Every response includes the standard `RateLimit-*` headers so you can pace yourself proactively:
|
||||
|
||||
```
|
||||
RateLimit-Limit: 600
|
||||
RateLimit-Remaining: 587
|
||||
RateLimit-Reset: 42
|
||||
```
|
||||
|
||||
| Header | Meaning |
|
||||
|---|---|
|
||||
| `RateLimit-Limit` | The cap for the current window. |
|
||||
| `RateLimit-Remaining` | Requests left before you hit `429`. |
|
||||
| `RateLimit-Reset` | Seconds until the window resets. |
|
||||
|
||||
## When you exceed the limit
|
||||
|
||||
You receive `HTTP 429 Too Many Requests`:
|
||||
|
||||
```json
|
||||
{
|
||||
"success": false,
|
||||
"msg": "Too many requests"
|
||||
}
|
||||
```
|
||||
|
||||
The response also includes `Retry-After`:
|
||||
|
||||
```
|
||||
Retry-After: 42
|
||||
```
|
||||
|
||||
Wait that many seconds before retrying. If `Retry-After` is missing, fall back to the `RateLimit-Reset` header.
|
||||
|
||||
## Recommended backoff
|
||||
|
||||
For one-off scripts, simple sleep-then-retry is fine:
|
||||
|
||||
```javascript
|
||||
async function callWithRetry(url, opts, attempts = 3) {
|
||||
for (let i = 0; i < attempts; i++) {
|
||||
const res = await fetch(url, opts);
|
||||
if (res.status !== 429) return res;
|
||||
const retry = Number(res.headers.get("Retry-After") ?? 60);
|
||||
await new Promise(r => setTimeout(r, retry * 1000));
|
||||
}
|
||||
throw new Error("Rate limit retry exhausted");
|
||||
}
|
||||
```
|
||||
|
||||
For higher-throughput integrations, watch `RateLimit-Remaining` and pace your sender to stay below the limit rather than waiting for `429`.
|
||||
|
||||
## Limits and proxies
|
||||
|
||||
Rate-limiting is per **client IP**, derived from the connection — or, when Checkmate is behind a reverse proxy with `trust proxy` configured, from the leftmost public IP in `X-Forwarded-For`.
|
||||
|
||||
If many of your clients share an egress IP (NAT, corporate proxy), they share the bucket. In that case, an operator should either:
|
||||
|
||||
- Increase the limits (server code change required), or
|
||||
- Make sure each client connects from a distinct IP.
|
||||
|
||||
## Limits are not contractual
|
||||
|
||||
The numbers above reflect the current defaults. An operator can change them at any time (they're hardcoded in `server/src/middleware/rateLimiter.ts`). If you're building an integration that depends on a higher limit, coordinate with the operator first.
|
||||
|
||||
Next: [API reference](/api/reference) — auto-generated from the OpenAPI spec.
|
||||
@@ -0,0 +1,21 @@
|
||||
# Astro build
|
||||
dist/
|
||||
.astro/
|
||||
|
||||
# Sources copied in at build time by scripts/sync-sources.mjs.
|
||||
# Edit /docs/api-content/ and /server/openapi.json instead.
|
||||
src/vendored/
|
||||
|
||||
# Dependencies
|
||||
node_modules/
|
||||
|
||||
# Logs
|
||||
npm-debug.log*
|
||||
yarn-debug.log*
|
||||
yarn-error.log*
|
||||
pnpm-debug.log*
|
||||
|
||||
# Env
|
||||
.env
|
||||
.env.production
|
||||
.vercel
|
||||
@@ -0,0 +1,83 @@
|
||||
import { defineConfig } from "astro/config";
|
||||
import starlight from "@astrojs/starlight";
|
||||
import starlightOpenAPI, { openAPISidebarGroups } from "starlight-openapi";
|
||||
|
||||
// The OpenAPI spec is vendored from server/openapi.json by
|
||||
// scripts/sync-sources.mjs (runs as predev/prebuild). We point at the
|
||||
// vendored copy so the build is self-contained — Vercel only uploads
|
||||
// the docs/api/ subtree, so paths outside this directory are not
|
||||
// available at build time.
|
||||
const OPENAPI_PATH = "./src/vendored/openapi.json";
|
||||
|
||||
export default defineConfig({
|
||||
// The deployed site serves at the root of its Vercel domain. The
|
||||
// reverse proxy that maps checkmate.so/docs/* → Vercel must strip
|
||||
// the /docs/ prefix before forwarding (the Cloudflare Worker snippet
|
||||
// in docs/api-content/README.md does this).
|
||||
site: "https://checkmate.so",
|
||||
|
||||
integrations: [
|
||||
starlight({
|
||||
title: "Checkmate API",
|
||||
description: "Use the Checkmate REST API to manage monitors, incidents, status pages, notifications, and users programmatically.",
|
||||
|
||||
// Prose markdown is loaded from /docs/api-content via the custom
|
||||
// docsLoader in src/content.config.ts. Keeping content outside the
|
||||
// Astro project tree means contributors can edit it without dealing
|
||||
// with Astro / Starlight tooling.
|
||||
|
||||
logo: {
|
||||
src: "./src/assets/logo.svg",
|
||||
replacesTitle: true,
|
||||
},
|
||||
favicon: "/favicon.svg",
|
||||
customCss: ["./src/styles/checkmate.css"],
|
||||
|
||||
social: {
|
||||
github: "https://github.com/bluewave-labs/Checkmate",
|
||||
},
|
||||
|
||||
// Inject a "Releases" link into the site header.
|
||||
components: {
|
||||
SocialIcons: "./src/components/HeaderLinks.astro",
|
||||
},
|
||||
|
||||
sidebar: [
|
||||
{
|
||||
label: "Getting started",
|
||||
items: [
|
||||
{ label: "Introduction", slug: "" },
|
||||
{ label: "Quickstart", slug: "quickstart" },
|
||||
{ label: "Authentication", slug: "authentication" },
|
||||
],
|
||||
},
|
||||
{
|
||||
label: "Core concepts",
|
||||
items: [
|
||||
{ label: "Conventions", slug: "conventions" },
|
||||
{ label: "Errors", slug: "errors" },
|
||||
{ label: "Rate limiting", slug: "rate-limiting" },
|
||||
],
|
||||
},
|
||||
{
|
||||
label: "API reference",
|
||||
items: [
|
||||
{ label: "Overview", slug: "api-reference/overview" },
|
||||
// The OpenAPI plugin appends every endpoint under this group.
|
||||
...openAPISidebarGroups,
|
||||
],
|
||||
},
|
||||
],
|
||||
|
||||
plugins: [
|
||||
starlightOpenAPI([
|
||||
{
|
||||
base: "api-reference",
|
||||
label: "REST API",
|
||||
schema: OPENAPI_PATH,
|
||||
},
|
||||
]),
|
||||
],
|
||||
}),
|
||||
],
|
||||
});
|
||||
Generated
+7983
File diff suppressed because it is too large.
Load diff
@@ -0,0 +1,22 @@
|
||||
{
|
||||
"name": "checkmate-docs-api",
|
||||
"type": "module",
|
||||
"version": "0.1.0",
|
||||
"private": true,
|
||||
"description": "Public API documentation for Checkmate. Built with Astro Starlight.",
|
||||
"scripts": {
|
||||
"prebuild": "node ./scripts/sync-sources.mjs",
|
||||
"predev": "node ./scripts/sync-sources.mjs",
|
||||
"dev": "astro dev",
|
||||
"start": "astro dev",
|
||||
"build": "astro build",
|
||||
"preview": "astro preview",
|
||||
"astro": "astro"
|
||||
},
|
||||
"dependencies": {
|
||||
"@astrojs/starlight": "^0.32.0",
|
||||
"astro": "^5.0.0",
|
||||
"sharp": "^0.33.5",
|
||||
"starlight-openapi": "^0.13.0"
|
||||
}
|
||||
}
|
||||
@@ -0,0 +1,55 @@
|
||||
// Copies external sources into the Astro project tree so the build is
|
||||
// self-contained. Required because Vercel's "Root Directory" setting
|
||||
// only uploads the docs/api/ subtree, leaving sibling/parent paths
|
||||
// (server/openapi.json, docs/api-content/) outside the build context.
|
||||
//
|
||||
// Run automatically by predev / prebuild via package.json. If the
|
||||
// external paths exist, they win; otherwise we assume the files were
|
||||
// already vendored (e.g. by a previous run) and continue.
|
||||
|
||||
import { existsSync, mkdirSync, cpSync, copyFileSync, statSync } from "node:fs";
|
||||
import { dirname, join } from "node:path";
|
||||
import { fileURLToPath } from "node:url";
|
||||
|
||||
const __dirname = dirname(fileURLToPath(import.meta.url));
|
||||
const PROJECT_ROOT = join(__dirname, "..");
|
||||
const REPO_ROOT = join(PROJECT_ROOT, "..", "..");
|
||||
|
||||
const SOURCES = [
|
||||
{
|
||||
// Markdown prose (the public docs content).
|
||||
from: join(REPO_ROOT, "docs", "api-content"),
|
||||
to: join(PROJECT_ROOT, "src", "vendored", "api-content"),
|
||||
kind: "dir",
|
||||
},
|
||||
{
|
||||
// OpenAPI spec — read at build time by starlight-openapi.
|
||||
from: join(REPO_ROOT, "server", "openapi.json"),
|
||||
to: join(PROJECT_ROOT, "src", "vendored", "openapi.json"),
|
||||
kind: "file",
|
||||
},
|
||||
];
|
||||
|
||||
let synced = 0;
|
||||
for (const src of SOURCES) {
|
||||
if (!existsSync(src.from)) {
|
||||
if (existsSync(src.to)) {
|
||||
console.log(`[sync-sources] ${src.from} not present; using existing vendored copy.`);
|
||||
continue;
|
||||
}
|
||||
console.error(`[sync-sources] ERROR: source missing and no vendored copy: ${src.from}`);
|
||||
process.exit(1);
|
||||
}
|
||||
|
||||
mkdirSync(dirname(src.to), { recursive: true });
|
||||
if (src.kind === "dir") {
|
||||
cpSync(src.from, src.to, { recursive: true });
|
||||
} else {
|
||||
copyFileSync(src.from, src.to);
|
||||
}
|
||||
const stat = statSync(src.from);
|
||||
console.log(`[sync-sources] ${src.from} → ${src.to} (${stat.isDirectory() ? "dir" : `${stat.size} bytes`})`);
|
||||
synced++;
|
||||
}
|
||||
|
||||
console.log(`[sync-sources] OK (${synced} sources copied)`);
|
||||

@@ -0,0 +1,5 @@
|
||||
<svg xmlns="http://www.w3.org/2000/svg" viewBox="0 0 200 32" fill="none">
|
||||
<rect x="2" y="6" width="20" height="20" rx="4" fill="#13715B"/>
|
||||
<path d="M7 16l3.5 3.5L17 12" stroke="white" stroke-width="2.4" stroke-linecap="round" stroke-linejoin="round"/>
|
||||
<text x="30" y="22" font-family="-apple-system, BlinkMacSystemFont, 'Inter', sans-serif" font-size="18" font-weight="600" fill="currentColor">Checkmate</text>
|
||||
</svg>
|
||||
|
After Width: | Height: | Size: 424 B |
@@ -0,0 +1,29 @@
|
||||
---
|
||||
// Renders next to the search/theme controls in Starlight's header.
|
||||
// Adds a "Releases" link plus delegates to the default SocialIcons.
|
||||
import Default from "@astrojs/starlight/components/SocialIcons.astro";
|
||||
---
|
||||
|
||||
<a class="header-link" href="/releases">Releases</a>
|
||||
<Default><slot /></Default>
|
||||
|
||||
<style>
|
||||
.header-link {
|
||||
color: var(--sl-color-white);
|
||||
font-size: var(--sl-text-sm);
|
||||
font-weight: 500;
|
||||
text-decoration: none;
|
||||
padding: 0.4rem 0.75rem;
|
||||
border-radius: 0.375rem;
|
||||
transition: background-color 0.15s ease;
|
||||
}
|
||||
.header-link:hover {
|
||||
background-color: var(--sl-color-gray-5);
|
||||
}
|
||||
:global([data-theme="light"]) .header-link {
|
||||
color: var(--sl-color-gray-6);
|
||||
}
|
||||
:global([data-theme="light"]) .header-link:hover {
|
||||
background-color: var(--sl-color-gray-1);
|
||||
}
|
||||
</style>
|
||||
@@ -0,0 +1,139 @@
|
||||
---
|
||||
interface Props {
|
||||
version: string;
|
||||
date: string;
|
||||
headline: string;
|
||||
highlights: string[];
|
||||
isLatest?: boolean;
|
||||
}
|
||||
|
||||
const { version, date, headline, highlights, isLatest = false } = Astro.props;
|
||||
|
||||
const formattedDate = new Date(date).toLocaleDateString("en-US", {
|
||||
month: "long",
|
||||
day: "numeric",
|
||||
year: "numeric",
|
||||
});
|
||||
---
|
||||
|
||||
<article class="release-card">
|
||||
<aside class="release-meta">
|
||||
<time datetime={date}>{formattedDate}</time>
|
||||
<span class="release-version">
|
||||
{version}
|
||||
{isLatest && <span class="latest-badge">Latest</span>}
|
||||
</span>
|
||||
</aside>
|
||||
<div class="release-content">
|
||||
<h2 class="release-headline">{headline}</h2>
|
||||
<ul class="release-highlights">
|
||||
{highlights.map((item) => <li>{item}</li>)}
|
||||
</ul>
|
||||
</div>
|
||||
</article>
|
||||
|
||||
<style>
|
||||
.release-card {
|
||||
display: grid;
|
||||
grid-template-columns: 200px 1fr;
|
||||
gap: 2.5rem;
|
||||
padding: 2rem 0;
|
||||
border-bottom: 1px solid var(--sl-color-gray-5);
|
||||
align-items: flex-start;
|
||||
}
|
||||
|
||||
.release-card:last-child {
|
||||
border-bottom: none;
|
||||
}
|
||||
|
||||
.release-meta {
|
||||
display: flex;
|
||||
flex-direction: column;
|
||||
gap: 0.4rem;
|
||||
position: sticky;
|
||||
top: 6rem;
|
||||
}
|
||||
|
||||
.release-meta time {
|
||||
color: var(--sl-color-gray-3);
|
||||
font-size: var(--sl-text-sm);
|
||||
font-feature-settings: "tnum";
|
||||
}
|
||||
|
||||
.release-version {
|
||||
display: inline-flex;
|
||||
align-items: center;
|
||||
gap: 0.5rem;
|
||||
color: var(--sl-color-white);
|
||||
font-weight: 600;
|
||||
font-size: var(--sl-text-base);
|
||||
font-variant-numeric: tabular-nums;
|
||||
}
|
||||
|
||||
.latest-badge {
|
||||
background: var(--sl-color-accent);
|
||||
color: var(--sl-color-white);
|
||||
font-size: 0.6875rem;
|
||||
font-weight: 600;
|
||||
letter-spacing: 0.04em;
|
||||
text-transform: uppercase;
|
||||
padding: 0.15rem 0.5rem;
|
||||
border-radius: 0.25rem;
|
||||
line-height: 1.2;
|
||||
}
|
||||
|
||||
.release-content {
|
||||
min-width: 0;
|
||||
}
|
||||
|
||||
.release-headline {
|
||||
margin: 0 0 1rem 0;
|
||||
font-size: var(--sl-text-xl);
|
||||
font-weight: 600;
|
||||
color: var(--sl-color-white);
|
||||
line-height: 1.3;
|
||||
}
|
||||
|
||||
.release-highlights {
|
||||
margin: 0;
|
||||
padding-left: 1.25rem;
|
||||
display: flex;
|
||||
flex-direction: column;
|
||||
gap: 0.5rem;
|
||||
}
|
||||
|
||||
.release-highlights li {
|
||||
color: var(--sl-color-gray-2);
|
||||
line-height: 1.55;
|
||||
font-size: var(--sl-text-base);
|
||||
}
|
||||
|
||||
.release-highlights li::marker {
|
||||
color: var(--sl-color-accent);
|
||||
}
|
||||
|
||||
:global([data-theme="light"]) .release-card {
|
||||
border-bottom-color: var(--sl-color-gray-2);
|
||||
}
|
||||
:global([data-theme="light"]) .release-version,
|
||||
:global([data-theme="light"]) .release-headline {
|
||||
color: var(--sl-color-gray-6);
|
||||
}
|
||||
:global([data-theme="light"]) .release-highlights li {
|
||||
color: var(--sl-color-gray-5);
|
||||
}
|
||||
|
||||
@media (max-width: 768px) {
|
||||
.release-card {
|
||||
grid-template-columns: 1fr;
|
||||
gap: 0.75rem;
|
||||
padding: 1.5rem 0;
|
||||
}
|
||||
.release-meta {
|
||||
position: static;
|
||||
flex-direction: row;
|
||||
align-items: center;
|
||||
gap: 1rem;
|
||||
}
|
||||
}
|
||||
</style>
|
||||
@@ -0,0 +1,26 @@
|
||||
import { defineCollection } from "astro:content";
|
||||
import { glob } from "astro/loaders";
|
||||
import { docsSchema } from "@astrojs/starlight/schema";
|
||||
|
||||
// Load markdown from a sibling folder so prose lives outside the Astro
|
||||
// project tree. Contributors edit /docs/api-content/*.md without touching
|
||||
// the build tool.
|
||||
//
|
||||
// Starlight's built-in docsLoader is hardcoded to src/content/docs/, so we
|
||||
// use Astro's plain glob loader with a custom base and apply Starlight's
|
||||
// schema on top. The collection name must remain "docs" — Starlight looks
|
||||
// it up by that exact name.
|
||||
export const collections = {
|
||||
docs: defineCollection({
|
||||
loader: glob({
|
||||
// Vendored from /docs/api-content/ by scripts/sync-sources.mjs.
|
||||
// This indirection keeps the build self-contained for Vercel
|
||||
// (whose Root Directory setting limits the upload to docs/api/).
|
||||
base: "./src/vendored/api-content",
|
||||
// README is contributor-facing docs (how to build the site),
|
||||
// not part of the published content.
|
||||
pattern: ["**/[^_]*.{md,mdx}", "!README.md"],
|
||||
}),
|
||||
schema: docsSchema(),
|
||||
}),
|
||||
};
|
||||
Loaded 100 of 426 files, more files were not shown because too many files have changed in this diff.
Show more
Reference in new issue
Block a user