Compare commits
240
Commits
| Author | SHA1 | Date | |
|---|---|---|---|
 gorkem-bwl |
fbee9c8849 | ||
|
gorkem-bwl
|
ebddf6d35f | ||
|
gorkem-bwl
|
314b4977be | ||
|
gorkem-bwl
|
165ab7bf74 | ||
|
gorkem-bwl
|
81e2422277 | ||
|
gorkem-bwl
|
e3e4e5495c | ||
|
gorkem-bwl
|
54624bf328 | ||
|
gorkem-bwl
|
4011807a54 | ||
|
gorkem-bwl
|
cbd1153189 | ||
|
gorkem-bwl
|
88042e7c50 | ||
|
gorkem-bwl
|
ba44985763 | ||
|
gorkem-bwl
|
b164fa63bf | ||
 Alexander Holliday |
7630491ad4 | ||
|
Alex Holliday
|
09be4cdf9a | ||
 Br0wnHammer |
8360c05448 | ||
|
Br0wnHammer
|
3cce1aa842 | ||
|
Br0wnHammer
|
37dfc67e33 | ||
|
Alexander Holliday
|
4a939ad2c4 | ||
|
Alex Holliday
|
56ee8ef5ea | ||
|
Alexander Holliday
|
8dd13c4b75 | ||
|
Alex Holliday
|
6b5c3bba47 | ||
|
Alexander Holliday
|
02998ed06e | ||
|
Alex Holliday
|
397541a789 | ||
|
Alex Holliday
|
949beff4f9 | ||
|
Alex Holliday
|
806c7764b1 | ||
|
Alex Holliday
|
d18a53eec2 | ||
|
Alex Holliday
|
f4b14e7df9 | ||
|
Alex Holliday
|
e834402672 | ||
|
Alex Holliday
|
290adf024c | ||
|
Alex Holliday
|
2c89086b68 | ||
|
Alex Holliday
|
20167d537b | ||
|
Alex Holliday
|
bf43632482 | ||
|
Alex Holliday
|
2d432e0a3d | ||
|
Br0wnHammer
|
967e415b0a | ||
|
Alexander Holliday
|
2764468e90 | ||
|
Alex Holliday
|
10d0835eb3 | ||
|
Br0wnHammer
|
1702fd1c5a | ||
|
Br0wnHammer
|
c98ec7d047 | ||
|
Br0wnHammer
|
9ffe0caed9 | ||
|
Alexander Holliday
|
ef8a8016df | ||
|
Alex Holliday
|
3a1a9bde4d | ||
|
Alexander Holliday
|
0e24bb7c94 | ||
|
Alex Holliday
|
a415c75eb4 | ||
|
Alexander Holliday
|
d1f46aba9e | ||
|
Alexander Holliday
|
bb60d22dea | ||
 harsh-aghara |
0ff642cb24 | ||
|
harsh-aghara
|
a044d7b2c7 | ||
|
harsh-aghara
|
9cee2eebd0 | ||
|
Alexander Holliday
|
bec5ef09cb | ||
|
Alex Holliday
|
3abacb046b | ||
|
Alex Holliday
|
fbfb861447 | ||
|
Alex Holliday
|
0470eab782 | ||
|
Alex Holliday
|
abf66eed95 | ||
|
Alex Holliday
|
4f571a258c | ||
|
Alex Holliday
|
85196852f4 | ||
|
Alex Holliday
|
46c80985ec | ||
|
Alex Holliday
|
8c7b691fda | ||
|
Alexander Holliday
|
d5dac6b557 | ||
|
Alexander Holliday
|
f0129f257a | ||
|
Alex Holliday
|
4b9f1ba43b | ||
|
Alex Holliday
|
1322033d41 | ||
|
Alex Holliday
|
7c201d087c | ||
|
Alex Holliday
|
27e34f3b95 | ||
|
Alex Holliday
|
130d825d66 | ||
|
Alex Holliday
|
c6d82223f9 | ||
|
Alex Holliday
|
3bcdd3c445 | ||
|
Alex Holliday
|
3f290bc963 | ||
|
Alex Holliday
|
7d7926fab9 | ||
|
Alex Holliday
|
a09a885786 | ||
|
Alex Holliday
|
76953f9a5c | ||
|
Alex Holliday
|
67bba1479c | ||
|
Alex Holliday
|
b981427d8d | ||
|
Alex Holliday
|
f37ae8fddb | ||
|
Alex Holliday
|
dc80b3cafc | ||
|
Alex Holliday
|
896d1b784b | ||
|
Alex Holliday
|
02640c3155 | ||
|
Alex Holliday
|
5a187cd1c9 | ||
|
Alex Holliday
|
e6a0f89c68 | ||
|
Alex Holliday
|
e96de364c0 | ||
|
Alex Holliday
|
8aa55885e5 | ||
|
Alex Holliday
|
1f7344f2e6 | ||
|
Alex Holliday
|
fe74d4b465 | ||
|
Alexander Holliday
|
9c62dc9c52 | ||
|
Alex Holliday
|
2a2f101d4b | ||
|
Alex Holliday
|
76ce362eea | ||
|
Alex Holliday
|
029f732a86 | ||
|
Alex Holliday
|
a7abbd60bd | ||
|
Alex Holliday
|
9b84b98391 | ||
|
Alex Holliday
|
6c2e3b4fe1 | ||
|
Alex Holliday
|
57acbd3497 | ||
|
Alex Holliday
|
48735c7dc8 | ||
|
Alex Holliday
|
451c752170 | ||
|
Alex Holliday
|
b1871b31a5 | ||
|
Alex Holliday
|
a740a9e005 | ||
|
Alex Holliday
|
43ff7ca4bd | ||
|
Alexander Holliday
|
01a53298c2 | ||
|
Alex Holliday
|
3de392c3c9 | ||
|
Alexander Holliday
|
d1b5830c3d | ||
|
Alex Holliday
|
704f25b987 | ||
|
Alex Holliday
|
f46c2edd1b | ||
|
Alexander Holliday
|
9d7523c406 | ||
|
gorkem-bwl
|
bc7b3a5ffb | ||
|
Alexander Holliday
|
72f23ca025 | ||
|
Alexander Holliday
|
ae9416641c | ||
|
Alex Holliday
|
b7844f8b10 | ||
|
Alexander Holliday
|
ffb563f36d | ||
|
Alexander Holliday
|
ae5115a38f | ||
|
Alex Holliday
|
b925434078 | ||
|
Alex Holliday
|
f713698572 | ||
|
Alex Holliday
|
47d2b62e92 | ||
|
Alex Holliday
|
780189e4a1 | ||
|
Alex Holliday
|
f86ceae0c6 | ||
|
Alex Holliday
|
e78524d1c9 | ||
|
Alex Holliday
|
7a2dab6cc4 | ||
|
Alex Holliday
|
c90442b49f | ||
|
Alex Holliday
|
bdecc1a5e2 | ||
|
Alexander Holliday
|
c1fc537479 | ||
|
Alex Holliday
|
6f0540fb33 | ||
|
Alexander Holliday
|
3876aae484 | ||
 AlexandClaude Opus 4.7 |
2f646ee154 | ||
|
Alexander Holliday
|
01da5847f0 | ||
|
Alex
|
4b888c1ed1 | ||
|
Alex
|
6b63091d89 | ||
|
Alex
|
78fdc548bb | ||
|
Alexander Holliday
|
bbdbe75255 | ||
|
Alexander Holliday
|
74bc5accb6 | ||
|
Alex
|
60770a4544 | ||
|
Alex
|
766d847561 | ||
|
Alex
|
08043a5ea0 | ||
|
Alex
|
272e4b5014 | ||
|
Alex
|
98d2bbfbb9 | ||
|
Alex
|
427f8c632f | ||
|
Alex
|
9a004ab1fb | ||
|
Alexander Holliday
|
c9b9c4a53f | ||
 Agustí Dosaiguas |
db746b0ff2 | ||
|
Agustí Dosaiguas
|
80fca45ce8 | ||
|
Alexander Holliday
|
182ff390e9 | ||
|
Alex
|
fc711e8e24 | ||
|
Alex
|
0f662e1a65 | ||
|
Alex
|
4b4fae91c2 | ||
|
Alex
|
172d36ba1d | ||
|
Alex
|
0c36c8e625 | ||
|
Alex
|
2a7bde9574 | ||
|
Alex
|
cb9cc101c0 | ||
|
Alex
|
06ef850577 | ||
|
Alex
|
0797008ac9 | ||
|
Alex Holliday
|
fda9d9edfe | ||
|
Alex Holliday
|
c6d86d78b8 | ||
|
Alex Holliday
|
0d72071019 | ||
|
Alexander Holliday
|
84533119c9 | ||
|
Alex
|
60cded78a6 | ||
|
gorkem-bwl
|
c45bcfaa2f | ||
|
Alexander Holliday
|
747f31477d | ||
|
Alex
|
713c3ea34f | ||
|
Alex
|
1d90b8d8d9 | ||
|
Alex
|
0827d4f528 | ||
|
Alex
|
7c14d81a24 | ||
|
Alex
|
7906f2f615 | ||
|
gorkem-bwl
|
b462ba7562 | ||
|
gorkem-bwl
|
bd059da94a | ||
|
gorkem-bwl
|
4db95cfa44 | ||
|
gorkem-bwl
|
602769b3e7 | ||
 Gorkem Cetin |
a69f8a5ab5 | ||
|
gorkem-bwl
|
940fc38056 | ||
|
Alexander Holliday
|
bf369aa546 | ||
|
harsh-aghara
|
c72287cb21 | ||
|
harsh-aghara
|
ba2d23fd82 | ||
|
harsh-aghara
|
e725128b10 | ||
|
harsh-aghara
|
baf7344e2d | ||
|
harsh-aghara
|
387cb35494 | ||
|
Alexander Holliday
|
6a8f97ae65 | ||
|
Alex Holliday
|
3365a8f7da | ||
|
Alex Holliday
|
2e9b87ba32 | ||
|
Alex Holliday
|
1fd56610ea | ||
|
Alex Holliday
|
22230b8a08 | ||
|
Alex Holliday
|
f648ab1b24 | ||
|
Alexander Holliday
|
281fc99136 | ||
|
Alex Holliday
|
6f0cc307dc | ||
|
Alex Holliday
|
cb218a46a9 | ||
|
Alexander Holliday
|
39807c2de1 | ||
|
Alexander Holliday
|
59d97f0d25 | ||
|
harsh-aghara
|
657a35e948 | ||
|
harsh-aghara
|
1b0b17b589 | ||
|
harsh-aghara
|
ff34c872c8 | ||
|
gorkem-bwl
|
1458cf4e4a | ||
|
gorkem-bwl
|
cb285bbb66 | ||
|
gorkem-bwl
|
13b13b6818 | ||
|
gorkem-bwl
|
63c1a60b06 | ||
 Iriome |
53c58eb945 | ||
|
gorkem-bwl
|
d5cd957bbd | ||
|
Alexander Holliday
|
5b25666054 | ||
|
Alex Holliday
|
34feb6d3fa | ||
|
Alex Holliday
|
a57da284d7 | ||
|
Alex Hollidayandgorkem-bwl
|
3f9019f34c | ||
|
Retr01-sudo
|
4e284c1468 | ||
|
Retr01-sudo
|
6b9759e455 | ||
|
Retr01-sudo
|
094def117a | ||
|
Gorkem Cetin
|
28baeaf218 | ||
|
Alexander Holliday
|
c535ba8c1a | ||
|
Alex
|
4c04294f71 | ||
|
Alexander Holliday
|
212c1fec52 | ||
|
Alex Holliday
|
05798914a8 | ||
|
Alexander Holliday
|
6a4d8a3f6b | ||
|
Alex Holliday
|
e906b237a0 | ||
|
Alex Holliday
|
bacbf8404e | ||
|
Alex Holliday
|
d47cc65fed | ||
|
Alexander Holliday
|
e077fe52e7 | ||
|
Alexander Holliday
|
f39029a37f | ||
|
Alexander Holliday
|
c8c54ce49e | ||
|
Alexander Holliday
|
021eda098d | ||
|
Alexander Holliday
|
8993ecadce | ||
|
Alexander Holliday
|
f92e0fae3a | ||
|
Alexander Holliday
|
a4b73bc4ed | ||
|
Alexander Holliday
|
87b7ff7452 | ||
|
Alexander Holliday
|
61de273a73 | ||
|
Alexander Holliday
|
04332c47d5 | ||
|
Alexander Holliday
|
f263c78a4d | ||
|
Alexander Holliday
|
de67ea9ee6 | ||
|
Alexander Holliday
|
c9c6c42116 | ||
|
gorkem-bwl
|
79d2eb68fa | ||
|
gorkem-bwl
|
bc9441bcd0 | ||
|
gorkem-bwl
|
d868f6931d | ||
|
gorkem-bwl
|
29dbebd228 | ||
|
gorkem-bwl
|
906d306827 | ||
|
gorkem-bwl
|
aaf7d7e47d | ||
|
gorkem-bwl
|
c40f4e9f1c | ||
|
gorkem-bwl
|
35daed605f | ||
|
gorkem-bwl
|
6434afe2c9 | ||
|
gorkem-bwl
|
788ca78234 | ||
|
gorkem-bwl
|
3adadf0d07 | ||
|
gorkem-bwl
|
55b9702fc3 | ||
|
Iriome
|
49fcab2ee3 | ||
 ZeinebMegaadi |
d41d9a3dab | ||
|
ZeinebMegaadi
|
1a54a24fd5 | ||
 mannilakash |
ac51dfeab7 | ||
|
mannilakash
|
99a5aa1722 | ||
|
mannilakash
|
5791bdd5e7 | ||
|
mannilakash
|
f7514bc938 | ||
|
mannilakash
|
2bbaf7d1eb | ||
 Anton Mrosek |
726e4de6ab |
No files matched your search
Regular → Executable
+21
-2
@@ -1,4 +1,23 @@
|
||||
#!/bin/sh
|
||||
|
||||
# Skip during merge/rebase/cherry-pick/revert. lint-staged's internal
|
||||
# git-stash mechanism is incompatible with these states and will silently
|
||||
# wipe MERGE_HEAD and your conflict resolutions on commit failure.
|
||||
git_dir=$(git rev-parse --git-dir)
|
||||
if [ -e "$git_dir/MERGE_HEAD" ] \
|
||||
|| [ -e "$git_dir/CHERRY_PICK_HEAD" ] \
|
||||
|| [ -e "$git_dir/REVERT_HEAD" ] \
|
||||
|| [ -d "$git_dir/rebase-merge" ] \
|
||||
|| [ -d "$git_dir/rebase-apply" ]; then
|
||||
echo "Skipping lint-staged (mid merge/rebase/cherry-pick/revert)"
|
||||
exit 0
|
||||
fi
|
||||
|
||||
# Anchor to repo root so commits made from a subdirectory still work, and
|
||||
# run each package's lint-staged in a subshell so cwd is scoped (a failure
|
||||
# inside one package can't poison the cwd for the next).
|
||||
cd "$(git rev-parse --show-toplevel)" || exit 1
|
||||
|
||||
echo "Running lint-staged..."
|
||||
cd client && npx lint-staged && cd ..
|
||||
cd server && npx lint-staged && cd ..
|
||||
(cd client && npx lint-staged) || exit 1
|
||||
(cd server && npx lint-staged) || exit 1
|
||||
@@ -159,14 +159,26 @@ When working on anything related to check scheduling, incident lifecycle, or not
|
||||
|
||||
## Code Conventions
|
||||
|
||||
### Frontend conventions (mandatory for `client/src`)
|
||||
Read `docs/frontend-conventions.md` before touching any `.tsx` file. Five rules, all enforced in code review:
|
||||
### Coding conventions (mandatory)
|
||||
Read `docs/coding-conventions.md` before touching any `.tsx` or `.ts` file. The doc covers both frontend and backend rules, all enforced in code review.
|
||||
|
||||
**Universal — rule 0:** look at peer files first and follow the established pattern. Don't sneak in novel shapes.
|
||||
|
||||
**Frontend (`client/src`):**
|
||||
1. Prefer MUI native props over `sx` (e.g. `color={…}`, `bgcolor={…}`, `mt={…}` — not `sx={{ color, bgcolor, mt }}`).
|
||||
2. Use the full theme path for colors: `color={theme.palette.text.secondary}`, never `color="text.secondary"` (greppability).
|
||||
3. No hardcoded literals — use `LAYOUT.*`, `typographyLevels.*`, `theme.shape.borderRadius`, `theme.palette.*`.
|
||||
4. Use `useTheme()` inside components; don't `import { theme } from "@/Utils/Theme/Theme"`.
|
||||
5. Pair runtime tuples with derived types: `const X = [...] as const; type X = (typeof X)[number]`.
|
||||
|
||||
**Backend (`server/src`):**
|
||||
6. Layering: Controller → Service → Repository → Mongoose. No DB calls outside repositories.
|
||||
7. Provider conventions: DI for stdlib clients, `SERVICE_NAME` + `TIMEOUT_MS` constants, `timeRequest()` helper, inline `setTimeout` race for timeout, outer try/catch into `AppError`.
|
||||
8. Mongoose schema fields with closed value sets must declare `enum` reusing the same `types/*` const tuple.
|
||||
9. Provider tests at `server/test/unit/providers/network/<name>.test.ts`, `from "@jest/globals"`, `testStatusProviderContract`, inline `setup()` per test (not `beforeEach`).
|
||||
10. Centralize validation enums in `types/*` const tuples; never inline `z.enum([…])` more than once.
|
||||
11. New entity fields must land in the validator's `*ResponseSchema` so the auto-generated OpenAPI spec sees them.
|
||||
|
||||
### Internationalization
|
||||
All user-facing strings must use the translation function:
|
||||
```javascript
|
||||
|
||||
-172
@@ -1,172 +0,0 @@
|
||||
<p align=center> <a href="https://trendshift.io/repositories/12443" target="_blank"><img src="https://trendshift.io/api/badge/repositories/12443" alt="bluewave-labs%2Fcheckmate | Trendshift" style="width: 250px; height: 55px;" width="250" height="55"/></a></p>
|
||||
|
||||

|
||||

|
||||

|
||||

|
||||

|
||||

|
||||

|
||||
[](https://www.bestpractices.dev/projects/9901)
|
||||
[](https://deepwiki.com/bluewave-labs/checkmate)
|
||||
|
||||
<h1 align="center"><a href="https://bluewavelabs.ca" target="_blank">Checkmate</a></h1>
|
||||
|
||||
<p align="center"><strong>Una aplicación de código abierto para monitoreo de infraestructura y tiempo de actividad</strong></p>
|
||||
|
||||
<img width="1660" alt="image" src="https://github.com/user-attachments/assets/b748f36d-a271-4965-ad0a-18bf153bbee7" />
|
||||
|
||||
Este repositorio contiene tanto el frontend como el backend de Checkmate, una herramienta de monitoreo de código abierto y autoalojada para rastrear hardware de servidores, tiempo de actividad, tiempos de respuesta e incidentes en tiempo real con visualizaciones atractivas. Checkmate revisa regularmente si un servidor o sitio web es accesible y funciona de manera óptima, proporcionando alertas e informes en tiempo real sobre la disponibilidad, el tiempo de inactividad y el tiempo de respuesta de los servicios monitoreados.
|
||||
|
||||
Checkmate también tiene un agente llamado [Capture](https://github.com/bluewave-labs/capture), para recuperar datos de servidores remotos. Aunque Capture no es obligatorio para ejecutar Checkmate, proporciona información adicional sobre el estado de la CPU, RAM, disco y temperatura de tus servidores.
|
||||
|
||||
Checkmate ha sido probado con más de 1000 monitores activos sin problemas ni cuellos de botella de rendimiento.
|
||||
|
||||
**Si deseas patrocinar una función, [visita este enlace](https://checkmate.so/sponsored-features).**
|
||||
|
||||
## 📚 Tabla de contenidos
|
||||
|
||||
- [📦 Demo](#demo)
|
||||
- [🔗 Guía del usuario](#guía-del-usuario)
|
||||
- [🛠️ Instalación](#instalación)
|
||||
- [🏁 Traducciones](#traducciones)
|
||||
- [🚀 Rendimiento](#rendimiento)
|
||||
- [💚 Preguntas e ideas](#preguntas-e-ideas)
|
||||
- [🧩 Características](#características)
|
||||
- [🏗️ Capturas de pantalla](#capturas-de-pantalla)
|
||||
- [🏗️ Tecnologías](#tecnologías)
|
||||
- [🔗 Enlaces útiles](#enlaces-útiles)
|
||||
- [🤝 Contribuciones](#contribuciones)
|
||||
- [💰 Patrocinadores](#patrocinadores)
|
||||
|
||||
...
|
||||
|
||||
**[Texto truncado para mantener la longitud del mensaje manejable]**
|
||||
|
||||
## Demo
|
||||
|
||||
Puedes ver la última versión de [Checkmate](https://checkmate-demo.bluewavelabs.ca/) en acción. El usuario es uptimedemo@demo.com y la contraseña es Demouser1! (ten en cuenta que actualizamos el servidor de demostración de vez en cuando, así que si no funciona para ti, por favor contáctanos en el canal de Discusiones).
|
||||
|
||||
## Guía del usuario
|
||||
|
||||
Las instrucciones de uso se pueden encontrar [aquí](https://checkmate.so/docs). Todavía está en desarrollo y parte de la información puede estar desactualizada ya que continuamente añadimos funciones cada semana. ¡Ten por seguro que estamos haciendo lo mejor posible! :)
|
||||
|
||||
## Instalación
|
||||
|
||||
Consulta las instrucciones de instalación en el [portal de documentación de Checkmate](https://checkmate.so/docs/getting-started/installation).
|
||||
|
||||
Alternativamente, también puedes usar [Coolify](https://coolify.io/), [Elestio](https://elest.io/open-source/checkmate), [K8s](./charts/helm/checkmate/INSTALLATION.md) o [Pikapods](https://www.pikapods.com/) para desplegar rápidamente una instancia de Checkmate. Si deseas monitorear tu infraestructura de servidores, necesitarás el agente [Capture](https://github.com/bluewave-labs/capture). El repositorio de Capture también contiene las instrucciones de instalación.
|
||||
|
||||
## Traducciones
|
||||
|
||||
Si deseas usar Checkmate en tu idioma, por favor [ve a esta página](https://poeditor.com/join/project/lRUoGZFCsJ) y regístrate para el idioma al que te gustaría traducir Checkmate.
|
||||
|
||||
## Rendimiento
|
||||
|
||||
Gracias a extensas optimizaciones, Checkmate opera con un uso de memoria excepcionalmente bajo, requiriendo recursos mínimos de memoria y CPU. Aquí está el uso de memoria de una instancia de Node.js ejecutándose en un servidor que monitorea 323 servidores cada minuto:
|
||||
|
||||

|
||||
|
||||
También puedes ver el consumo de memoria de MongoDB y Redis en el mismo servidor (398Mb y 15Mb) para la misma cantidad de servidores:
|
||||
|
||||

|
||||
|
||||
## Preguntas e Ideas
|
||||
|
||||
Si tienes alguna pregunta, sugerencia o comentario, tienes varias opciones:
|
||||
|
||||
- [Canal de Discord](https://discord.gg/NAb6H3UTjK)
|
||||
- [Discusiones en GitHub](https://github.com/bluewave-labs/checkmate/discussions)
|
||||
- [Grupo en Reddit](https://www.reddit.com/r/CheckmateMonitoring/)
|
||||
|
||||
¡No dudes en hacer preguntas o compartir tus ideas, nos encantaría saber de ti!
|
||||
|
||||
## Características
|
||||
|
||||
- Completamente de código abierto, desplegable en tus propios servidores o dispositivos personales (por ejemplo, Raspberry Pi 4 o 5)
|
||||
- Monitoreo de sitios web
|
||||
- Monitoreo de velocidad de carga
|
||||
- Monitoreo de infraestructura (memoria, uso de disco, rendimiento de CPU, etc) - requiere el agente [Capture](https://github.com/bluewave-labs/capture)
|
||||
- Monitoreo de Docker
|
||||
- Monitoreo con ping
|
||||
- Monitoreo de certificados SSL
|
||||
- Monitoreo de puertos
|
||||
- Incidentes en una sola vista
|
||||
- Páginas de estado
|
||||
- Notificaciones por correo, Webhooks, Discord, Telegram, Slack
|
||||
- Mantenimiento programado
|
||||
- Monitoreo de consultas JSON
|
||||
- Soporte para múltiples idiomas
|
||||
|
||||
**Hoja de ruta a corto plazo:** ([Milestone 2.2](https://github.com/bluewave-labs/Checkmate/milestone/8))
|
||||
|
||||
- Mejores notificaciones
|
||||
- Monitoreo de red
|
||||
- ...y algunas funciones más
|
||||
|
||||
## Capturas de pantalla
|
||||
|
||||
<p>
|
||||
<img width="1628" alt="image" src="https://github.com/user-attachments/assets/2eff6464-0738-4a32-9312-26e1e8e86275" />
|
||||
</p>
|
||||
<p>
|
||||
<img width="1656" alt="image" src="https://github.com/user-attachments/assets/616c3563-c2a7-4ee4-af6c-7e6068955d1a" />
|
||||
</p>
|
||||
<p>
|
||||
<img width="1652" alt="image" src="https://github.com/user-attachments/assets/7912d7cf-0d0e-4f26-aa5c-2ad7170b5c99" />
|
||||
</p>
|
||||
<p>
|
||||
<img width="1652" alt="image" src="https://github.com/user-attachments/assets/08c2c6ac-3a2f-44d1-a229-d1746a3f9d16" />
|
||||
</p>
|
||||
|
||||
## Tecnologías
|
||||
|
||||
- [ReactJs](https://react.dev/)
|
||||
- [MUI (framework de React)](https://mui.com/)
|
||||
- [Node.js](https://nodejs.org/en)
|
||||
- [MongoDB](https://mongodb.com)
|
||||
- [Recharts](https://recharts.org)
|
||||
- ¡Y muchos otros componentes de código abierto!
|
||||
|
||||
## Enlaces útiles
|
||||
|
||||
- Si deseas apoyarnos, por favor considera darle una ⭐ y haz clic en "watch".
|
||||
- ¿Tienes una pregunta o sugerencia para la hoja de ruta? Revisa nuestro [canal de Discord](https://discord.gg/NAb6H3UTjK) o el foro de [Discusiones](https://github.com/bluewave-labs/checkmate/discussions).
|
||||
- ¿Quieres saber cuándo hay una nueva versión? Usa [Newreleases](https://newreleases.io/), un servicio gratuito para seguir lanzamientos.
|
||||
- Mira un video de instalación y uso de Checkmate [aquí](https://www.youtube.com/watch?v=GfFOc0xHIwY)
|
||||
|
||||
## Contribuciones
|
||||
|
||||
Somos [Alex](http://github.com/ajhollid) (líder de equipo), [Vishnu](http://github.com/vishnusn77), [Mohadeseh](http://github.com/mohicody), [Gorkem](http://github.com/gorkem-bwl/), [Owaise](http://github.com/Owaiseimdad), [Aryaman](https://github.com/Br0wnHammer) y [Mert](https://github.com/mertssmnoglu), ayudando a personas y empresas a monitorear su infraestructura y servidores.
|
||||
|
||||
Nos enorgullecemos de construir conexiones fuertes con contribuyentes de todos los niveles. A pesar de ser un proyecto joven, Checkmate ya ha ganado más de 7000 estrellas y ha atraído a más de 90 contribuyentes de todo el mundo.
|
||||
|
||||
Nuestro repositorio ha sido marcado con estrella por empleados de **Google, Microsoft, Intel, Cisco, Tencent, Electronic Arts, ByteDance, JP Morgan Chase, Deloitte, Accenture, Foxconn, Broadcom, China Telecom, Barclays, Capgemini, Wipro, Cloudflare, Dassault Systèmes y NEC**, ¡así que no te detengas — participa, contribuye y aprende con nosotros!
|
||||
|
||||
Cómo contribuir:
|
||||
|
||||
0. Dale una estrella al repositorio :)
|
||||
1. Revisa la [guía para contribuidores](https://github.com/bluewave-labs/Checkmate/blob/develop/CONTRIBUTING.md). Se anima a los nuevos a revisar las etiquetas `good-first-issue`.
|
||||
2. Consulta la [estructura del proyecto](https://deepwiki.com/bluewave-labs/Checkmate#system-architecture) y la [visión general](https://deepwiki.com/bluewave-labs/Checkmate#overview).
|
||||
3. Lee una estructura detallada de [Checkmate](https://deepwiki.com/bluewave-labs/Checkmate) si deseas profundizar en la arquitectura.
|
||||
4. Abre un issue si crees que has encontrado un error.
|
||||
5. Revisa los issues con la etiqueta `good-first-issue` si eres nuevo.
|
||||
6. Haz un pull request para añadir nuevas funciones, mejoras o correcciones.
|
||||
|
||||
<a href="https://github.com/bluewave-labs/checkmate/graphs/contributors">
|
||||
<img src="https://contrib.rocks/image?repo=bluewave-labs/checkmate" />
|
||||
</a>
|
||||
|
||||
[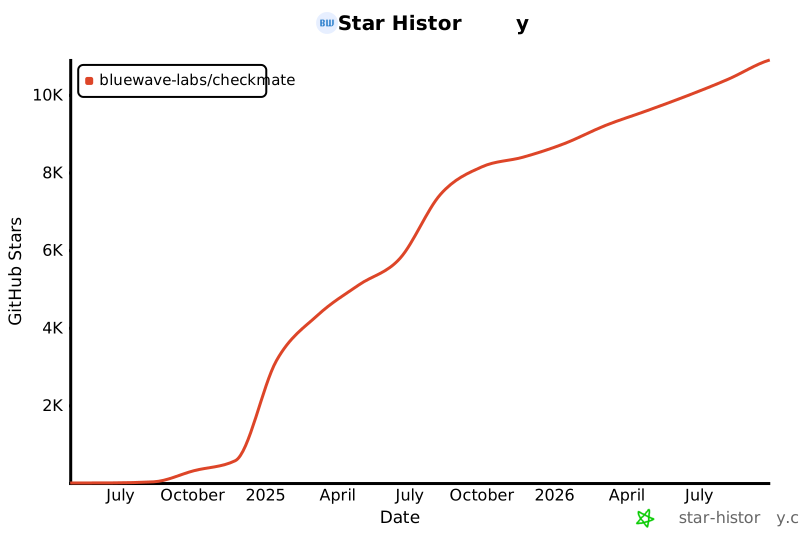](https://star-history.com/#bluewave-labs/bluewave-uptime&Date)
|
||||
|
||||
## Patrocinadores
|
||||
|
||||
Gracias a [Gitbook](https://gitbook.io/) por darnos una cuenta gratuita para su plataforma de documentación, y a [Poeditor](https://poeditor.com/) por proporcionarnos una cuenta gratuita para servicios de traducción. Si deseas patrocinar Checkmate, por favor envía un correo a hello@bluewavelabs.ca
|
||||
|
||||
Si deseas patrocinar una función, [visita esta página](https://checkmate.so/sponsored-features).
|
||||
|
||||
También puedes revisar otros proyectos de BlueWave orientados a desarrolladores y contribuidores:
|
||||
|
||||
- [VerifyWise](https://github.com/bluewave-labs/verifywise), la primera plataforma de gobernanza de IA de código abierto.
|
||||
- [DataRoom](https://github.com/bluewave-labs/bluewave-dataroom), una aplicación de intercambio de archivos seguro, también conocida como dataroom.
|
||||
- [Guidefox](https://github.com/bluewave-labs/guidefox), una app que ayuda a nuevos usuarios a aprender a usar tu producto mediante pistas, tours, popups y banners.
|
||||
@@ -1,5 +1,25 @@
|
||||
<p align=center> <a href="https://trendshift.io/repositories/12443" target="_blank"><img src="https://trendshift.io/api/badge/repositories/12443" alt="bluewave-labs%2Fcheckmate | Trendshift" style="width: 250px; height: 55px;" width="250" height="55"/></a></p>
|
||||
|
||||
|
||||
<p align="center">
|
||||
🇺🇸 <a href="README.md">English</a> |
|
||||
🇸🇦 <a href="docs/translations/README.ar.md">العربية</a> |
|
||||
🇪🇸 <a href="docs/translations/README.ca.md">Català</a> |
|
||||
🇨🇿 <a href="docs/translations/README.cs.md">Čeština</a> |
|
||||
🇩🇪 <a href="docs/translations/README.de.md">Deutsch</a> |
|
||||
🇪🇸 <a href="docs/translations/README.es.md">Español</a> |
|
||||
🇫🇮 <a href="docs/translations/README.fi.md">Suomi</a> |
|
||||
🇫🇷 <a href="docs/translations/README.fr.md">Français</a> |
|
||||
🇯🇵 <a href="docs/translations/README.ja.md">日本語</a> |
|
||||
🇧🇷 <a href="docs/translations/README.pt-BR.md">Português (Brasil)</a> |
|
||||
🇷🇺 <a href="docs/translations/README.ru.md">Русский</a> |
|
||||
🇹🇭 <a href="docs/translations/README.th.md">ไทย</a> |
|
||||
🇹🇷 <a href="docs/translations/README.tr.md">Türkçe</a> |
|
||||
🇺🇦 <a href="docs/translations/README.uk.md">Українська</a> |
|
||||
🇻🇳 <a href="docs/translations/README.vi.md">Tiếng Việt</a> |
|
||||
🇨🇳 <a href="docs/translations/README.zh-CN.md">简体中文</a> |
|
||||
🇹🇼 <a href="docs/translations/README.zh-TW.md">繁體中文</a>
|
||||
</p>
|
||||
|
||||

|
||||

|
||||

|
||||
@@ -7,7 +27,6 @@
|
||||

|
||||

|
||||

|
||||
[](https://www.bestpractices.dev/projects/9901)
|
||||
[](https://deepwiki.com/bluewave-labs/checkmate)
|
||||
|
||||
<h1 align="center"><a href="https://bluewavelabs.ca" target="_blank">Checkmate</a></h1>
|
||||
@@ -41,12 +60,14 @@ Checkmate has been stress-tested with 1000+ active monitors without any particul
|
||||
- [🤝 Contributing](#contributing)
|
||||
|
||||
|
||||
<a id="demo"></a>
|
||||
## Demo
|
||||
|
||||
You can see the latest build of [Checkmate](https://demo.checkmate.so/) in action.
|
||||
|
||||
The username is demouser@demo.com and the password is Demouser1! (just a note that we update the demo server from time to time, so if it doesn't work for you, please ping us on the Discussions channel).
|
||||
|
||||
<a id="users-guide"></a>
|
||||
## User's guide
|
||||
|
||||
Usage instructions can be found [here](https://checkmate.so/docs).
|
||||
@@ -55,6 +76,7 @@ Usage instructions can be found [here](https://checkmate.so/docs).
|
||||
- [Docker](https://www.docker.com/) installed
|
||||
- [Git](https://git-scm.com/) installed
|
||||
|
||||
<a id="installation"></a>
|
||||
## Installation
|
||||
|
||||
See installation instructions in [Checkmate documentation portal](https://checkmate.so/docs).
|
||||
@@ -67,6 +89,7 @@ If you need to monitor internal HTTPS endpoints with certificates from private C
|
||||
|
||||
For more documentation, see the [docs directory](./docs/).
|
||||
|
||||
<a id="performance"></a>
|
||||
## Performance
|
||||
|
||||
Thanks to extensive optimizations, Checkmate operates with an exceptionally small memory footprint, requiring minimal memory and CPU resources. Here’s the memory usage of a Node.js instance running on a server that monitors 323 servers every minute:
|
||||
@@ -77,6 +100,7 @@ You can see the memory footprint of MongoDB and Redis on the same server (398Mb
|
||||
|
||||

|
||||
|
||||
<a id="questions--ideas"></a>
|
||||
## Questions & Ideas
|
||||
|
||||
If you have any questions, suggestions or comments, you have several options:
|
||||
@@ -86,6 +110,7 @@ If you have any questions, suggestions or comments, you have several options:
|
||||
|
||||
Feel free to ask questions or share your ideas - we'd love to hear from you!
|
||||
|
||||
<a id="features"></a>
|
||||
## Features
|
||||
|
||||
- Completely open source, deployable on your servers or home devices (e.g Raspberry Pi 4 or 5)
|
||||
@@ -110,6 +135,7 @@ Feel free to ask questions or share your ideas - we'd love to hear from you!
|
||||
5. Upon a state change: an incident is either created or resolved, depending on the monitor's current status
|
||||
6. Notifications are triggered based on configuration
|
||||
|
||||
<a id="screenshots"></a>
|
||||
## Screenshots
|
||||
|
||||
<p>
|
||||
@@ -127,6 +153,7 @@ Feel free to ask questions or share your ideas - we'd love to hear from you!
|
||||
|
||||
|
||||
|
||||
<a id="tech-stack"></a>
|
||||
## Tech stack
|
||||
|
||||
- [ReactJs](https://react.dev/)
|
||||
@@ -136,6 +163,7 @@ Feel free to ask questions or share your ideas - we'd love to hear from you!
|
||||
- [Recharts](https://recharts.org)
|
||||
- Lots of other open source components!
|
||||
|
||||
<a id="a-few-links"></a>
|
||||
## A few links
|
||||
|
||||
- If you would like to support us, please consider giving it a ⭐ and click on "watch".
|
||||
@@ -143,6 +171,7 @@ Feel free to ask questions or share your ideas - we'd love to hear from you!
|
||||
- Need a ping when there's a new release? Use [Newreleases](https://newreleases.io/), a free service to track releases.
|
||||
- Watch a Checkmate [installation and usage video](https://www.youtube.com/watch?v=GfFOc0xHIwY)
|
||||
|
||||
<a id="contributing"></a>
|
||||
## Contributing
|
||||
|
||||
We are [Alex](http://github.com/ajhollid) (team lead), [Gorkem](http://github.com/gorkem-bwl/), [Aryaman](https://github.com/Br0wnHammer), [Mert](https://github.com/mertssmnoglu) and [Karen](https://github.com/karenvicent) helping individuals and businesses monitor their infra and servers.
|
||||
|
||||
Generated
+277
-30
@@ -18,7 +18,7 @@
|
||||
"@mui/x-date-pickers": "7.29.4",
|
||||
"@reduxjs/toolkit": "2.7.0",
|
||||
"@types/maplibre-gl": "^1.13.2",
|
||||
"axios": "^1.7.4",
|
||||
"axios": "^1.15.2",
|
||||
"dayjs": "1.11.13",
|
||||
"html2canvas": "^1.4.1",
|
||||
"human-interval": "2.0.1",
|
||||
@@ -57,9 +57,10 @@
|
||||
"eslint-plugin-react-hooks": "^5.0.0",
|
||||
"eslint-plugin-react-refresh": "^0.4.6",
|
||||
"lint-staged": "^16.2.7",
|
||||
"mongoose": "9.6.2",
|
||||
"prettier": "^3.3.3",
|
||||
"typescript": "5.9.3",
|
||||
"vite": "6.4.1"
|
||||
"vite": "^6.4.2"
|
||||
}
|
||||
},
|
||||
"node_modules/@babel/code-frame": {
|
||||
@@ -84,6 +85,7 @@
|
||||
"node_modules/@babel/core": {
|
||||
"version": "7.29.0",
|
||||
"license": "MIT",
|
||||
"peer": true,
|
||||
"dependencies": {
|
||||
"@babel/code-frame": "^7.29.0",
|
||||
"@babel/generator": "^7.29.0",
|
||||
@@ -354,6 +356,7 @@
|
||||
"node_modules/@emotion/react": {
|
||||
"version": "11.14.0",
|
||||
"license": "MIT",
|
||||
"peer": true,
|
||||
"dependencies": {
|
||||
"@babel/runtime": "^7.18.3",
|
||||
"@emotion/babel-plugin": "^11.13.5",
|
||||
@@ -391,6 +394,7 @@
|
||||
"node_modules/@emotion/styled": {
|
||||
"version": "11.14.1",
|
||||
"license": "MIT",
|
||||
"peer": true,
|
||||
"dependencies": {
|
||||
"@babel/runtime": "^7.18.3",
|
||||
"@emotion/babel-plugin": "^11.13.5",
|
||||
@@ -1107,6 +1111,16 @@
|
||||
"supercluster": "^8.0.1"
|
||||
}
|
||||
},
|
||||
"node_modules/@mongodb-js/saslprep": {
|
||||
"version": "1.4.11",
|
||||
"resolved": "https://registry.npmjs.org/@mongodb-js/saslprep/-/saslprep-1.4.11.tgz",
|
||||
"integrity": "sha512-o9rAHc0IpIjuPSxRutWpE1F62x7n+4mVS4rCNHkzhIUMQcc18bb6xEq5wd2NdN0WjepIyXIppRshYI2kQDOZVA==",
|
||||
"dev": true,
|
||||
"license": "MIT",
|
||||
"dependencies": {
|
||||
"sparse-bitfield": "^3.0.3"
|
||||
}
|
||||
},
|
||||
"node_modules/@mui/core-downloads-tracker": {
|
||||
"version": "7.3.7",
|
||||
"license": "MIT",
|
||||
@@ -1160,6 +1174,7 @@
|
||||
"node_modules/@mui/material": {
|
||||
"version": "7.3.7",
|
||||
"license": "MIT",
|
||||
"peer": true,
|
||||
"dependencies": {
|
||||
"@babel/runtime": "^7.28.4",
|
||||
"@mui/core-downloads-tracker": "^7.3.7",
|
||||
@@ -1264,6 +1279,7 @@
|
||||
"node_modules/@mui/system": {
|
||||
"version": "7.3.7",
|
||||
"license": "MIT",
|
||||
"peer": true,
|
||||
"dependencies": {
|
||||
"@babel/runtime": "^7.28.4",
|
||||
"@mui/private-theming": "^7.3.7",
|
||||
@@ -2304,6 +2320,7 @@
|
||||
"version": "24.5.2",
|
||||
"devOptional": true,
|
||||
"license": "MIT",
|
||||
"peer": true,
|
||||
"dependencies": {
|
||||
"undici-types": "~7.12.0"
|
||||
}
|
||||
@@ -2319,6 +2336,7 @@
|
||||
"node_modules/@types/react": {
|
||||
"version": "18.3.27",
|
||||
"license": "MIT",
|
||||
"peer": true,
|
||||
"dependencies": {
|
||||
"@types/prop-types": "*",
|
||||
"csstype": "^3.2.2"
|
||||
@@ -2352,6 +2370,23 @@
|
||||
"version": "0.0.6",
|
||||
"license": "MIT"
|
||||
},
|
||||
"node_modules/@types/webidl-conversions": {
|
||||
"version": "7.0.3",
|
||||
"resolved": "https://registry.npmjs.org/@types/webidl-conversions/-/webidl-conversions-7.0.3.tgz",
|
||||
"integrity": "sha512-CiJJvcRtIgzadHCYXw7dqEnMNRjhGZlYK05Mj9OyktqV8uVT8fD2BFOB7S1uwBE3Kj2Z+4UyPmFw/Ixgw/LAlA==",
|
||||
"dev": true,
|
||||
"license": "MIT"
|
||||
},
|
||||
"node_modules/@types/whatwg-url": {
|
||||
"version": "13.0.0",
|
||||
"resolved": "https://registry.npmjs.org/@types/whatwg-url/-/whatwg-url-13.0.0.tgz",
|
||||
"integrity": "sha512-N8WXpbE6Wgri7KUSvrmQcqrMllKZ9uxkYWMt+mCSGwNc0Hsw9VQTW7ApqI4XNrx6/SaM2QQJCzMPDEXE058s+Q==",
|
||||
"dev": true,
|
||||
"license": "MIT",
|
||||
"dependencies": {
|
||||
"@types/webidl-conversions": "*"
|
||||
}
|
||||
},
|
||||
"node_modules/@typescript-eslint/eslint-plugin": {
|
||||
"version": "7.18.0",
|
||||
"resolved": "https://registry.npmjs.org/@typescript-eslint/eslint-plugin/-/eslint-plugin-7.18.0.tgz",
|
||||
@@ -2392,6 +2427,7 @@
|
||||
"integrity": "sha512-4Z+L8I2OqhZV8qA132M4wNL30ypZGYOQVBfMgxDH/K5UX0PNqTu1c6za9ST5r9+tavvHiTWmBnKzpCJ/GlVFtg==",
|
||||
"dev": true,
|
||||
"license": "BSD-2-Clause",
|
||||
"peer": true,
|
||||
"dependencies": {
|
||||
"@typescript-eslint/scope-manager": "7.18.0",
|
||||
"@typescript-eslint/types": "7.18.0",
|
||||
@@ -2672,6 +2708,7 @@
|
||||
"version": "8.15.0",
|
||||
"dev": true,
|
||||
"license": "MIT",
|
||||
"peer": true,
|
||||
"bin": {
|
||||
"acorn": "bin/acorn"
|
||||
},
|
||||
@@ -2925,14 +2962,14 @@
|
||||
}
|
||||
},
|
||||
"node_modules/axios": {
|
||||
"version": "1.13.5",
|
||||
"resolved": "https://registry.npmjs.org/axios/-/axios-1.13.5.tgz",
|
||||
"integrity": "sha512-cz4ur7Vb0xS4/KUN0tPWe44eqxrIu31me+fbang3ijiNscE129POzipJJA6zniq2C/Z6sJCjMimjS8Lc/GAs8Q==",
|
||||
"version": "1.15.2",
|
||||
"resolved": "https://registry.npmjs.org/axios/-/axios-1.15.2.tgz",
|
||||
"integrity": "sha512-wLrXxPtcrPTsNlJmKjkPnNPK2Ihe0hn0wGSaTEiHRPxwjvJwT3hKmXF4dpqxmPO9SoNb2FsYXj/xEo0gHN+D5A==",
|
||||
"license": "MIT",
|
||||
"dependencies": {
|
||||
"follow-redirects": "^1.15.11",
|
||||
"form-data": "^4.0.5",
|
||||
"proxy-from-env": "^1.1.0"
|
||||
"proxy-from-env": "^2.1.0"
|
||||
}
|
||||
},
|
||||
"node_modules/babel-plugin-macros": {
|
||||
@@ -3006,6 +3043,7 @@
|
||||
}
|
||||
],
|
||||
"license": "MIT",
|
||||
"peer": true,
|
||||
"dependencies": {
|
||||
"baseline-browser-mapping": "^2.9.0",
|
||||
"caniuse-lite": "^1.0.30001759",
|
||||
@@ -3020,6 +3058,16 @@
|
||||
"node": "^6 || ^7 || ^8 || ^9 || ^10 || ^11 || ^12 || >=13.7"
|
||||
}
|
||||
},
|
||||
"node_modules/bson": {
|
||||
"version": "7.2.0",
|
||||
"resolved": "https://registry.npmjs.org/bson/-/bson-7.2.0.tgz",
|
||||
"integrity": "sha512-YCEo7KjMlbNlyHhz7zAZNDpIpQbd+wOEHJYezv0nMYTn4x31eIUM2yomNNubclAt63dObUzKHWsBLJ9QcZNSnQ==",
|
||||
"dev": true,
|
||||
"license": "Apache-2.0",
|
||||
"engines": {
|
||||
"node": ">=20.19.0"
|
||||
}
|
||||
},
|
||||
"node_modules/bytewise": {
|
||||
"version": "1.1.0",
|
||||
"resolved": "https://registry.npmjs.org/bytewise/-/bytewise-1.1.0.tgz",
|
||||
@@ -3239,9 +3287,9 @@
|
||||
}
|
||||
},
|
||||
"node_modules/cosmiconfig/node_modules/yaml": {
|
||||
"version": "1.10.2",
|
||||
"resolved": "https://registry.npmjs.org/yaml/-/yaml-1.10.2.tgz",
|
||||
"integrity": "sha512-r3vXyErRCYJ7wg28yvBY5VSoAF8ZvlcW9/BwUzEtUsjvX/DKs24dIkuwjtuprwJJHsbyUbLApepYTR1BN4uHrg==",
|
||||
"version": "1.10.3",
|
||||
"resolved": "https://registry.npmjs.org/yaml/-/yaml-1.10.3.tgz",
|
||||
"integrity": "sha512-vIYeF1u3CjlhAFekPPAk2h/Kv4T3mAkMox5OymRiJQB0spDP10LHvt+K7G9Ny6NuuMAb25/6n1qyUjAcGNf/AA==",
|
||||
"license": "ISC",
|
||||
"engines": {
|
||||
"node": ">= 6"
|
||||
@@ -3437,7 +3485,8 @@
|
||||
},
|
||||
"node_modules/dayjs": {
|
||||
"version": "1.11.13",
|
||||
"license": "MIT"
|
||||
"license": "MIT",
|
||||
"peer": true
|
||||
},
|
||||
"node_modules/debug": {
|
||||
"version": "4.4.3",
|
||||
@@ -3832,6 +3881,7 @@
|
||||
"version": "8.57.1",
|
||||
"dev": true,
|
||||
"license": "MIT",
|
||||
"peer": true,
|
||||
"dependencies": {
|
||||
"@eslint-community/eslint-utils": "^4.2.0",
|
||||
"@eslint-community/regexpp": "^4.6.1",
|
||||
@@ -4191,12 +4241,16 @@
|
||||
}
|
||||
},
|
||||
"node_modules/flatted": {
|
||||
"version": "3.3.3",
|
||||
"version": "3.4.2",
|
||||
"resolved": "https://registry.npmjs.org/flatted/-/flatted-3.4.2.tgz",
|
||||
"integrity": "sha512-PjDse7RzhcPkIJwy5t7KPWQSZ9cAbzQXcafsetQoD7sOJRQlGikNbx7yZp2OotDnJyrDcbyRq3Ttb18iYOqkxA==",
|
||||
"dev": true,
|
||||
"license": "ISC"
|
||||
},
|
||||
"node_modules/follow-redirects": {
|
||||
"version": "1.15.11",
|
||||
"version": "1.16.0",
|
||||
"resolved": "https://registry.npmjs.org/follow-redirects/-/follow-redirects-1.16.0.tgz",
|
||||
"integrity": "sha512-y5rN/uOsadFT/JfYwhxRS5R7Qce+g3zG97+JrtFZlC9klX/W5hD7iiLzScI4nZqUS7DNUdhPgw4xI8W2LuXlUw==",
|
||||
"funding": [
|
||||
{
|
||||
"type": "individual",
|
||||
@@ -4623,6 +4677,7 @@
|
||||
}
|
||||
],
|
||||
"license": "MIT",
|
||||
"peer": true,
|
||||
"dependencies": {
|
||||
"@babel/runtime": "^7.27.6"
|
||||
},
|
||||
@@ -5218,6 +5273,16 @@
|
||||
"node": ">=4.0"
|
||||
}
|
||||
},
|
||||
"node_modules/kareem": {
|
||||
"version": "3.3.0",
|
||||
"resolved": "https://registry.npmjs.org/kareem/-/kareem-3.3.0.tgz",
|
||||
"integrity": "sha512-kpSuLD3/7RenBnjnJdOHXCKC8dTd1JzeOiJhN0necWWci6cC+qX+VuwPnMVgb+a4+KNJSfgqahpnfWaeDXCimw==",
|
||||
"dev": true,
|
||||
"license": "Apache-2.0",
|
||||
"engines": {
|
||||
"node": ">=18.0.0"
|
||||
}
|
||||
},
|
||||
"node_modules/kdbush": {
|
||||
"version": "4.0.2",
|
||||
"resolved": "https://registry.npmjs.org/kdbush/-/kdbush-4.0.2.tgz",
|
||||
@@ -5313,7 +5378,9 @@
|
||||
}
|
||||
},
|
||||
"node_modules/lodash": {
|
||||
"version": "4.17.23",
|
||||
"version": "4.18.1",
|
||||
"resolved": "https://registry.npmjs.org/lodash/-/lodash-4.18.1.tgz",
|
||||
"integrity": "sha512-dMInicTPVE8d1e5otfwmmjlxkZoUpiVLwyeTdUsi/Caj/gfzzblBcCE5sRHV/AsjuCmxWrte2TNGSYuCeCq+0Q==",
|
||||
"license": "MIT"
|
||||
},
|
||||
"node_modules/lodash.merge": {
|
||||
@@ -5406,6 +5473,7 @@
|
||||
"resolved": "https://registry.npmjs.org/maplibre-gl/-/maplibre-gl-5.19.0.tgz",
|
||||
"integrity": "sha512-REhYUN8gNP3HlcIZS6QU2uy8iovl31cXsrNDkCcqWSQbCkcpdYLczqDz5PVIwNH42UQNyvukjes/RoHPDrOUmQ==",
|
||||
"license": "BSD-3-Clause",
|
||||
"peer": true,
|
||||
"dependencies": {
|
||||
"@mapbox/geojson-rewind": "^0.5.2",
|
||||
"@mapbox/jsonlint-lines-primitives": "^2.0.2",
|
||||
@@ -5445,6 +5513,13 @@
|
||||
"node": ">= 0.4"
|
||||
}
|
||||
},
|
||||
"node_modules/memory-pager": {
|
||||
"version": "1.5.0",
|
||||
"resolved": "https://registry.npmjs.org/memory-pager/-/memory-pager-1.5.0.tgz",
|
||||
"integrity": "sha512-ZS4Bp4r/Zoeq6+NLJpP+0Zzm0pR8whtGPf1XExKLJBAczGMnSi3It14OiNCStjQjM6NU1okjQGSxgEZN8eBYKg==",
|
||||
"dev": true,
|
||||
"license": "MIT"
|
||||
},
|
||||
"node_modules/merge2": {
|
||||
"version": "1.4.1",
|
||||
"resolved": "https://registry.npmjs.org/merge2/-/merge2-1.4.1.tgz",
|
||||
@@ -5470,9 +5545,9 @@
|
||||
}
|
||||
},
|
||||
"node_modules/micromatch/node_modules/picomatch": {
|
||||
"version": "2.3.1",
|
||||
"resolved": "https://registry.npmjs.org/picomatch/-/picomatch-2.3.1.tgz",
|
||||
"integrity": "sha512-JU3teHTNjmE2VCGFzuY8EXzCDVwEqB2a8fsIvwaStHhAWJEeVd1o1QD80CU6+ZdEXXSLbSsuLwJjkCBWqRQUVA==",
|
||||
"version": "2.3.2",
|
||||
"resolved": "https://registry.npmjs.org/picomatch/-/picomatch-2.3.2.tgz",
|
||||
"integrity": "sha512-V7+vQEJ06Z+c5tSye8S+nHUfI51xoXIXjHQ99cQtKUkQqqO1kO/KCJUfZXuB47h/YBlDhah2H3hdUGXn8ie0oA==",
|
||||
"dev": true,
|
||||
"license": "MIT",
|
||||
"engines": {
|
||||
@@ -5534,6 +5609,109 @@
|
||||
"url": "https://github.com/sponsors/ljharb"
|
||||
}
|
||||
},
|
||||
"node_modules/mongodb": {
|
||||
"version": "7.2.0",
|
||||
"resolved": "https://registry.npmjs.org/mongodb/-/mongodb-7.2.0.tgz",
|
||||
"integrity": "sha512-F/2+BMZtLVhY30ioZp0dAmZ+IRZMBqI+nrv6t5+9/1AIwCa8sMRC3jBf81lpxMhnZgqq8CoUD503Z1oZWq1/sw==",
|
||||
"dev": true,
|
||||
"license": "Apache-2.0",
|
||||
"dependencies": {
|
||||
"@mongodb-js/saslprep": "^1.3.0",
|
||||
"bson": "^7.2.0",
|
||||
"mongodb-connection-string-url": "^7.0.0"
|
||||
},
|
||||
"engines": {
|
||||
"node": ">=20.19.0"
|
||||
},
|
||||
"peerDependencies": {
|
||||
"@aws-sdk/credential-providers": "^3.806.0",
|
||||
"@mongodb-js/zstd": "^7.0.0",
|
||||
"gcp-metadata": "^7.0.1",
|
||||
"kerberos": "^7.0.0",
|
||||
"mongodb-client-encryption": ">=7.0.0 <7.1.0",
|
||||
"snappy": "^7.3.2",
|
||||
"socks": "^2.8.6"
|
||||
},
|
||||
"peerDependenciesMeta": {
|
||||
"@aws-sdk/credential-providers": {
|
||||
"optional": true
|
||||
},
|
||||
"@mongodb-js/zstd": {
|
||||
"optional": true
|
||||
},
|
||||
"gcp-metadata": {
|
||||
"optional": true
|
||||
},
|
||||
"kerberos": {
|
||||
"optional": true
|
||||
},
|
||||
"mongodb-client-encryption": {
|
||||
"optional": true
|
||||
},
|
||||
"snappy": {
|
||||
"optional": true
|
||||
},
|
||||
"socks": {
|
||||
"optional": true
|
||||
}
|
||||
}
|
||||
},
|
||||
"node_modules/mongodb-connection-string-url": {
|
||||
"version": "7.0.1",
|
||||
"resolved": "https://registry.npmjs.org/mongodb-connection-string-url/-/mongodb-connection-string-url-7.0.1.tgz",
|
||||
"integrity": "sha512-h0AZ9A7IDVwwHyMxmdMXKy+9oNlF0zFoahHiX3vQ8e3KFcSP3VmsmfvtRSuLPxmyv2vjIDxqty8smTgie/SNRQ==",
|
||||
"dev": true,
|
||||
"license": "Apache-2.0",
|
||||
"dependencies": {
|
||||
"@types/whatwg-url": "^13.0.0",
|
||||
"whatwg-url": "^14.1.0"
|
||||
},
|
||||
"engines": {
|
||||
"node": ">=20.19.0"
|
||||
}
|
||||
},
|
||||
"node_modules/mongoose": {
|
||||
"version": "9.6.2",
|
||||
"resolved": "https://registry.npmjs.org/mongoose/-/mongoose-9.6.2.tgz",
|
||||
"integrity": "sha512-7m8HntjkoRnwEmuPC0kdlwcZXJOQf4twumFj+PNzg/anqqZE2Er7hQslqyzy07mP3JcFjoTSgH5765PyqOXsxw==",
|
||||
"dev": true,
|
||||
"license": "MIT",
|
||||
"dependencies": {
|
||||
"kareem": "3.3.0",
|
||||
"mongodb": "~7.2",
|
||||
"mpath": "0.9.0",
|
||||
"mquery": "6.0.0",
|
||||
"ms": "2.1.3",
|
||||
"sift": "17.1.3"
|
||||
},
|
||||
"engines": {
|
||||
"node": ">=20.19.0"
|
||||
},
|
||||
"funding": {
|
||||
"type": "opencollective",
|
||||
"url": "https://opencollective.com/mongoose"
|
||||
}
|
||||
},
|
||||
"node_modules/mpath": {
|
||||
"version": "0.9.0",
|
||||
"resolved": "https://registry.npmjs.org/mpath/-/mpath-0.9.0.tgz",
|
||||
"integrity": "sha512-ikJRQTk8hw5DEoFVxHG1Gn9T/xcjtdnOKIU1JTmGjZZlg9LST2mBLmcX3/ICIbgJydT2GOc15RnNy5mHmzfSew==",
|
||||
"dev": true,
|
||||
"license": "MIT",
|
||||
"engines": {
|
||||
"node": ">=4.0.0"
|
||||
}
|
||||
},
|
||||
"node_modules/mquery": {
|
||||
"version": "6.0.0",
|
||||
"resolved": "https://registry.npmjs.org/mquery/-/mquery-6.0.0.tgz",
|
||||
"integrity": "sha512-b2KQNsmgtkscfeDgkYMcWGn9vZI9YoXh802VDEwE6qc50zxBFQ0Oo8ROkawbPAsXCY1/Z1yp0MagqsZStPWJjw==",
|
||||
"dev": true,
|
||||
"license": "MIT",
|
||||
"engines": {
|
||||
"node": ">=20.19.0"
|
||||
}
|
||||
},
|
||||
"node_modules/ms": {
|
||||
"version": "2.1.3",
|
||||
"license": "MIT"
|
||||
@@ -5881,7 +6059,9 @@
|
||||
"license": "ISC"
|
||||
},
|
||||
"node_modules/picomatch": {
|
||||
"version": "4.0.3",
|
||||
"version": "4.0.4",
|
||||
"resolved": "https://registry.npmjs.org/picomatch/-/picomatch-4.0.4.tgz",
|
||||
"integrity": "sha512-QP88BAKvMam/3NxH6vj2o21R6MjxZUAd6nlwAS/pnGvN9IVLocLHxGYIzFhg6fUQ+5th6P4dv4eW9jX3DSIj7A==",
|
||||
"license": "MIT",
|
||||
"engines": {
|
||||
"node": ">=12"
|
||||
@@ -5912,7 +6092,9 @@
|
||||
}
|
||||
},
|
||||
"node_modules/postcss": {
|
||||
"version": "8.5.6",
|
||||
"version": "8.5.12",
|
||||
"resolved": "https://registry.npmjs.org/postcss/-/postcss-8.5.12.tgz",
|
||||
"integrity": "sha512-W62t/Se6rA0Az3DfCL0AqJwXuKwBeYg6nOaIgzP+xZ7N5BFCI7DYi1qs6ygUYT6rvfi6t9k65UMLJC+PHZpDAA==",
|
||||
"funding": [
|
||||
{
|
||||
"type": "opencollective",
|
||||
@@ -6004,14 +6186,19 @@
|
||||
"license": "MIT"
|
||||
},
|
||||
"node_modules/protocol-buffers-schema": {
|
||||
"version": "3.6.0",
|
||||
"resolved": "https://registry.npmjs.org/protocol-buffers-schema/-/protocol-buffers-schema-3.6.0.tgz",
|
||||
"integrity": "sha512-TdDRD+/QNdrCGCE7v8340QyuXd4kIWIgapsE2+n/SaGiSSbomYl4TjHlvIoCWRpE7wFt02EpB35VVA2ImcBVqw==",
|
||||
"version": "3.6.1",
|
||||
"resolved": "https://registry.npmjs.org/protocol-buffers-schema/-/protocol-buffers-schema-3.6.1.tgz",
|
||||
"integrity": "sha512-VG2K63Igkiv9p76tk1lilczEK1cT+kCjKtkdhw1dQZV3k3IXJbd3o6Ho8b9zJZaHSnT2hKe4I+ObmX9w6m5SmQ==",
|
||||
"license": "MIT"
|
||||
},
|
||||
"node_modules/proxy-from-env": {
|
||||
"version": "1.1.0",
|
||||
"license": "MIT"
|
||||
"version": "2.1.0",
|
||||
"resolved": "https://registry.npmjs.org/proxy-from-env/-/proxy-from-env-2.1.0.tgz",
|
||||
"integrity": "sha512-cJ+oHTW1VAEa8cJslgmUZrc+sjRKgAKl3Zyse6+PV38hZe/V6Z14TbCuXcan9F9ghlz4QrFr2c92TNF82UkYHA==",
|
||||
"license": "MIT",
|
||||
"engines": {
|
||||
"node": ">=10"
|
||||
}
|
||||
},
|
||||
"node_modules/punycode": {
|
||||
"version": "2.3.1",
|
||||
@@ -6063,6 +6250,7 @@
|
||||
"node_modules/react-dom": {
|
||||
"version": "18.3.1",
|
||||
"license": "MIT",
|
||||
"peer": true,
|
||||
"dependencies": {
|
||||
"loose-envify": "^1.1.0",
|
||||
"scheduler": "^0.23.2"
|
||||
@@ -6074,6 +6262,7 @@
|
||||
"node_modules/react-hook-form": {
|
||||
"version": "7.71.1",
|
||||
"license": "MIT",
|
||||
"peer": true,
|
||||
"engines": {
|
||||
"node": ">=18.0.0"
|
||||
},
|
||||
@@ -6273,7 +6462,8 @@
|
||||
},
|
||||
"node_modules/redux": {
|
||||
"version": "5.0.1",
|
||||
"license": "MIT"
|
||||
"license": "MIT",
|
||||
"peer": true
|
||||
},
|
||||
"node_modules/redux-persist": {
|
||||
"version": "6.0.0",
|
||||
@@ -6423,6 +6613,7 @@
|
||||
"resolved": "https://registry.npmjs.org/rollup/-/rollup-4.59.0.tgz",
|
||||
"integrity": "sha512-2oMpl67a3zCH9H79LeMcbDhXW/UmWG/y2zuqnF2jQq5uq9TbM9TVyXvA4+t+ne2IIkBdrLpAaRQAvo7YI/Yyeg==",
|
||||
"license": "MIT",
|
||||
"peer": true,
|
||||
"dependencies": {
|
||||
"@types/estree": "1.0.8"
|
||||
},
|
||||
@@ -6698,6 +6889,13 @@
|
||||
"url": "https://github.com/sponsors/ljharb"
|
||||
}
|
||||
},
|
||||
"node_modules/sift": {
|
||||
"version": "17.1.3",
|
||||
"resolved": "https://registry.npmjs.org/sift/-/sift-17.1.3.tgz",
|
||||
"integrity": "sha512-Rtlj66/b0ICeFzYTuNvX/EF1igRbbnGSvEyT79McoZa/DeGhMyC5pWKOEsZKnpkqtSeovd5FL/bjHWC3CIIvCQ==",
|
||||
"dev": true,
|
||||
"license": "MIT"
|
||||
},
|
||||
"node_modules/signal-exit": {
|
||||
"version": "4.1.0",
|
||||
"resolved": "https://registry.npmjs.org/signal-exit/-/signal-exit-4.1.0.tgz",
|
||||
@@ -6808,6 +7006,16 @@
|
||||
"node": ">=0.10.0"
|
||||
}
|
||||
},
|
||||
"node_modules/sparse-bitfield": {
|
||||
"version": "3.0.3",
|
||||
"resolved": "https://registry.npmjs.org/sparse-bitfield/-/sparse-bitfield-3.0.3.tgz",
|
||||
"integrity": "sha512-kvzhi7vqKTfkh0PZU+2D2PIllw2ymqJKujUcyPMd9Y75Nv4nPbGJZXNhxsgdQab2BmlDct1YnfQCguEvHr7VsQ==",
|
||||
"dev": true,
|
||||
"license": "MIT",
|
||||
"dependencies": {
|
||||
"memory-pager": "^1.0.2"
|
||||
}
|
||||
},
|
||||
"node_modules/split-string": {
|
||||
"version": "3.1.0",
|
||||
"resolved": "https://registry.npmjs.org/split-string/-/split-string-3.1.0.tgz",
|
||||
@@ -7121,6 +7329,19 @@
|
||||
"node": ">=8.0"
|
||||
}
|
||||
},
|
||||
"node_modules/tr46": {
|
||||
"version": "5.1.1",
|
||||
"resolved": "https://registry.npmjs.org/tr46/-/tr46-5.1.1.tgz",
|
||||
"integrity": "sha512-hdF5ZgjTqgAntKkklYw0R03MG2x/bSzTtkxmIRw/sTNV8YXsCJ1tfLAX23lhxhHJlEf3CRCOCGGWw3vI3GaSPw==",
|
||||
"dev": true,
|
||||
"license": "MIT",
|
||||
"dependencies": {
|
||||
"punycode": "^2.3.1"
|
||||
},
|
||||
"engines": {
|
||||
"node": ">=18"
|
||||
}
|
||||
},
|
||||
"node_modules/ts-api-utils": {
|
||||
"version": "1.4.3",
|
||||
"resolved": "https://registry.npmjs.org/ts-api-utils/-/ts-api-utils-1.4.3.tgz",
|
||||
@@ -7234,6 +7455,7 @@
|
||||
"version": "5.9.3",
|
||||
"devOptional": true,
|
||||
"license": "Apache-2.0",
|
||||
"peer": true,
|
||||
"bin": {
|
||||
"tsc": "bin/tsc",
|
||||
"tsserver": "bin/tsserver"
|
||||
@@ -7365,10 +7587,11 @@
|
||||
}
|
||||
},
|
||||
"node_modules/vite": {
|
||||
"version": "6.4.1",
|
||||
"resolved": "https://registry.npmjs.org/vite/-/vite-6.4.1.tgz",
|
||||
"integrity": "sha512-+Oxm7q9hDoLMyJOYfUYBuHQo+dkAloi33apOPP56pzj+vsdJDzr+j1NISE5pyaAuKL4A3UD34qd0lx5+kfKp2g==",
|
||||
"version": "6.4.2",
|
||||
"resolved": "https://registry.npmjs.org/vite/-/vite-6.4.2.tgz",
|
||||
"integrity": "sha512-2N/55r4JDJ4gdrCvGgINMy+HH3iRpNIz8K6SFwVsA+JbQScLiC+clmAxBgwiSPgcG9U15QmvqCGWzMbqda5zGQ==",
|
||||
"license": "MIT",
|
||||
"peer": true,
|
||||
"dependencies": {
|
||||
"esbuild": "^0.25.0",
|
||||
"fdir": "^6.4.4",
|
||||
@@ -7457,6 +7680,30 @@
|
||||
"node": ">=0.10.0"
|
||||
}
|
||||
},
|
||||
"node_modules/webidl-conversions": {
|
||||
"version": "7.0.0",
|
||||
"resolved": "https://registry.npmjs.org/webidl-conversions/-/webidl-conversions-7.0.0.tgz",
|
||||
"integrity": "sha512-VwddBukDzu71offAQR975unBIGqfKZpM+8ZX6ySk8nYhVoo5CYaZyzt3YBvYtRtO+aoGlqxPg/B87NGVZ/fu6g==",
|
||||
"dev": true,
|
||||
"license": "BSD-2-Clause",
|
||||
"engines": {
|
||||
"node": ">=12"
|
||||
}
|
||||
},
|
||||
"node_modules/whatwg-url": {
|
||||
"version": "14.2.0",
|
||||
"resolved": "https://registry.npmjs.org/whatwg-url/-/whatwg-url-14.2.0.tgz",
|
||||
"integrity": "sha512-De72GdQZzNTUBBChsXueQUnPKDkg/5A5zp7pFDuQAj5UFoENpiACU0wlCvzpAGnTkj++ihpKwKyYewn/XNUbKw==",
|
||||
"dev": true,
|
||||
"license": "MIT",
|
||||
"dependencies": {
|
||||
"tr46": "^5.1.0",
|
||||
"webidl-conversions": "^7.0.0"
|
||||
},
|
||||
"engines": {
|
||||
"node": ">=18"
|
||||
}
|
||||
},
|
||||
"node_modules/which": {
|
||||
"version": "2.0.2",
|
||||
"dev": true,
|
||||
@@ -7648,9 +7895,9 @@
|
||||
"license": "ISC"
|
||||
},
|
||||
"node_modules/yaml": {
|
||||
"version": "2.8.2",
|
||||
"resolved": "https://registry.npmjs.org/yaml/-/yaml-2.8.2.tgz",
|
||||
"integrity": "sha512-mplynKqc1C2hTVYxd0PU2xQAc22TI1vShAYGksCCfxbn/dFwnHTNi1bvYsBTkhdUNtGIf5xNOg938rrSSYvS9A==",
|
||||
"version": "2.8.3",
|
||||
"resolved": "https://registry.npmjs.org/yaml/-/yaml-2.8.3.tgz",
|
||||
"integrity": "sha512-AvbaCLOO2Otw/lW5bmh9d/WEdcDFdQp2Z2ZUH3pX9U2ihyUY0nvLv7J6TrWowklRGPYbB/IuIMfYgxaCPg5Bpg==",
|
||||
"devOptional": true,
|
||||
"license": "ISC",
|
||||
"bin": {
|
||||
|
||||
+3
-2
@@ -27,7 +27,7 @@
|
||||
"@mui/x-date-pickers": "7.29.4",
|
||||
"@reduxjs/toolkit": "2.7.0",
|
||||
"@types/maplibre-gl": "^1.13.2",
|
||||
"axios": "^1.7.4",
|
||||
"axios": "^1.15.2",
|
||||
"dayjs": "1.11.13",
|
||||
"html2canvas": "^1.4.1",
|
||||
"human-interval": "2.0.1",
|
||||
@@ -66,8 +66,9 @@
|
||||
"eslint-plugin-react-hooks": "^5.0.0",
|
||||
"eslint-plugin-react-refresh": "^0.4.6",
|
||||
"lint-staged": "^16.2.7",
|
||||
"mongoose": "9.6.2",
|
||||
"prettier": "^3.3.3",
|
||||
"typescript": "5.9.3",
|
||||
"vite": "6.4.1"
|
||||
"vite": "^6.4.2"
|
||||
}
|
||||
}
|
||||
@@ -5,7 +5,7 @@ import { getResponseColor } from "@/Utils/DataUtils";
|
||||
import { HeatmapResponseTimeTooltip } from "@/Components/common/charts/HeatmapResponseTimeTooltip";
|
||||
import type { SxProps } from "@mui/material/styles";
|
||||
import type { ResponsiveStyleValue } from "@mui/system";
|
||||
|
||||
import { MAX_RECENT_CHECKS } from "@/Types/Monitor";
|
||||
interface PlaceholderCheck {
|
||||
status: "placeholder";
|
||||
responseTime: 0;
|
||||
@@ -32,11 +32,11 @@ export const HeatmapResponseTime = ({
|
||||
|
||||
if (!checks || checks.length === 0) return null;
|
||||
|
||||
const latestChecks = checks.slice(-25);
|
||||
const latestChecks = checks.slice(-MAX_RECENT_CHECKS);
|
||||
|
||||
let data: Array<CheckSnapshot | PlaceholderCheck>;
|
||||
if (latestChecks.length !== 25) {
|
||||
const placeholders = Array(25 - latestChecks.length).fill({
|
||||
if (latestChecks.length !== MAX_RECENT_CHECKS) {
|
||||
const placeholders = Array(MAX_RECENT_CHECKS - latestChecks.length).fill({
|
||||
status: "placeholder" as const,
|
||||
});
|
||||
data = [...latestChecks, ...placeholders];
|
||||
@@ -44,13 +44,13 @@ export const HeatmapResponseTime = ({
|
||||
data = latestChecks;
|
||||
}
|
||||
return (
|
||||
<Box sx={{ width: "100%" }}>
|
||||
<Box width={"100%"}>
|
||||
<Box
|
||||
width={"100%"}
|
||||
display={"grid"}
|
||||
gap={gap}
|
||||
sx={{
|
||||
width: "100%",
|
||||
display: "grid",
|
||||
gridTemplateColumns: "repeat(25, 1fr)",
|
||||
gap: gap,
|
||||
gridTemplateColumns: `repeat(${MAX_RECENT_CHECKS}, 1fr)`,
|
||||
alignItems: "stretch",
|
||||
}}
|
||||
>
|
||||
@@ -82,50 +82,50 @@ export const HeatmapResponseTime = ({
|
||||
check={check}
|
||||
>
|
||||
<Box
|
||||
display={"grid"}
|
||||
sx={{
|
||||
display: "grid",
|
||||
gridTemplateRows: "auto auto",
|
||||
}}
|
||||
>
|
||||
<Box
|
||||
display={"flex"}
|
||||
gap={theme.spacing(2)}
|
||||
sx={{
|
||||
display: "flex",
|
||||
flexDirection: "column",
|
||||
gap: theme.spacing(2),
|
||||
}}
|
||||
>
|
||||
<Box
|
||||
width={"100%"}
|
||||
sx={{
|
||||
position: "relative",
|
||||
width: "100%",
|
||||
aspectRatio: "10",
|
||||
}}
|
||||
>
|
||||
<Box
|
||||
bgcolor={statusBg}
|
||||
borderRadius={theme.shape.borderRadius}
|
||||
sx={{
|
||||
position: "absolute",
|
||||
inset: 0,
|
||||
bgcolor: statusBg,
|
||||
borderRadius: theme.spacing(0.5),
|
||||
...availabilityCellSx,
|
||||
}}
|
||||
/>
|
||||
<Box
|
||||
borderRadius={theme.shape.borderRadius}
|
||||
sx={{
|
||||
position: "absolute",
|
||||
inset: 0,
|
||||
pointerEvents: "none",
|
||||
borderRadius: theme.spacing(0.5),
|
||||
boxShadow: `inset 0 0 0 2px ${statusBorder}`,
|
||||
}}
|
||||
/>
|
||||
</Box>
|
||||
<Box
|
||||
width={"100%"}
|
||||
bgcolor={respBg}
|
||||
borderRadius={theme.shape.borderRadius}
|
||||
sx={{
|
||||
width: "100%",
|
||||
aspectRatio: "1 / 1",
|
||||
bgcolor: respBg,
|
||||
borderRadius: theme.spacing(0.5),
|
||||
...responseCellSx,
|
||||
}}
|
||||
/>
|
||||
|
||||
@@ -7,6 +7,7 @@ import type { CheckSnapshot } from "@/Types/Check";
|
||||
import { HeatmapResponseTimeTooltip } from "./HeatmapResponseTimeTooltip";
|
||||
import { useMemo } from "react";
|
||||
import { useTranslation } from "react-i18next";
|
||||
import { MAX_RECENT_CHECKS } from "@/Types/Monitor";
|
||||
|
||||
interface HistogramResponseTimeProps {
|
||||
checks: CheckSnapshot[];
|
||||
@@ -34,7 +35,7 @@ const calculateResponseTimeStats = (checks: CheckSnapshot[]): ResponseTimeStats
|
||||
}
|
||||
|
||||
const responseTimes = validChecks.map((check) => check.originalResponseTime);
|
||||
const max = Math.max(...responseTimes);
|
||||
const max = Math.round(Math.max(...responseTimes));
|
||||
const avg = Math.round(
|
||||
responseTimes.reduce((sum, time) => sum + time, 0) / responseTimes.length
|
||||
);
|
||||
@@ -57,8 +58,11 @@ export const HistogramResponseTime = ({
|
||||
if (!Array.isArray(checks) || checks.length === 0) return null;
|
||||
|
||||
const data =
|
||||
checks.length !== 25
|
||||
? [...checks, ...Array(25 - checks.length).fill({ status: "placeholder" })]
|
||||
checks.length !== MAX_RECENT_CHECKS
|
||||
? [
|
||||
...checks,
|
||||
...Array(MAX_RECENT_CHECKS - checks.length).fill({ status: "placeholder" }),
|
||||
]
|
||||
: checks;
|
||||
|
||||
const chartHeight = typeof height === "number" ? `${height}px` : height;
|
||||
@@ -69,14 +73,20 @@ export const HistogramResponseTime = ({
|
||||
<Stack
|
||||
justifyContent="center"
|
||||
alignItems={statsPosition === "left" ? "flex-end" : "flex-start"}
|
||||
minWidth={70}
|
||||
width={110}
|
||||
pr={statsPosition === "left" ? theme.spacing(8) : 0}
|
||||
pl={statsPosition === "right" ? theme.spacing(8) : 0}
|
||||
>
|
||||
<Typography variant="body2">
|
||||
<Typography
|
||||
variant="body2"
|
||||
noWrap
|
||||
>
|
||||
{t("common.charts.histogram.avg", { value: stats.avg })}
|
||||
</Typography>
|
||||
<Typography variant="body2">
|
||||
<Typography
|
||||
variant="body2"
|
||||
noWrap
|
||||
>
|
||||
{t("common.charts.histogram.max", { value: stats.max })}
|
||||
</Typography>
|
||||
</Stack>
|
||||
@@ -86,17 +96,17 @@ export const HistogramResponseTime = ({
|
||||
<Stack
|
||||
direction={statsPosition === "left" ? "row-reverse" : "row"}
|
||||
alignItems="center"
|
||||
sx={{ width: "100%" }}
|
||||
width={"100%"}
|
||||
>
|
||||
<Box sx={{ flex: 1 }}>
|
||||
<Box
|
||||
width={"100%"}
|
||||
display={"grid"}
|
||||
gap={gridGap}
|
||||
height={chartHeight}
|
||||
sx={{
|
||||
width: "100%",
|
||||
display: "grid",
|
||||
gridTemplateColumns: "repeat(25, 1fr)",
|
||||
gap: gridGap,
|
||||
gridTemplateColumns: `repeat(${MAX_RECENT_CHECKS}, 1fr)`,
|
||||
alignItems: "end",
|
||||
height: chartHeight,
|
||||
}}
|
||||
>
|
||||
{data.map((check, index) => {
|
||||
@@ -108,23 +118,23 @@ export const HistogramResponseTime = ({
|
||||
: theme.palette.error.light;
|
||||
const bar = (
|
||||
<Box
|
||||
width={"100%"}
|
||||
height={"100%"}
|
||||
borderRadius={theme.shape.borderRadius}
|
||||
bgcolor={theme.palette.action.hover}
|
||||
sx={{
|
||||
position: "relative",
|
||||
width: "100%",
|
||||
height: "100%",
|
||||
borderRadius: theme.spacing(1),
|
||||
bgcolor: theme.palette.action.hover,
|
||||
overflow: "hidden",
|
||||
}}
|
||||
>
|
||||
<Box
|
||||
width={"100%"}
|
||||
height={isPlaceholder ? 0 : heightPct}
|
||||
bgcolor={barColor}
|
||||
sx={{
|
||||
position: "absolute",
|
||||
bottom: 0,
|
||||
left: 0,
|
||||
width: "100%",
|
||||
height: isPlaceholder ? 0 : heightPct,
|
||||
bgcolor: barColor,
|
||||
transition: "height 500ms cubic-bezier(0.4, 0, 0.2, 1)",
|
||||
}}
|
||||
/>
|
||||
@@ -133,8 +143,8 @@ export const HistogramResponseTime = ({
|
||||
|
||||
return isPlaceholder ? (
|
||||
<Box
|
||||
height={"100%"}
|
||||
key={index}
|
||||
sx={{ height: "100%" }}
|
||||
>
|
||||
{bar}
|
||||
</Box>
|
||||
|
||||
@@ -1,30 +1,36 @@
|
||||
import { BaseChart } from "@/Components/design-elements";
|
||||
import Stack from "@mui/material/Stack";
|
||||
import Box from "@mui/material/Box";
|
||||
import Box, { type BoxProps } from "@mui/material/Box";
|
||||
import Typography from "@mui/material/Typography";
|
||||
|
||||
import { useTheme } from "@mui/material/styles";
|
||||
import { useMemo, useState, useEffect } from "react";
|
||||
import { forwardRef, useMemo, useState, useEffect } from "react";
|
||||
import { getInfraGaugeColor } from "@/Utils/MonitorUtils";
|
||||
|
||||
const MINIMUM_VALUE = 0;
|
||||
const MAXIMUM_VALUE = 100;
|
||||
|
||||
export const Gauge = ({
|
||||
isLoading = false,
|
||||
progress = 0,
|
||||
radius = 70,
|
||||
strokeWidth = 15,
|
||||
precision = 1,
|
||||
unit = "%",
|
||||
}: {
|
||||
interface GaugeProps extends Omit<BoxProps, "color"> {
|
||||
isLoading?: boolean;
|
||||
progress?: number;
|
||||
radius?: number;
|
||||
strokeWidth?: number;
|
||||
precision?: number;
|
||||
unit?: string;
|
||||
}) => {
|
||||
}
|
||||
|
||||
export const Gauge = forwardRef<HTMLDivElement, GaugeProps>(function Gauge(
|
||||
{
|
||||
isLoading = false,
|
||||
progress = 0,
|
||||
radius = 70,
|
||||
strokeWidth = 15,
|
||||
precision = 1,
|
||||
unit = "%",
|
||||
...rest
|
||||
},
|
||||
ref
|
||||
) {
|
||||
const theme = useTheme();
|
||||
const progressWithinRange = Math.max(MINIMUM_VALUE, Math.min(progress, MAXIMUM_VALUE));
|
||||
|
||||
@@ -51,17 +57,19 @@ export const Gauge = ({
|
||||
const fillColor = getInfraGaugeColor(progressWithinRange, theme);
|
||||
|
||||
if (isLoading) {
|
||||
return;
|
||||
return null;
|
||||
}
|
||||
|
||||
return (
|
||||
<Box
|
||||
ref={ref}
|
||||
display={"inline-block"}
|
||||
position={"relative"}
|
||||
width={radius}
|
||||
height={radius}
|
||||
bgcolor={theme.palette.background.paper}
|
||||
borderRadius={"50%"}
|
||||
{...rest}
|
||||
>
|
||||
<svg
|
||||
viewBox={`0 0 ${totalSize} ${totalSize}`}
|
||||
@@ -105,7 +113,7 @@ export const Gauge = ({
|
||||
</Typography>
|
||||
</Box>
|
||||
);
|
||||
};
|
||||
});
|
||||
|
||||
export const DetailGauge = ({
|
||||
title,
|
||||
|
||||
@@ -1,12 +1,13 @@
|
||||
import type { Monitor } from "@/Types/Monitor";
|
||||
import Stack from "@mui/material/Stack";
|
||||
import Typography from "@mui/material/Typography";
|
||||
import { PulseDot, Dot } from "@/Components/design-elements";
|
||||
import { PulseDot, Dot, StrategyBadge } from "@/Components/design-elements";
|
||||
import { getStatusColor, formatUrl } from "@/Utils/MonitorUtils";
|
||||
import { useTheme } from "@mui/material/styles";
|
||||
import prettyMilliseconds from "pretty-ms";
|
||||
import { typographyLevels } from "@/Utils/Theme/Palette";
|
||||
import useMediaQuery from "@mui/material/useMediaQuery";
|
||||
import { LAYOUT } from "@/Utils/Theme/constants";
|
||||
export const MonitorStatus = ({ monitor }: { monitor: Monitor }) => {
|
||||
const theme = useTheme();
|
||||
const isSmall = useMediaQuery(theme.breakpoints.down("md"));
|
||||
@@ -28,7 +29,7 @@ export const MonitorStatus = ({ monitor }: { monitor: Monitor }) => {
|
||||
<Stack
|
||||
direction="row"
|
||||
alignItems={"center"}
|
||||
gap={theme.spacing(4)}
|
||||
gap={theme.spacing(LAYOUT.XS)}
|
||||
>
|
||||
<PulseDot color={getStatusColor(monitor.status, theme)} />
|
||||
<Typography
|
||||
@@ -41,6 +42,12 @@ export const MonitorStatus = ({ monitor }: { monitor: Monitor }) => {
|
||||
>
|
||||
{formatUrl(monitor?.url)}
|
||||
</Typography>
|
||||
{monitor.type === "pagespeed" && monitor.strategy && (
|
||||
<>
|
||||
<Dot />
|
||||
<StrategyBadge strategy={monitor.strategy} />
|
||||
</>
|
||||
)}
|
||||
{!isSmall && (
|
||||
<>
|
||||
<Dot />
|
||||
|
||||
@@ -0,0 +1,40 @@
|
||||
import { useTranslation } from "react-i18next";
|
||||
import {
|
||||
formatStatusCode,
|
||||
getStatusCodeTooltip,
|
||||
getStatusCodeValueType,
|
||||
} from "@/Utils/statusCode";
|
||||
import { ValueLabel } from "./StatusLabel";
|
||||
import { Tooltip } from "./Tooltip";
|
||||
|
||||
export type StatusCodeLabelProps = {
|
||||
statusCode: number | null | undefined;
|
||||
message?: string | null;
|
||||
fallback?: string;
|
||||
};
|
||||
|
||||
export const StatusCodeLabel = ({
|
||||
statusCode,
|
||||
message,
|
||||
fallback = "N/A",
|
||||
}: StatusCodeLabelProps) => {
|
||||
const { t } = useTranslation();
|
||||
if (!statusCode) {
|
||||
return <>{fallback}</>;
|
||||
}
|
||||
|
||||
const text = formatStatusCode(statusCode, t);
|
||||
const tooltip = getStatusCodeTooltip(statusCode, message, t);
|
||||
const body = (
|
||||
<ValueLabel
|
||||
value={getStatusCodeValueType(statusCode)}
|
||||
text={text}
|
||||
/>
|
||||
);
|
||||
if (!tooltip) return body;
|
||||
return (
|
||||
<Tooltip title={tooltip}>
|
||||
<span>{body}</span>
|
||||
</Tooltip>
|
||||
);
|
||||
};
|
||||
@@ -93,3 +93,20 @@ export const ValueLabel = ({ value, text }: { value: ValueType; text: string })
|
||||
</BaseBox>
|
||||
);
|
||||
};
|
||||
|
||||
export const ColoredLabel = ({ text, color }: { text: string; color: string }) => {
|
||||
const theme = useTheme();
|
||||
|
||||
return (
|
||||
<BaseBox
|
||||
sx={{
|
||||
width: "fit-content",
|
||||
padding: theme.spacing(1, 3),
|
||||
color: color,
|
||||
borderColor: color,
|
||||
}}
|
||||
>
|
||||
<Typography>{text}</Typography>
|
||||
</BaseBox>
|
||||
);
|
||||
};
|
||||
@@ -0,0 +1,42 @@
|
||||
import Stack from "@mui/material/Stack";
|
||||
import Box from "@mui/material/Box";
|
||||
import { useTheme, alpha } from "@mui/material/styles";
|
||||
import { LAYOUT } from "@/Utils/Theme/constants";
|
||||
|
||||
interface StepProgressProps {
|
||||
steps: number;
|
||||
current: number;
|
||||
}
|
||||
|
||||
export const StepProgress = ({ steps, current }: StepProgressProps) => {
|
||||
const theme = useTheme();
|
||||
const activeBg = `linear-gradient(135deg, ${theme.palette.primary.light} 0%, ${theme.palette.primary.main} 100%)`;
|
||||
const completedBg = `linear-gradient(135deg, ${alpha(theme.palette.primary.light, 0.5)} 0%, ${alpha(theme.palette.primary.main, 0.5)} 100%)`;
|
||||
|
||||
const getSegmentBackground = (index: number) => {
|
||||
if (index < current) return completedBg;
|
||||
if (index === current) return activeBg;
|
||||
return theme.palette.divider;
|
||||
};
|
||||
|
||||
return (
|
||||
<Stack
|
||||
direction="row"
|
||||
gap={theme.spacing(LAYOUT.XS)}
|
||||
width="100%"
|
||||
>
|
||||
{Array.from({ length: steps }).map((_, index) => (
|
||||
<Box
|
||||
key={index}
|
||||
flex={1}
|
||||
height={theme.spacing(LAYOUT.XXS)}
|
||||
borderRadius={theme.shape.borderRadius}
|
||||
sx={{
|
||||
background: getSegmentBackground(index),
|
||||
transition: "background 0.2s ease",
|
||||
}}
|
||||
/>
|
||||
))}
|
||||
</Stack>
|
||||
);
|
||||
};
|
||||
@@ -0,0 +1,32 @@
|
||||
import Typography from "@mui/material/Typography";
|
||||
import { useTheme } from "@mui/material/styles";
|
||||
import { useTranslation } from "react-i18next";
|
||||
import type { PageSpeedStrategy } from "@/Types/Monitor";
|
||||
import { SPACING } from "@/Utils/Theme/constants";
|
||||
|
||||
interface StrategyBadgeProps {
|
||||
strategy: PageSpeedStrategy | undefined;
|
||||
variant?: "caption" | "body2";
|
||||
}
|
||||
|
||||
export const StrategyBadge = ({ strategy, variant = "body2" }: StrategyBadgeProps) => {
|
||||
const theme = useTheme();
|
||||
const { t } = useTranslation();
|
||||
|
||||
if (!strategy) {
|
||||
return null;
|
||||
}
|
||||
|
||||
return (
|
||||
<Typography
|
||||
variant={variant}
|
||||
px={SPACING.XXL}
|
||||
py={SPACING.SM}
|
||||
borderRadius={theme.shape.borderRadius}
|
||||
bgcolor={theme.palette.secondary.light}
|
||||
color={theme.palette.text.primary}
|
||||
>
|
||||
{t(`pages.pageSpeed.strategy.${strategy}`)}
|
||||
</Typography>
|
||||
);
|
||||
};
|
||||
@@ -35,6 +35,9 @@ import useMediaQuery from "@mui/material/useMediaQuery";
|
||||
export type Header<T> = {
|
||||
id: number | string;
|
||||
content: React.ReactNode;
|
||||
mobileLabel?: React.ReactNode;
|
||||
hideMobileLabel?: boolean;
|
||||
align?: "left" | "center" | "right" | "justify" | "inherit";
|
||||
onClick?: (event: React.MouseEvent<HTMLTableCellElement | null>, row: T) => void;
|
||||
render: (row: T) => React.ReactNode;
|
||||
};
|
||||
@@ -109,6 +112,24 @@ export function DataTable<
|
||||
key={key}
|
||||
>
|
||||
{headers.map((header) => {
|
||||
if (header.hideMobileLabel) {
|
||||
return (
|
||||
<Grid2
|
||||
container
|
||||
key={header.id}
|
||||
>
|
||||
<Grid2
|
||||
size={12}
|
||||
display="flex"
|
||||
alignItems="center"
|
||||
justifyContent="flex-end"
|
||||
>
|
||||
{header.render(row)}
|
||||
</Grid2>
|
||||
</Grid2>
|
||||
);
|
||||
}
|
||||
|
||||
return (
|
||||
<Grid2
|
||||
container
|
||||
@@ -123,7 +144,7 @@ export function DataTable<
|
||||
component="div"
|
||||
color={theme.palette.text.primary}
|
||||
>
|
||||
{header.content}
|
||||
{header.mobileLabel ?? header.content}
|
||||
</Typography>
|
||||
</Grid2>
|
||||
<Grid2
|
||||
@@ -193,7 +214,7 @@ export function DataTable<
|
||||
{headers.map((header, idx) => {
|
||||
return (
|
||||
<TableCell
|
||||
align={idx === 0 ? "left" : "center"}
|
||||
align={header.align ?? (idx === 0 ? "left" : "center")}
|
||||
key={header.id}
|
||||
>
|
||||
{header.content}
|
||||
@@ -222,7 +243,7 @@ export function DataTable<
|
||||
{headers.map((header, index) => {
|
||||
return (
|
||||
<TableCell
|
||||
align={index === 0 ? "left" : "center"}
|
||||
align={header.align ?? (index === 0 ? "left" : "center")}
|
||||
key={header.id}
|
||||
onClick={
|
||||
header.onClick ? (e) => header.onClick!(e, row) : undefined
|
||||
|
||||
@@ -6,7 +6,11 @@ import type { TooltipProps } from "@mui/material/Tooltip";
|
||||
|
||||
type StyledTooltipProps = TooltipProps;
|
||||
|
||||
export const Tooltip = ({ placement = "top", ...props }: StyledTooltipProps) => {
|
||||
export const Tooltip = ({
|
||||
placement = "top",
|
||||
slotProps,
|
||||
...props
|
||||
}: StyledTooltipProps) => {
|
||||
const theme = useTheme();
|
||||
|
||||
return (
|
||||
@@ -27,6 +31,7 @@ export const Tooltip = ({ placement = "top", ...props }: StyledTooltipProps) =>
|
||||
boxShadow: theme.shadows[6],
|
||||
},
|
||||
},
|
||||
...slotProps,
|
||||
}}
|
||||
>
|
||||
{props.children}
|
||||
|
||||
@@ -25,3 +25,6 @@ export * from "./TextLink";
|
||||
export * from "./NoticeBanner";
|
||||
export * from "./OfflineBanner";
|
||||
export * from "./Avatar";
|
||||
export * from "./StatusCodeLabel";
|
||||
export * from "./StrategyBadge";
|
||||
export * from "./StepProgress";
|
||||
@@ -14,17 +14,19 @@ type AutoCompleteInputProps = Omit<
|
||||
renderInput?: AutocompleteProps<any, boolean, boolean, boolean>["renderInput"];
|
||||
fieldLabel?: string;
|
||||
required?: boolean;
|
||||
renderOptionContent?: (option: any) => React.ReactNode;
|
||||
};
|
||||
|
||||
export const AutoCompleteInput = ({
|
||||
fieldLabel,
|
||||
required,
|
||||
renderInput,
|
||||
renderOptionContent,
|
||||
...props
|
||||
}: AutoCompleteInputProps) => {
|
||||
const theme = useTheme();
|
||||
const multiple = props.multiple;
|
||||
|
||||
const { renderOption: customRenderOption, ...autocompleteProps } = props;
|
||||
const defaultRenderInput = (params: any) => (
|
||||
<TextField
|
||||
{...params}
|
||||
@@ -34,7 +36,7 @@ export const AutoCompleteInput = ({
|
||||
|
||||
const autocomplete = (
|
||||
<Autocomplete
|
||||
{...props}
|
||||
{...autocompleteProps}
|
||||
disableCloseOnSelect={!!multiple}
|
||||
popupIcon={
|
||||
<ChevronDown
|
||||
@@ -46,24 +48,28 @@ export const AutoCompleteInput = ({
|
||||
renderInput={renderInput || defaultRenderInput}
|
||||
getOptionKey={(option) => option.id}
|
||||
renderTags={() => null}
|
||||
renderOption={(props, option, { selected }) => {
|
||||
const { key, ...optionProps } = props;
|
||||
return (
|
||||
<ListItem
|
||||
key={key}
|
||||
{...optionProps}
|
||||
>
|
||||
<Stack
|
||||
direction={"row"}
|
||||
alignItems={"center"}
|
||||
gap={theme.spacing(2)}
|
||||
renderOption={
|
||||
customRenderOption ||
|
||||
((props, option, { selected }) => {
|
||||
const { key, ...optionProps } = props;
|
||||
return (
|
||||
<ListItem
|
||||
key={key}
|
||||
{...optionProps}
|
||||
>
|
||||
{multiple && <Checkbox checked={selected} />}
|
||||
{option.name}
|
||||
</Stack>
|
||||
</ListItem>
|
||||
);
|
||||
}}
|
||||
<Stack
|
||||
direction={"row"}
|
||||
alignItems={"center"}
|
||||
gap={theme.spacing(2)}
|
||||
width="100%"
|
||||
>
|
||||
{multiple && <Checkbox checked={selected} />}
|
||||
{renderOptionContent ? renderOptionContent(option) : option.name}
|
||||
</Stack>
|
||||
</ListItem>
|
||||
);
|
||||
})
|
||||
}
|
||||
sx={{
|
||||
"&.MuiAutocomplete-root .MuiAutocomplete-input": {
|
||||
padding: `0 ${theme.spacing(5)}`,
|
||||
|
||||
@@ -1,7 +1,7 @@
|
||||
import { forwardRef } from "react";
|
||||
import Checkbox from "@mui/material/Checkbox";
|
||||
import type { CheckboxProps } from "@mui/material/Checkbox";
|
||||
import { Square, SquareCheck } from "lucide-react";
|
||||
import { Square, SquareCheck, SquareMinus } from "lucide-react";
|
||||
import { useTheme } from "@mui/material/styles";
|
||||
|
||||
type CheckboxInputProps = CheckboxProps & {
|
||||
@@ -34,9 +34,15 @@ export const CheckboxInput = forwardRef<HTMLInputElement, CheckboxInputProps>(
|
||||
strokeWidth={1.5}
|
||||
/>
|
||||
}
|
||||
indeterminateIcon={
|
||||
<SquareMinus
|
||||
size={16}
|
||||
strokeWidth={1.5}
|
||||
/>
|
||||
}
|
||||
sx={{
|
||||
color: theme.palette.text.secondary,
|
||||
"&.Mui-checked": {
|
||||
"&.Mui-checked, &.MuiCheckbox-indeterminate": {
|
||||
color: theme.palette.primary.main,
|
||||
},
|
||||
"&:hover": { backgroundColor: "transparent" },
|
||||
|
||||
@@ -10,6 +10,7 @@ import type { RootState } from "@/Types/state";
|
||||
export const languageNames: Record<string, string> = {
|
||||
en: "English",
|
||||
de: "Deutsch",
|
||||
ca: "Català",
|
||||
es: "Español",
|
||||
fr: "Français",
|
||||
"pt-BR": "Português (BR)",
|
||||
|
||||
@@ -0,0 +1,102 @@
|
||||
import React from "react";
|
||||
import Box from "@mui/material/Box";
|
||||
import Stack from "@mui/material/Stack";
|
||||
import Typography from "@mui/material/Typography";
|
||||
import Paper from "@mui/material/Paper";
|
||||
import Slide from "@mui/material/Slide";
|
||||
import IconButton from "@mui/material/IconButton";
|
||||
import { X } from "lucide-react";
|
||||
|
||||
import { useTranslation } from "react-i18next";
|
||||
import { useTheme } from "@mui/material/styles";
|
||||
import useMediaQuery from "@mui/material/useMediaQuery";
|
||||
import { LAYOUT } from "@/Utils/Theme/constants";
|
||||
import { useSidebar } from "@/Hooks/useSidebar";
|
||||
|
||||
interface BulkActionsBarProps {
|
||||
selectedCount: number;
|
||||
onCancel: () => void;
|
||||
children?: React.ReactNode;
|
||||
}
|
||||
|
||||
export const BulkActionsBar = ({
|
||||
selectedCount,
|
||||
onCancel,
|
||||
children,
|
||||
}: BulkActionsBarProps) => {
|
||||
const { t } = useTranslation();
|
||||
const theme = useTheme();
|
||||
const isOpen = selectedCount > 0;
|
||||
|
||||
const isSmall = useMediaQuery(theme.breakpoints.down("md"));
|
||||
const { width, collapsedWidth, transition } = useSidebar();
|
||||
|
||||
return (
|
||||
<Box
|
||||
sx={{
|
||||
position: "fixed",
|
||||
bottom: theme.spacing(LAYOUT.XS),
|
||||
left: isSmall ? collapsedWidth : width,
|
||||
right: 0,
|
||||
display: "flex",
|
||||
justifyContent: "center",
|
||||
pointerEvents: "none",
|
||||
zIndex: theme.zIndex.snackbar,
|
||||
transition: transition.replace("width", "left"),
|
||||
}}
|
||||
>
|
||||
<Slide
|
||||
direction="up"
|
||||
in={isOpen}
|
||||
mountOnEnter
|
||||
unmountOnExit
|
||||
>
|
||||
<Paper
|
||||
elevation={6}
|
||||
sx={{
|
||||
pointerEvents: "auto",
|
||||
px: LAYOUT.MD,
|
||||
py: LAYOUT.XS,
|
||||
borderRadius: theme.shape.borderRadius,
|
||||
backgroundColor: theme.palette.background.paper,
|
||||
border: `1px solid ${theme.palette.divider}`,
|
||||
display: "flex",
|
||||
alignItems: "center",
|
||||
gap: LAYOUT.XS,
|
||||
boxShadow: theme.shadows[8],
|
||||
}}
|
||||
>
|
||||
<Stack
|
||||
direction="row"
|
||||
alignItems="center"
|
||||
gap={LAYOUT.XXS}
|
||||
>
|
||||
<Typography
|
||||
variant="body1"
|
||||
fontWeight={600}
|
||||
color={theme.palette.text.primary}
|
||||
>
|
||||
{t("pages.common.monitors.actions.bulkSelected", {
|
||||
count: selectedCount,
|
||||
})}
|
||||
</Typography>
|
||||
<IconButton
|
||||
size="small"
|
||||
onClick={onCancel}
|
||||
aria-label={t("common.buttons.cancel")}
|
||||
>
|
||||
<X size={18} />
|
||||
</IconButton>
|
||||
</Stack>
|
||||
<Stack
|
||||
direction="row"
|
||||
alignItems="center"
|
||||
gap={LAYOUT.XXS}
|
||||
>
|
||||
{children}
|
||||
</Stack>
|
||||
</Paper>
|
||||
</Slide>
|
||||
</Box>
|
||||
);
|
||||
};
|
||||
@@ -1,9 +1,11 @@
|
||||
import Stack from "@mui/material/Stack";
|
||||
import { Select, Button } from "@/Components/inputs";
|
||||
import { Select, Autocomplete, Button, TextField } from "@/Components/inputs";
|
||||
import { ColoredLabel } from "@/Components/design-elements";
|
||||
import MenuItem from "@mui/material/MenuItem";
|
||||
import useMediaQuery from "@mui/material/useMediaQuery";
|
||||
|
||||
import type { MonitorType } from "@/Types/Monitor";
|
||||
import type { Tag } from "@/Types/Tag";
|
||||
import { Typography, useTheme } from "@mui/material";
|
||||
import { useTranslation } from "react-i18next";
|
||||
|
||||
@@ -28,22 +30,34 @@ export const ControlsFilter = ({
|
||||
setSelectedStatus,
|
||||
selectedState,
|
||||
setSelectedState,
|
||||
tagOptions,
|
||||
selectedTags,
|
||||
setSelectedTags,
|
||||
onClearFilters,
|
||||
}: {
|
||||
showTypes?: boolean;
|
||||
selectedTypes?: MonitorType[];
|
||||
setSelectedTypes?: React.Dispatch<React.SetStateAction<MonitorType[]>>;
|
||||
selectedStatus: string;
|
||||
setSelectedStatus: React.Dispatch<React.SetStateAction<string>>;
|
||||
selectedState: string;
|
||||
setSelectedState: React.Dispatch<React.SetStateAction<string>>;
|
||||
selectedStatus?: string;
|
||||
setSelectedStatus?: React.Dispatch<React.SetStateAction<string>>;
|
||||
selectedState?: string;
|
||||
setSelectedState?: React.Dispatch<React.SetStateAction<string>>;
|
||||
tagOptions?: Tag[];
|
||||
selectedTags?: string[];
|
||||
setSelectedTags?: React.Dispatch<React.SetStateAction<string[]>>;
|
||||
onClearFilters: () => void;
|
||||
}) => {
|
||||
const theme = useTheme();
|
||||
const { t } = useTranslation();
|
||||
const isSmall = useMediaQuery(theme.breakpoints.down("md"));
|
||||
const isFilterActive =
|
||||
(selectedTypes?.length ?? 0) > 0 || selectedStatus !== "" || selectedState !== "";
|
||||
(selectedTypes?.length ?? 0) > 0 ||
|
||||
Boolean(selectedStatus) ||
|
||||
Boolean(selectedState) ||
|
||||
(selectedTags?.length ?? 0) > 0;
|
||||
const selectedTagObjects = (tagOptions ?? []).filter((tag) =>
|
||||
(selectedTags ?? []).includes(tag.id)
|
||||
);
|
||||
return (
|
||||
<Stack
|
||||
direction={isSmall ? "column" : "row"}
|
||||
@@ -66,34 +80,68 @@ export const ControlsFilter = ({
|
||||
))}
|
||||
</Select>
|
||||
)}
|
||||
<Select
|
||||
placeholder="Status"
|
||||
value={selectedStatus}
|
||||
onChange={(e) => setSelectedStatus(e.target.value)}
|
||||
>
|
||||
{statuses.map((status) => (
|
||||
<MenuItem
|
||||
key={status}
|
||||
value={status}
|
||||
>
|
||||
<Typography textTransform={"capitalize"}>{status}</Typography>
|
||||
</MenuItem>
|
||||
))}
|
||||
</Select>
|
||||
<Select
|
||||
placeholder="State"
|
||||
value={selectedState}
|
||||
onChange={(e) => setSelectedState(e.target.value)}
|
||||
>
|
||||
{states.map((state) => (
|
||||
<MenuItem
|
||||
key={state}
|
||||
value={state}
|
||||
>
|
||||
<Typography textTransform={"capitalize"}>{state}</Typography>
|
||||
</MenuItem>
|
||||
))}
|
||||
</Select>
|
||||
{setSelectedStatus && (
|
||||
<Select
|
||||
placeholder="Status"
|
||||
value={selectedStatus ?? ""}
|
||||
onChange={(e) => setSelectedStatus(e.target.value)}
|
||||
>
|
||||
{statuses.map((status) => (
|
||||
<MenuItem
|
||||
key={status}
|
||||
value={status}
|
||||
>
|
||||
<Typography textTransform={"capitalize"}>{status}</Typography>
|
||||
</MenuItem>
|
||||
))}
|
||||
</Select>
|
||||
)}
|
||||
{setSelectedState && (
|
||||
<Select
|
||||
placeholder="State"
|
||||
value={selectedState ?? ""}
|
||||
onChange={(e) => setSelectedState(e.target.value)}
|
||||
>
|
||||
{states.map((state) => (
|
||||
<MenuItem
|
||||
key={state}
|
||||
value={state}
|
||||
>
|
||||
<Typography textTransform={"capitalize"}>{state}</Typography>
|
||||
</MenuItem>
|
||||
))}
|
||||
</Select>
|
||||
)}
|
||||
{tagOptions && setSelectedTags && (
|
||||
<Autocomplete
|
||||
multiple
|
||||
options={tagOptions}
|
||||
value={selectedTagObjects}
|
||||
getOptionLabel={(option) => option.name}
|
||||
onChange={(_: unknown, newValue: Tag[]) => {
|
||||
setSelectedTags(newValue.map((tag) => tag.id));
|
||||
}}
|
||||
isOptionEqualToValue={(option, value) => option.id === value.id}
|
||||
renderOptionContent={(option) => (
|
||||
<ColoredLabel
|
||||
text={option.name}
|
||||
color={option.color}
|
||||
/>
|
||||
)}
|
||||
renderInput={(params) => (
|
||||
<TextField
|
||||
{...params}
|
||||
placeholder={t("common.table.headers.tags")}
|
||||
/>
|
||||
)}
|
||||
slotProps={{
|
||||
popper: {
|
||||
sx: { width: "fit-content !important", minWidth: 280 },
|
||||
},
|
||||
}}
|
||||
sx={{ minWidth: 180 }}
|
||||
/>
|
||||
)}
|
||||
{isFilterActive && (
|
||||
<Button
|
||||
variant="contained"
|
||||
|
||||
@@ -3,6 +3,8 @@ import { Box, Typography, Stack, useTheme, GlobalStyles } from "@mui/material";
|
||||
import Map, { Marker, Popup } from "react-map-gl/maplibre";
|
||||
import type { MapRef } from "react-map-gl/maplibre";
|
||||
import type { FlatGeoCheck } from "@/Types/GeoCheck";
|
||||
import { useTranslation } from "react-i18next";
|
||||
import { formatStatusCode } from "@/Utils/statusCode";
|
||||
import "maplibre-gl/dist/maplibre-gl.css";
|
||||
|
||||
interface GeoChecksMapProps {
|
||||
@@ -14,6 +16,7 @@ export const GeoChecksMap = ({ geoChecks }: GeoChecksMapProps) => {
|
||||
const [selectedCheck, setSelectedCheck] = useState<FlatGeoCheck | null>(null);
|
||||
const theme = useTheme();
|
||||
const isDarkMode = theme.palette.mode === "dark";
|
||||
const { t } = useTranslation();
|
||||
|
||||
const mapPopupStyles = (
|
||||
<GlobalStyles
|
||||
@@ -174,7 +177,7 @@ export const GeoChecksMap = ({ geoChecks }: GeoChecksMapProps) => {
|
||||
>
|
||||
Status Code:
|
||||
</Typography>{" "}
|
||||
{selectedCheck.statusCode}
|
||||
{formatStatusCode(selectedCheck.statusCode, t)}
|
||||
</Typography>
|
||||
<Typography variant="body2">
|
||||
<Typography
|
||||
|
||||
@@ -9,6 +9,8 @@ import {
|
||||
ResponsiveContainer,
|
||||
Text,
|
||||
} from "recharts";
|
||||
import type { TooltipProps } from "recharts";
|
||||
import type { NameType, ValueType } from "recharts/types/component/DefaultTooltipContent";
|
||||
import Typography from "@mui/material/Typography";
|
||||
|
||||
import { useSelector } from "react-redux";
|
||||
@@ -18,13 +20,14 @@ import {
|
||||
tooltipDateFormatLookup,
|
||||
} from "@/Utils/TimeUtils";
|
||||
import { useTheme } from "@mui/material/styles";
|
||||
import type { Theme } from "@mui/material/styles";
|
||||
import type { GroupedCheck } from "@/Types/Check";
|
||||
import type { RootState } from "@/Types/state";
|
||||
|
||||
type XTickProps = {
|
||||
x: number;
|
||||
y: number;
|
||||
payload: { value: any };
|
||||
payload: { value: string };
|
||||
range: string;
|
||||
};
|
||||
|
||||
@@ -46,12 +49,9 @@ export const XTick = ({ x, y, payload, range }: XTickProps) => {
|
||||
);
|
||||
};
|
||||
|
||||
type ResponseTimeToolTipProps = {
|
||||
active?: boolean | undefined;
|
||||
payload?: any[];
|
||||
label?: string | number;
|
||||
type ResponseTimeToolTipProps = TooltipProps<ValueType, NameType> & {
|
||||
range: string;
|
||||
theme: any;
|
||||
theme: Theme;
|
||||
uiTimezone: string;
|
||||
};
|
||||
|
||||
@@ -68,7 +68,8 @@ const ResponseTimeToolTip = ({
|
||||
if (!active) return null;
|
||||
|
||||
const format = tooltipDateFormatLookup(range);
|
||||
const responseTime = Math.floor(payload?.[0]?.payload?.avgResponseTime || 0);
|
||||
console.log(payload);
|
||||
const responseTime = Math.floor(payload[0]?.payload?.originalAvgResponseTime || 0);
|
||||
return (
|
||||
<BaseBox sx={{ py: theme.spacing(2), px: theme.spacing(4) }}>
|
||||
<Typography>{formatDateWithTz(String(label), format, uiTimezone)}</Typography>
|
||||
|
||||
@@ -14,3 +14,4 @@ export * from "./charts/HistogramPageSpeedDetails";
|
||||
export * from "./charts/HistogramPageSpeedDetailsTooltip";
|
||||
export * from "./charts/HistogramInfrastructure";
|
||||
export * from "./HeaderMonitorsSummary";
|
||||
export * from "./BulkActionsBar";
|
||||
@@ -17,6 +17,7 @@ import {
|
||||
User,
|
||||
Lock,
|
||||
Users,
|
||||
Tag,
|
||||
} from "lucide-react";
|
||||
|
||||
export const getMenu = (t: Function) => {
|
||||
@@ -41,6 +42,11 @@ export const getMenu = (t: Function) => {
|
||||
path: "notifications",
|
||||
icon: <Icon icon={Bell} />,
|
||||
},
|
||||
{
|
||||
name: t("components.sidebar.menu.tags"),
|
||||
path: "tags",
|
||||
icon: <Icon icon={Tag} />,
|
||||
},
|
||||
{
|
||||
name: t("components.sidebar.menu.checks"),
|
||||
path: "checks",
|
||||
|
||||
@@ -20,6 +20,8 @@ export const useToast = () => {
|
||||
showToast(msg, { ...opts, type: "error" });
|
||||
const toastInfo = (msg: string, opts?: ToastOptions) =>
|
||||
showToast(msg, { ...opts, type: "info" });
|
||||
const toastWarning = (msg: string, opts?: ToastOptions) =>
|
||||
showToast(msg, { ...opts, type: "warning" });
|
||||
|
||||
return { showToast, toastSuccess, toastError, toastInfo };
|
||||
return { showToast, toastSuccess, toastError, toastInfo, toastWarning };
|
||||
};
|
||||
@@ -0,0 +1,105 @@
|
||||
import { useState, useEffect } from "react";
|
||||
import axios from "axios";
|
||||
import { post } from "@/Utils/ApiClient";
|
||||
import { useToast } from "@/Hooks/UseToast";
|
||||
import { useTranslation } from "react-i18next";
|
||||
import { logger } from "@/Utils/logger";
|
||||
import type { Monitor } from "@/Types/Monitor";
|
||||
|
||||
interface ApiResponse {
|
||||
success: boolean;
|
||||
msg: string;
|
||||
data: {
|
||||
monitors: Monitor[];
|
||||
failedCount: number;
|
||||
};
|
||||
}
|
||||
|
||||
interface UseBulkMonitorActionsReturn {
|
||||
selectedRows: string[];
|
||||
setSelectedRows: (rows: string[]) => void;
|
||||
handleBulkPause: () => Promise<void>;
|
||||
handleBulkResume: () => Promise<void>;
|
||||
handleCancelSelection: () => void;
|
||||
}
|
||||
|
||||
export const useBulkMonitorActions = (
|
||||
refetch: () => void,
|
||||
page?: number
|
||||
): UseBulkMonitorActionsReturn => {
|
||||
const [selectedRows, setSelectedRows] = useState<string[]>([]);
|
||||
const { toastSuccess, toastError, toastInfo, toastWarning } = useToast();
|
||||
const { t } = useTranslation();
|
||||
|
||||
// Clear selection when page changes
|
||||
useEffect(() => {
|
||||
setSelectedRows([]);
|
||||
}, [page]);
|
||||
|
||||
const executeBulkAction = async (pause: boolean) => {
|
||||
try {
|
||||
const res = await post<ApiResponse>("/monitors/bulk/pause", {
|
||||
monitorIds: selectedRows,
|
||||
pause,
|
||||
});
|
||||
|
||||
const affectedCount = res.data?.data?.monitors?.length ?? 0;
|
||||
const failedCount = res.data?.data?.failedCount ?? 0;
|
||||
|
||||
if (affectedCount === 0) {
|
||||
const key = pause
|
||||
? "pages.common.monitors.bulkPause.alreadyPaused"
|
||||
: "pages.common.monitors.bulkPause.alreadyRunning";
|
||||
toastInfo(t(key, { count: selectedRows.length }));
|
||||
} else if (failedCount > 0) {
|
||||
toastWarning(
|
||||
t("pages.common.monitors.bulkPause.partialFailure", {
|
||||
successCount: affectedCount,
|
||||
failedCount,
|
||||
})
|
||||
);
|
||||
} else {
|
||||
const key = pause
|
||||
? "pages.common.monitors.bulkPause.paused"
|
||||
: "pages.common.monitors.bulkPause.resumed";
|
||||
toastSuccess(t(key, { count: affectedCount }));
|
||||
}
|
||||
|
||||
setSelectedRows([]);
|
||||
refetch();
|
||||
} catch (err: unknown) {
|
||||
let errMsg = "An error occurred";
|
||||
|
||||
if (axios.isAxiosError(err)) {
|
||||
errMsg = err.response?.data?.msg || err.message || errMsg;
|
||||
} else if (err instanceof Error) {
|
||||
errMsg = err.message;
|
||||
}
|
||||
|
||||
logger.error("Bulk pause/resume failed", err instanceof Error ? err : undefined, {
|
||||
pause,
|
||||
});
|
||||
toastError(errMsg);
|
||||
}
|
||||
};
|
||||
|
||||
const handleBulkPause = async () => {
|
||||
await executeBulkAction(true);
|
||||
};
|
||||
|
||||
const handleBulkResume = async () => {
|
||||
await executeBulkAction(false);
|
||||
};
|
||||
|
||||
const handleCancelSelection = () => {
|
||||
setSelectedRows([]);
|
||||
};
|
||||
|
||||
return {
|
||||
selectedRows,
|
||||
setSelectedRows,
|
||||
handleBulkPause,
|
||||
handleBulkResume,
|
||||
handleCancelSelection,
|
||||
};
|
||||
};
|
||||
@@ -2,6 +2,7 @@ import { useMemo } from "react";
|
||||
import dayjs from "dayjs";
|
||||
import {
|
||||
maintenanceWindowSchema,
|
||||
maintenanceWindowEditSchema,
|
||||
repeatOptions,
|
||||
type MaintenanceWindowFormData,
|
||||
} from "@/Validation/maintenanceWindow";
|
||||
@@ -32,7 +33,7 @@ export const useMaintenanceWindowForm = ({
|
||||
startTime: startDate.format("HH:mm"),
|
||||
duration: data.duration ?? 0,
|
||||
durationUnit: data.durationUnit ?? "minutes",
|
||||
monitors: [data.monitorId],
|
||||
monitors: data.monitorIds,
|
||||
};
|
||||
} else {
|
||||
const now = dayjs();
|
||||
@@ -47,6 +48,9 @@ export const useMaintenanceWindowForm = ({
|
||||
};
|
||||
}
|
||||
|
||||
return { schema: maintenanceWindowSchema, defaults };
|
||||
return {
|
||||
schema: data ? maintenanceWindowEditSchema : maintenanceWindowSchema,
|
||||
defaults,
|
||||
};
|
||||
}, [data]);
|
||||
};
|
||||
+126
-100
@@ -1,5 +1,6 @@
|
||||
import { useMemo } from "react";
|
||||
import { monitorSchema, type MonitorFormData } from "@/Validation/monitor";
|
||||
import { DefaultPageSpeedStrategy } from "@/Types/Monitor";
|
||||
import type { Monitor, MonitorType } from "@/Types/Monitor";
|
||||
|
||||
interface UseMonitorFormOptions {
|
||||
@@ -12,118 +13,143 @@ const getBaseDefaults = (data?: Monitor | null) => ({
|
||||
description: data?.description || "",
|
||||
interval: data?.interval || 60000,
|
||||
notifications: data?.notifications || [],
|
||||
tags: data?.tags || [],
|
||||
statusWindowSize: data?.statusWindowSize || 5,
|
||||
statusWindowThreshold: data?.statusWindowThreshold || 60,
|
||||
});
|
||||
|
||||
// Geo-check defaults — only http and ping support geo checks.
|
||||
const getGeoCheckDefaults = (data?: Monitor | null) => ({
|
||||
geoCheckEnabled: data?.geoCheckEnabled ?? false,
|
||||
geoCheckLocations: data?.geoCheckLocations || [],
|
||||
geoCheckInterval: data?.geoCheckInterval || 300000,
|
||||
});
|
||||
|
||||
export const getMonitorDefaults = (
|
||||
type: MonitorType,
|
||||
data: Monitor | null = null
|
||||
): MonitorFormData => {
|
||||
const base = getBaseDefaults(data);
|
||||
|
||||
let defaults: MonitorFormData;
|
||||
|
||||
switch (type) {
|
||||
case "http":
|
||||
defaults = {
|
||||
...base,
|
||||
...getGeoCheckDefaults(data),
|
||||
type: "http",
|
||||
url: data?.url || "",
|
||||
ignoreTlsErrors: data?.ignoreTlsErrors || false,
|
||||
useAdvancedMatching: data?.useAdvancedMatching || false,
|
||||
matchMethod: data?.matchMethod || "",
|
||||
expectedValue: data?.expectedValue || "",
|
||||
jsonPath: data?.jsonPath || "",
|
||||
};
|
||||
break;
|
||||
case "ping":
|
||||
defaults = {
|
||||
...base,
|
||||
...getGeoCheckDefaults(data),
|
||||
type: "ping",
|
||||
url: data?.url || "",
|
||||
};
|
||||
break;
|
||||
case "port":
|
||||
defaults = {
|
||||
...base,
|
||||
type: "port",
|
||||
url: data?.url || "",
|
||||
port: data?.port || 80,
|
||||
};
|
||||
break;
|
||||
case "docker":
|
||||
defaults = {
|
||||
...base,
|
||||
type: "docker",
|
||||
url: data?.url || "",
|
||||
};
|
||||
break;
|
||||
case "game":
|
||||
defaults = {
|
||||
...base,
|
||||
type: "game",
|
||||
url: data?.url || "",
|
||||
port: data?.port || 27015,
|
||||
gameId: data?.gameId || "",
|
||||
};
|
||||
break;
|
||||
case "grpc":
|
||||
defaults = {
|
||||
...base,
|
||||
type: "grpc",
|
||||
url: data?.url || "",
|
||||
port: data?.port || 50051,
|
||||
grpcServiceName: data?.grpcServiceName || "",
|
||||
ignoreTlsErrors: data?.ignoreTlsErrors || false,
|
||||
};
|
||||
break;
|
||||
case "pagespeed":
|
||||
defaults = {
|
||||
...base,
|
||||
type: "pagespeed",
|
||||
url: data?.url || "",
|
||||
strategy: data?.strategy ?? DefaultPageSpeedStrategy,
|
||||
};
|
||||
break;
|
||||
case "hardware":
|
||||
defaults = {
|
||||
...base,
|
||||
type: "hardware",
|
||||
url: data?.url || "",
|
||||
secret: data?.secret || "",
|
||||
cpuAlertThreshold: data?.cpuAlertThreshold ?? 100,
|
||||
memoryAlertThreshold: data?.memoryAlertThreshold ?? 100,
|
||||
diskAlertThreshold: data?.diskAlertThreshold ?? 100,
|
||||
tempAlertThreshold: data?.tempAlertThreshold ?? 100,
|
||||
selectedDisks: data?.selectedDisks || [],
|
||||
};
|
||||
break;
|
||||
case "websocket":
|
||||
defaults = {
|
||||
...base,
|
||||
type: "websocket",
|
||||
url: data?.url || "",
|
||||
ignoreTlsErrors: data?.ignoreTlsErrors || false,
|
||||
};
|
||||
break;
|
||||
case "dns":
|
||||
defaults = {
|
||||
...base,
|
||||
type: "dns",
|
||||
url: data?.url || "",
|
||||
dnsServer: data?.dnsServer || "",
|
||||
dnsRecordType: data?.dnsRecordType || "A",
|
||||
};
|
||||
break;
|
||||
default:
|
||||
defaults = {
|
||||
...base,
|
||||
...getGeoCheckDefaults(data),
|
||||
type: "http",
|
||||
url: "",
|
||||
ignoreTlsErrors: false,
|
||||
useAdvancedMatching: false,
|
||||
matchMethod: "",
|
||||
expectedValue: "",
|
||||
jsonPath: "",
|
||||
};
|
||||
}
|
||||
|
||||
return defaults;
|
||||
};
|
||||
|
||||
export const useMonitorForm = ({
|
||||
data = null,
|
||||
defaultType = "http",
|
||||
}: UseMonitorFormOptions = {}) => {
|
||||
return useMemo(() => {
|
||||
const type = data?.type || defaultType;
|
||||
const base = getBaseDefaults(data);
|
||||
|
||||
let defaults: MonitorFormData;
|
||||
|
||||
switch (type) {
|
||||
case "http":
|
||||
defaults = {
|
||||
...base,
|
||||
type: "http",
|
||||
url: data?.url || "",
|
||||
ignoreTlsErrors: data?.ignoreTlsErrors || false,
|
||||
useAdvancedMatching: data?.useAdvancedMatching || false,
|
||||
matchMethod: data?.matchMethod || "",
|
||||
expectedValue: data?.expectedValue || "",
|
||||
jsonPath: data?.jsonPath || "",
|
||||
};
|
||||
break;
|
||||
case "ping":
|
||||
defaults = {
|
||||
...base,
|
||||
type: "ping",
|
||||
url: data?.url || "",
|
||||
};
|
||||
break;
|
||||
case "port":
|
||||
defaults = {
|
||||
...base,
|
||||
type: "port",
|
||||
url: data?.url || "",
|
||||
port: data?.port || 80,
|
||||
};
|
||||
break;
|
||||
case "docker":
|
||||
defaults = {
|
||||
...base,
|
||||
type: "docker",
|
||||
url: data?.url || "",
|
||||
};
|
||||
break;
|
||||
case "game":
|
||||
defaults = {
|
||||
...base,
|
||||
type: "game",
|
||||
url: data?.url || "",
|
||||
port: data?.port || 27015,
|
||||
gameId: data?.gameId || "",
|
||||
};
|
||||
break;
|
||||
case "grpc":
|
||||
defaults = {
|
||||
...base,
|
||||
type: "grpc",
|
||||
url: data?.url || "",
|
||||
port: data?.port || 50051,
|
||||
grpcServiceName: data?.grpcServiceName || "",
|
||||
ignoreTlsErrors: data?.ignoreTlsErrors || false,
|
||||
};
|
||||
break;
|
||||
case "pagespeed":
|
||||
defaults = {
|
||||
...base,
|
||||
type: "pagespeed",
|
||||
url: data?.url || "",
|
||||
};
|
||||
break;
|
||||
case "hardware":
|
||||
defaults = {
|
||||
...base,
|
||||
type: "hardware",
|
||||
url: data?.url || "",
|
||||
secret: data?.secret || "",
|
||||
cpuAlertThreshold: data?.cpuAlertThreshold ?? 100,
|
||||
memoryAlertThreshold: data?.memoryAlertThreshold ?? 100,
|
||||
diskAlertThreshold: data?.diskAlertThreshold ?? 100,
|
||||
tempAlertThreshold: data?.tempAlertThreshold ?? 100,
|
||||
selectedDisks: data?.selectedDisks || [],
|
||||
};
|
||||
break;
|
||||
case "websocket":
|
||||
defaults = {
|
||||
...base,
|
||||
type: "websocket",
|
||||
url: data?.url || "",
|
||||
ignoreTlsErrors: data?.ignoreTlsErrors || false,
|
||||
};
|
||||
break;
|
||||
default:
|
||||
defaults = {
|
||||
...base,
|
||||
type: "http",
|
||||
url: "",
|
||||
ignoreTlsErrors: false,
|
||||
useAdvancedMatching: false,
|
||||
matchMethod: "",
|
||||
expectedValue: "",
|
||||
jsonPath: "",
|
||||
};
|
||||
}
|
||||
|
||||
return { schema: monitorSchema, defaults };
|
||||
return { schema: monitorSchema, defaults: getMonitorDefaults(type, data) };
|
||||
}, [data, defaultType]);
|
||||
};
|
||||
@@ -6,6 +6,7 @@ import {
|
||||
DEFAULT_STATUS_PAGE_THEME_MODE,
|
||||
} from "@/Types/StatusPage";
|
||||
import type { Monitor } from "@/Types/Monitor";
|
||||
import { resolveTimezone } from "@/Utils/TimeUtils";
|
||||
|
||||
interface UseStatusPageFormOptions {
|
||||
data?: StatusPage | null;
|
||||
@@ -30,7 +31,7 @@ export const useStatusPageForm = ({
|
||||
const defaults: StatusPageFormData = {
|
||||
companyName: data?.companyName || "",
|
||||
url: data?.url || generateDefaultUrl(),
|
||||
timezone: data?.timezone || Intl.DateTimeFormat().resolvedOptions().timeZone,
|
||||
timezone: resolveTimezone(data?.timezone),
|
||||
type: data?.type || ["uptime"],
|
||||
color: data?.color || "#13715B",
|
||||
monitors: data?.monitors || [],
|
||||
|
||||
@@ -0,0 +1,18 @@
|
||||
import { useMemo } from "react";
|
||||
import { tagSchema, type TagFormData } from "@/Validation/tag";
|
||||
import type { Tag } from "@/Types/Tag";
|
||||
|
||||
interface UseTagsFormOptions {
|
||||
data?: Tag | null;
|
||||
}
|
||||
|
||||
export const useTagsForm = ({ data }: UseTagsFormOptions) => {
|
||||
return useMemo(() => {
|
||||
const defaults: TagFormData = {
|
||||
name: data?.name ?? "",
|
||||
color: data?.color ?? "#13715B",
|
||||
};
|
||||
|
||||
return { schema: tagSchema, defaults };
|
||||
}, [data]);
|
||||
};
|
||||
@@ -1,8 +1,12 @@
|
||||
import { Table, Pagination, ValueLabel, StatusLabel } from "@/Components/design-elements";
|
||||
import {
|
||||
Table,
|
||||
Pagination,
|
||||
StatusLabel,
|
||||
StatusCodeLabel,
|
||||
} from "@/Components/design-elements";
|
||||
import Box from "@mui/material/Box";
|
||||
import type { Header } from "@/Components/design-elements/Table";
|
||||
import type { Monitor } from "@/Types/Monitor";
|
||||
|
||||
import { useTranslation } from "react-i18next";
|
||||
import { formatDateWithTz } from "@/Utils/TimeUtils";
|
||||
import type { Check } from "@/Types/Check";
|
||||
@@ -29,7 +33,7 @@ export const ChecksTable = ({
|
||||
const { t } = useTranslation();
|
||||
const uiTimezone = useSelector((state: RootState) => state.ui.timezone);
|
||||
|
||||
const getHeaders = (t: Function, uiTimezone: string) => {
|
||||
const getHeaders = () => {
|
||||
const headers: Header<Check>[] = [
|
||||
{
|
||||
id: "monitorName",
|
||||
@@ -63,13 +67,10 @@ export const ChecksTable = ({
|
||||
id: "statusCode",
|
||||
content: t("pages.checks.table.headers.statusCode"),
|
||||
render: (row) => {
|
||||
const code = row.statusCode;
|
||||
if (!code) return "N/A";
|
||||
const value = code < 300 ? "positive" : code < 400 ? "neutral" : "negative";
|
||||
return (
|
||||
<ValueLabel
|
||||
value={value}
|
||||
text={String(code)}
|
||||
<StatusCodeLabel
|
||||
statusCode={row.statusCode}
|
||||
message={row.message}
|
||||
/>
|
||||
);
|
||||
},
|
||||
@@ -85,7 +86,7 @@ export const ChecksTable = ({
|
||||
return headers;
|
||||
};
|
||||
|
||||
const headers = getHeaders(t, uiTimezone);
|
||||
const headers = getHeaders();
|
||||
|
||||
const handlePageChange = (
|
||||
_e: React.MouseEvent<HTMLButtonElement> | null,
|
||||
|
||||
File diff suppressed because it is too large.
Load diff
@@ -2,7 +2,7 @@ import Stack from "@mui/material/Stack";
|
||||
import Grid from "@mui/material/Grid";
|
||||
import Divider from "@mui/material/Divider";
|
||||
import Typography from "@mui/material/Typography";
|
||||
import { BaseBox, ValueLabel } from "@/Components/design-elements";
|
||||
import { BaseBox, ValueLabel, StatusCodeLabel } from "@/Components/design-elements";
|
||||
import { LAYOUT } from "@/Utils/Theme/constants";
|
||||
|
||||
import { useTranslation } from "react-i18next";
|
||||
@@ -46,6 +46,7 @@ export const CardDetails = ({ incident, monitor, sx }: CardDetailsProps) => {
|
||||
if (!incident) {
|
||||
return null;
|
||||
}
|
||||
|
||||
return (
|
||||
<Stack
|
||||
gap={theme.spacing(LAYOUT.MD)}
|
||||
@@ -123,7 +124,12 @@ export const CardDetails = ({ incident, monitor, sx }: CardDetailsProps) => {
|
||||
<Cell>{t("pages.incidents.dialog.details.statusCode")}</Cell>
|
||||
</Grid>
|
||||
<Grid size={4}>
|
||||
<Cell>{incident.statusCode ?? "N/A"}</Cell>
|
||||
<Cell>
|
||||
<StatusCodeLabel
|
||||
statusCode={incident.statusCode}
|
||||
message={incident.message}
|
||||
/>
|
||||
</Cell>
|
||||
</Grid>
|
||||
<Grid size={2}>
|
||||
<Cell>{t("pages.incidents.dialog.details.downtime")}</Cell>
|
||||
|
||||
@@ -1,8 +1,6 @@
|
||||
import { Table } from "@/Components/design-elements";
|
||||
import { Table, ValueLabel, StatusCodeLabel } from "@/Components/design-elements";
|
||||
import { Pagination } from "@/Components/design-elements/Table";
|
||||
import type { Header } from "@/Components/design-elements/Table";
|
||||
import { ValueLabel } from "@/Components/design-elements";
|
||||
import type { ValueType } from "@/Components/design-elements/StatusLabel";
|
||||
import { ActionsMenu } from "@/Components/actions-menu";
|
||||
import type { Incident } from "@/Types/Incident";
|
||||
import type { Monitor } from "@/Types/Monitor";
|
||||
@@ -136,13 +134,12 @@ export const IncidentsTable = ({
|
||||
return (
|
||||
<Typography
|
||||
variant="body2"
|
||||
sx={{
|
||||
textTransform: "capitalize",
|
||||
color:
|
||||
row.resolutionType === "manual"
|
||||
? theme.palette.warning.main
|
||||
: theme.palette.success.main,
|
||||
}}
|
||||
color={
|
||||
row.resolutionType === "manual"
|
||||
? theme.palette.warning.main
|
||||
: theme.palette.success.main
|
||||
}
|
||||
textTransform={"capitalize"}
|
||||
>
|
||||
{row.resolutionType}
|
||||
</Typography>
|
||||
@@ -155,15 +152,10 @@ export const IncidentsTable = ({
|
||||
id: "statusCode",
|
||||
content: t("pages.incidents.table.headers.statusCode"),
|
||||
render: (row) => {
|
||||
const code = row.statusCode;
|
||||
if (!code) return "N/A";
|
||||
let value: ValueType = "neutral";
|
||||
if (code < 300) value = "positive";
|
||||
else if (code >= 400) value = "negative";
|
||||
return (
|
||||
<ValueLabel
|
||||
value={value}
|
||||
text={String(code)}
|
||||
<StatusCodeLabel
|
||||
statusCode={row.statusCode}
|
||||
message={row.message}
|
||||
/>
|
||||
);
|
||||
},
|
||||
|
||||
@@ -1,6 +1,14 @@
|
||||
import Box from "@mui/material/Box";
|
||||
import Stack from "@mui/material/Stack";
|
||||
import Typography from "@mui/material/Typography";
|
||||
import { Table, Pagination, StatusLabel, Gauge } from "@/Components/design-elements";
|
||||
import {
|
||||
Table,
|
||||
Pagination,
|
||||
StatusLabel,
|
||||
Gauge,
|
||||
ColoredLabel,
|
||||
} from "@/Components/design-elements";
|
||||
import { SPACING } from "@/Utils/Theme/constants";
|
||||
import type { Header } from "@/Components/design-elements/Table";
|
||||
import { ActionsMenu, type ActionMenuItem } from "@/Components/actions-menu";
|
||||
import { ArrowUp, ArrowDown } from "lucide-react";
|
||||
@@ -12,9 +20,30 @@ import { useNavigate } from "react-router-dom";
|
||||
import { usePost } from "@/Hooks/UseApi";
|
||||
|
||||
import type { Monitor } from "@/Types/Monitor";
|
||||
import type { Tag } from "@/Types/Tag";
|
||||
import { Checkbox } from "@/Components/inputs";
|
||||
|
||||
interface InfraMonitorsTableProps {
|
||||
monitors: Monitor[];
|
||||
tags: Tag[];
|
||||
refetch: () => void;
|
||||
setSelectedMonitor: (monitor: Monitor | null) => void;
|
||||
sortField: string;
|
||||
setSortField: (field: string) => void;
|
||||
sortOrder: "asc" | "desc";
|
||||
setSortOrder: (order: "asc" | "desc") => void;
|
||||
count: number;
|
||||
page: number;
|
||||
setPage: (page: number) => void;
|
||||
rowsPerPage: number;
|
||||
setRowsPerPage: (rowsPerPage: number) => void;
|
||||
selectedRows?: string[];
|
||||
onSelectionChange?: (selected: string[]) => void;
|
||||
}
|
||||
|
||||
export const InfraMonitorsTable = ({
|
||||
monitors,
|
||||
tags,
|
||||
refetch,
|
||||
setSelectedMonitor,
|
||||
sortField,
|
||||
@@ -26,29 +55,32 @@ export const InfraMonitorsTable = ({
|
||||
setPage,
|
||||
rowsPerPage,
|
||||
setRowsPerPage,
|
||||
}: {
|
||||
monitors: Monitor[];
|
||||
refetch: Function;
|
||||
setSelectedMonitor: Function;
|
||||
sortField: string;
|
||||
setSortField: (field: string) => void;
|
||||
sortOrder: "asc" | "desc";
|
||||
setSortOrder: (order: "asc" | "desc") => void;
|
||||
count: number;
|
||||
page: number;
|
||||
setPage: (page: number) => void;
|
||||
rowsPerPage: number;
|
||||
setRowsPerPage: (rowsPerPage: number) => void;
|
||||
}) => {
|
||||
selectedRows = [],
|
||||
onSelectionChange,
|
||||
}: InfraMonitorsTableProps) => {
|
||||
const { t } = useTranslation();
|
||||
const theme = useTheme();
|
||||
const isSmall = useMediaQuery(theme.breakpoints.down("md"));
|
||||
const navigate = useNavigate();
|
||||
const {
|
||||
post,
|
||||
// loading: isPatching,
|
||||
// error: postError,
|
||||
} = usePost<any, Monitor>();
|
||||
const { post } = usePost<Record<string, never>, Monitor>();
|
||||
|
||||
const selectedSet = new Set(selectedRows);
|
||||
const isAllSelected =
|
||||
monitors.length > 0 && monitors.every((m) => selectedSet.has(m.id));
|
||||
const isSomeSelected = selectedRows.length > 0 && !isAllSelected;
|
||||
|
||||
const handleSelectAll = (checked: boolean) => {
|
||||
onSelectionChange?.(checked ? monitors.map((m) => m.id) : []);
|
||||
};
|
||||
|
||||
const handleSelectRow = (id: string, checked: boolean) => {
|
||||
if (!onSelectionChange) return;
|
||||
onSelectionChange(
|
||||
checked ? [...selectedRows, id] : selectedRows.filter((rowId) => rowId !== id)
|
||||
);
|
||||
};
|
||||
|
||||
const isRowSelected = (id: string) => selectedSet.has(id);
|
||||
|
||||
const handlePageChange = (
|
||||
_e: React.MouseEvent<HTMLButtonElement> | null,
|
||||
@@ -65,7 +97,7 @@ export const InfraMonitorsTable = ({
|
||||
setRowsPerPage(value);
|
||||
};
|
||||
|
||||
const handleSort = (e: any, field: string) => {
|
||||
const handleSort = (e: React.MouseEvent, field: string) => {
|
||||
e.preventDefault();
|
||||
e.stopPropagation();
|
||||
if (sortField === field) {
|
||||
@@ -101,13 +133,6 @@ export const InfraMonitorsTable = ({
|
||||
navigate(`/infrastructure/configure/${monitor.id}`);
|
||||
},
|
||||
},
|
||||
// {
|
||||
// id: 5,
|
||||
// label: "Clone",
|
||||
// action: () => {
|
||||
|
||||
// },
|
||||
// },
|
||||
{
|
||||
id: 6,
|
||||
label:
|
||||
@@ -152,8 +177,35 @@ export const InfraMonitorsTable = ({
|
||||
</Box>
|
||||
);
|
||||
const headers: Header<Monitor>[] = [
|
||||
{
|
||||
id: "selection",
|
||||
content: (
|
||||
<Checkbox
|
||||
aria-label={t("pages.common.monitors.actions.selectAll")}
|
||||
indeterminate={isSomeSelected}
|
||||
checked={isAllSelected}
|
||||
onChange={(e) => handleSelectAll(e.target.checked)}
|
||||
/>
|
||||
),
|
||||
hideMobileLabel: true,
|
||||
render: (row) => (
|
||||
<Checkbox
|
||||
aria-label={t("pages.common.monitors.actions.selectMonitor", {
|
||||
name: row.name,
|
||||
})}
|
||||
checked={isRowSelected(row.id)}
|
||||
onChange={(e) => {
|
||||
handleSelectRow(row.id, e.target.checked);
|
||||
}}
|
||||
onClick={(e) => e.stopPropagation()}
|
||||
/>
|
||||
),
|
||||
onClick: (e) => e?.stopPropagation(),
|
||||
},
|
||||
{
|
||||
id: "name",
|
||||
align: "left",
|
||||
mobileLabel: t("common.table.headers.name"),
|
||||
content: (
|
||||
<Typography
|
||||
component="div"
|
||||
@@ -173,18 +225,20 @@ export const InfraMonitorsTable = ({
|
||||
},
|
||||
{
|
||||
id: "status",
|
||||
mobileLabel: t("common.table.headers.status"),
|
||||
content: (
|
||||
<Typography
|
||||
component="div"
|
||||
display="inline-flex"
|
||||
alignItems="center"
|
||||
<Stack
|
||||
gap={theme.spacing(4)}
|
||||
direction={"row"}
|
||||
justifyContent={"center"}
|
||||
alignItems={"center"}
|
||||
onClick={(e) => handleSort(e, "status")}
|
||||
sx={{ cursor: "pointer" }}
|
||||
>
|
||||
<Box width={theme.spacing(8)} />
|
||||
{t("common.table.headers.status")}
|
||||
{renderSortIcon(sortField === "status")}
|
||||
</Typography>
|
||||
</Stack>
|
||||
),
|
||||
render: (row) => {
|
||||
return <StatusLabel status={row.status} />;
|
||||
@@ -223,6 +277,32 @@ export const InfraMonitorsTable = ({
|
||||
return <Gauge progress={diskUsage} />;
|
||||
},
|
||||
},
|
||||
{
|
||||
id: "tags",
|
||||
content: t("common.table.headers.tags"),
|
||||
render: (row) => {
|
||||
if (row.tags.length === 0) return "-";
|
||||
return (
|
||||
<Stack
|
||||
justifyContent={"center"}
|
||||
direction={isSmall ? "column" : "row"}
|
||||
gap={theme.spacing(SPACING.LG)}
|
||||
>
|
||||
{row.tags.map((tagId) => {
|
||||
const fullTag = tags.find((t) => t.id === tagId);
|
||||
if (!fullTag) return null;
|
||||
return (
|
||||
<ColoredLabel
|
||||
key={fullTag.id}
|
||||
text={fullTag.name}
|
||||
color={fullTag.color}
|
||||
/>
|
||||
);
|
||||
})}
|
||||
</Stack>
|
||||
);
|
||||
},
|
||||
},
|
||||
|
||||
{
|
||||
id: "actions",
|
||||
@@ -248,6 +328,11 @@ export const InfraMonitorsTable = ({
|
||||
onRowClick={(row) => {
|
||||
navigate(`/infrastructure/${row.id}`);
|
||||
}}
|
||||
getRowSx={(row) => ({
|
||||
backgroundColor: isRowSelected(row.id)
|
||||
? theme.palette.action.selected
|
||||
: "inherit",
|
||||
})}
|
||||
/>
|
||||
<Pagination
|
||||
component="div"
|
||||
|
||||
@@ -1,14 +1,22 @@
|
||||
import Stack from "@mui/material/Stack";
|
||||
import Typography from "@mui/material/Typography";
|
||||
import useMediaQuery from "@mui/material/useMediaQuery";
|
||||
import { MonitorBasePageWithStates } from "@/Components/design-elements";
|
||||
import { MonitorBasePageWithStates, ColoredLabel } from "@/Components/design-elements";
|
||||
import { HeaderCreate } from "@/Components/common";
|
||||
import { ControlsFilter, HeaderMonitorsSummary } from "@/Components/monitors";
|
||||
import { TextField, Dialog } from "@/Components/inputs";
|
||||
import {
|
||||
ControlsFilter,
|
||||
HeaderMonitorsSummary,
|
||||
BulkActionsBar,
|
||||
} from "@/Components/monitors";
|
||||
import { TextField, Dialog, Button } from "@/Components/inputs";
|
||||
import { Play, Pause } from "lucide-react";
|
||||
|
||||
import { useGet, useDelete } from "@/Hooks/UseApi";
|
||||
import { useIsAdmin } from "@/Hooks/useIsAdmin";
|
||||
import type { Monitor, MonitorsWithChecksResponse } from "@/Types/Monitor";
|
||||
import type { Tag } from "@/Types/Tag";
|
||||
import { useTheme } from "@mui/material";
|
||||
import { SPACING } from "@/Utils/Theme/constants";
|
||||
import { useState, useCallback, useMemo } from "react";
|
||||
import { useTranslation } from "react-i18next";
|
||||
import { useSelector, useDispatch } from "react-redux";
|
||||
@@ -16,6 +24,7 @@ import { setRowsPerPage } from "@/Features/UI/uiSlice.js";
|
||||
import type { RootState } from "@/Types/state";
|
||||
import { InfraMonitorsTable } from "./Components/MonitorsTable";
|
||||
import useDebounce from "@/Hooks/useDebounce";
|
||||
import { useBulkMonitorActions } from "@/Hooks/useBulkMonitorActions";
|
||||
|
||||
const InfrastructureMonitors = () => {
|
||||
const { t } = useTranslation();
|
||||
@@ -32,11 +41,15 @@ const InfrastructureMonitors = () => {
|
||||
// Local state
|
||||
const [selectedStatus, setSelectedStatus] = useState<string>("");
|
||||
const [selectedState, setSelectedState] = useState<string>("");
|
||||
const [selectedTags, setSelectedTags] = useState<string[]>([]);
|
||||
const [search, setSearch] = useState<string>("");
|
||||
const [page, setPage] = useState<number>(0);
|
||||
const [sortField, setSortField] = useState<string>("");
|
||||
const [sortOrder, setSortOrder] = useState<"asc" | "desc">("asc");
|
||||
const [selectedMonitor, setSelectedMonitor] = useState<Monitor | null>(null);
|
||||
|
||||
const { data: tags } = useGet<Tag[]>("/tags/team");
|
||||
|
||||
const isDialogOpen = Boolean(selectedMonitor);
|
||||
|
||||
const debouncedSearch = useDebounce<string>(search, 300);
|
||||
@@ -44,6 +57,7 @@ const InfrastructureMonitors = () => {
|
||||
const handleClearFilters = useCallback(() => {
|
||||
setSelectedStatus("");
|
||||
setSelectedState("");
|
||||
setSelectedTags([]);
|
||||
setSearch("");
|
||||
}, []);
|
||||
|
||||
@@ -74,6 +88,7 @@ const InfrastructureMonitors = () => {
|
||||
const monitorsWithChecksUrl = useMemo(() => {
|
||||
const params = new URLSearchParams();
|
||||
params.append("type", "hardware");
|
||||
selectedTags.forEach((tagId) => params.append("tags", tagId));
|
||||
params.append("limit", "1");
|
||||
if (page !== undefined) params.append("page", String(page));
|
||||
if (rowsPerPage) params.append("rowsPerPage", String(rowsPerPage));
|
||||
@@ -81,7 +96,7 @@ const InfrastructureMonitors = () => {
|
||||
if (field) params.append("field", field);
|
||||
if (sortOrder) params.append("order", sortOrder);
|
||||
return `/monitors/team/with-checks?${params.toString()}`;
|
||||
}, [page, rowsPerPage, filter, field, sortOrder]);
|
||||
}, [page, rowsPerPage, filter, field, sortOrder, selectedTags]);
|
||||
|
||||
const {
|
||||
data: monitorsWithChecksData,
|
||||
@@ -97,8 +112,19 @@ const InfrastructureMonitors = () => {
|
||||
const { summary, count } = monitorsWithChecksData ?? { summary: null, count: 0 };
|
||||
const isLoading = monitorsWithChecksLoading;
|
||||
|
||||
// Bulk actions
|
||||
const {
|
||||
selectedRows,
|
||||
setSelectedRows,
|
||||
handleBulkPause,
|
||||
handleBulkResume,
|
||||
handleCancelSelection,
|
||||
} = useBulkMonitorActions(refetch, page);
|
||||
|
||||
// Check if any filters are active
|
||||
const hasActiveFilters = Boolean(selectedStatus || selectedState || search);
|
||||
const hasActiveFilters = Boolean(
|
||||
selectedStatus || selectedState || selectedTags.length > 0 || search
|
||||
);
|
||||
|
||||
// Show empty state only when there are truly no monitors (not just filtered out)
|
||||
const effectiveTotalCount =
|
||||
@@ -149,6 +175,9 @@ const InfrastructureMonitors = () => {
|
||||
setSelectedStatus={setSelectedStatus}
|
||||
selectedState={selectedState}
|
||||
setSelectedState={setSelectedState}
|
||||
tagOptions={tags ?? []}
|
||||
selectedTags={selectedTags}
|
||||
setSelectedTags={setSelectedTags}
|
||||
onClearFilters={handleClearFilters}
|
||||
/>
|
||||
<TextField
|
||||
@@ -159,8 +188,56 @@ const InfrastructureMonitors = () => {
|
||||
}}
|
||||
/>
|
||||
</Stack>
|
||||
|
||||
{selectedTags.length > 0 && (
|
||||
<Stack
|
||||
direction={isSmall ? "column" : "row"}
|
||||
alignItems={isSmall ? "flex-start" : "center"}
|
||||
flexWrap="wrap"
|
||||
gap={theme.spacing(SPACING.XL)}
|
||||
>
|
||||
<Typography color={theme.palette.text.secondary}>
|
||||
{t("pages.uptime.filters.activeTags")}
|
||||
</Typography>
|
||||
{selectedTags.map((tagId) => {
|
||||
const tag = tags?.find((t) => t.id === tagId);
|
||||
if (!tag) return null;
|
||||
return (
|
||||
<ColoredLabel
|
||||
key={tag.id}
|
||||
text={tag.name}
|
||||
color={tag.color}
|
||||
/>
|
||||
);
|
||||
})}
|
||||
</Stack>
|
||||
)}
|
||||
|
||||
{!isLoading && (
|
||||
<BulkActionsBar
|
||||
selectedCount={selectedRows.length}
|
||||
onCancel={handleCancelSelection}
|
||||
>
|
||||
<Button
|
||||
size="small"
|
||||
startIcon={<Play size={16} />}
|
||||
onClick={handleBulkResume}
|
||||
>
|
||||
{t("common.buttons.resume")}
|
||||
</Button>
|
||||
<Button
|
||||
size="small"
|
||||
startIcon={<Pause size={16} />}
|
||||
onClick={handleBulkPause}
|
||||
>
|
||||
{t("common.buttons.pause")}
|
||||
</Button>
|
||||
</BulkActionsBar>
|
||||
)}
|
||||
|
||||
<InfraMonitorsTable
|
||||
monitors={monitorsWithChecksData?.monitors || []}
|
||||
tags={tags ?? []}
|
||||
refetch={refetch}
|
||||
setSelectedMonitor={setSelectedMonitor}
|
||||
sortField={sortField}
|
||||
@@ -180,6 +257,8 @@ const InfrastructureMonitors = () => {
|
||||
);
|
||||
setPage(0);
|
||||
}}
|
||||
selectedRows={selectedRows}
|
||||
onSelectionChange={setSelectedRows}
|
||||
/>
|
||||
<Dialog
|
||||
open={isDialogOpen}
|
||||
|
||||
@@ -1,12 +1,15 @@
|
||||
import Stack from "@mui/material/Stack";
|
||||
import Typography from "@mui/material/Typography";
|
||||
import { Stats } from "@/Pages/Logs/components/Stats";
|
||||
import { MongoStats } from "@/Pages/Logs/components/MongoStats";
|
||||
import { MongoCollectionStats } from "./components/MongoCollectionStats";
|
||||
import { StatGauges } from "@/Pages/Logs/components/StatGauges";
|
||||
|
||||
import { useTheme } from "@mui/material";
|
||||
import { useTranslation } from "react-i18next";
|
||||
import { useGet } from "@/Hooks/UseApi";
|
||||
import type { Diagnostics } from "@/Types/Diagnostics";
|
||||
import { LAYOUT, SPACING } from "@/Utils/Theme/constants";
|
||||
|
||||
export const TabDiagnostics = () => {
|
||||
const theme = useTheme();
|
||||
@@ -19,12 +22,12 @@ export const TabDiagnostics = () => {
|
||||
} = useGet<Diagnostics>("/diagnostic/system", {}, { refreshInterval: 5000 });
|
||||
|
||||
return (
|
||||
<Stack gap={theme.spacing(12)}>
|
||||
<Stack gap={theme.spacing(4)}>
|
||||
<Stack gap={theme.spacing(1)}>
|
||||
<Stack gap={theme.spacing(LAYOUT.XL)}>
|
||||
<Stack gap={theme.spacing(LAYOUT.XS)}>
|
||||
<Stack gap={theme.spacing(SPACING.SM)}>
|
||||
<Typography
|
||||
variant="eyebrow"
|
||||
color="text.secondary"
|
||||
color={theme.palette.text.secondary}
|
||||
>
|
||||
{t("pages.logs.diagnostics.sections.runtimeStats.title")}
|
||||
</Typography>
|
||||
@@ -34,11 +37,11 @@ export const TabDiagnostics = () => {
|
||||
</Stack>
|
||||
<Stats diagnostics={diagnostics} />
|
||||
</Stack>
|
||||
<Stack gap={theme.spacing(4)}>
|
||||
<Stack gap={theme.spacing(1)}>
|
||||
<Stack gap={theme.spacing(LAYOUT.XS)}>
|
||||
<Stack gap={theme.spacing(SPACING.SM)}>
|
||||
<Typography
|
||||
variant="eyebrow"
|
||||
color="text.secondary"
|
||||
color={theme.palette.text.secondary}
|
||||
>
|
||||
{t("pages.logs.diagnostics.sections.memoryCpu.title")}
|
||||
</Typography>
|
||||
@@ -48,6 +51,30 @@ export const TabDiagnostics = () => {
|
||||
</Stack>
|
||||
<StatGauges diagnostics={diagnostics} />
|
||||
</Stack>
|
||||
<Stack gap={theme.spacing(LAYOUT.XS)}>
|
||||
<Typography
|
||||
variant="eyebrow"
|
||||
color={theme.palette.text.secondary}
|
||||
>
|
||||
{t("pages.logs.diagnostics.sections.mongoDBStats.title")}
|
||||
</Typography>
|
||||
<Typography color={theme.palette.text.secondary}>
|
||||
{t("pages.logs.diagnostics.sections.mongoDBStats.description")}
|
||||
</Typography>
|
||||
<MongoStats diagnostics={diagnostics} />
|
||||
</Stack>
|
||||
<Stack gap={theme.spacing(LAYOUT.XS)}>
|
||||
<Typography
|
||||
variant="eyebrow"
|
||||
color={theme.palette.text.secondary}
|
||||
>
|
||||
{t("pages.logs.diagnostics.sections.mongoDBCollectionStats.title")}
|
||||
</Typography>
|
||||
<Typography color={theme.palette.text.secondary}>
|
||||
{t("pages.logs.diagnostics.sections.mongoDBCollectionStats.description")}
|
||||
</Typography>
|
||||
<MongoCollectionStats diagnostics={diagnostics} />
|
||||
</Stack>
|
||||
</Stack>
|
||||
);
|
||||
};
|
||||
@@ -10,6 +10,7 @@ import type { QueueData } from "@/Types/Queue";
|
||||
import { Metrics } from "@/Pages/Logs/components/Metrics";
|
||||
import { Button } from "@/Components/inputs";
|
||||
import { EmptyState } from "@/Components/design-elements";
|
||||
import { SPACING } from "@/Utils/Theme/constants";
|
||||
|
||||
export const TabQueue = () => {
|
||||
const theme = useTheme();
|
||||
@@ -19,7 +20,7 @@ export const TabQueue = () => {
|
||||
isLoading,
|
||||
// error,
|
||||
refetch,
|
||||
} = useGet<QueueData>("/queue/all-metrics", {}, { refreshInterval: 5000 });
|
||||
} = useGet<QueueData>("/queue/all-metrics", {}, { refreshInterval: 1000 });
|
||||
|
||||
const { post, loading: isFlushing } = usePost();
|
||||
|
||||
@@ -49,32 +50,22 @@ export const TabQueue = () => {
|
||||
<Stack gap={theme.spacing(1)}>
|
||||
<Typography
|
||||
variant="eyebrow"
|
||||
color="text.secondary"
|
||||
color={theme.palette.text.secondary}
|
||||
>
|
||||
{t("pages.logs.jobQueue")}
|
||||
</Typography>
|
||||
<Typography
|
||||
sx={{
|
||||
fontSize: 13,
|
||||
color: theme.palette.text.secondary,
|
||||
}}
|
||||
>
|
||||
<Typography color={theme.palette.text.secondary}>
|
||||
<Trans
|
||||
i18nKey="pages.logs.jobQueueExplainer"
|
||||
components={{
|
||||
highlight: (
|
||||
<Box
|
||||
component="span"
|
||||
sx={{
|
||||
backgroundColor:
|
||||
theme.palette.mode === "dark"
|
||||
? "rgba(19, 113, 91, 0.18)"
|
||||
: "#ECF7F2",
|
||||
color: theme.palette.text.primary,
|
||||
px: 1,
|
||||
py: 0.25,
|
||||
borderRadius: 0.5,
|
||||
}}
|
||||
bgcolor={theme.palette.rowStatus.running}
|
||||
color={theme.palette.text.primary}
|
||||
px={SPACING.SM}
|
||||
py={SPACING.XXS}
|
||||
borderRadius={theme.shape.borderRadius}
|
||||
/>
|
||||
),
|
||||
}}
|
||||
@@ -87,16 +78,11 @@ export const TabQueue = () => {
|
||||
<Stack gap={theme.spacing(1)}>
|
||||
<Typography
|
||||
variant="eyebrow"
|
||||
color="text.secondary"
|
||||
color={theme.palette.text.secondary}
|
||||
>
|
||||
{t("pages.logs.failedJobs")}
|
||||
</Typography>
|
||||
<Typography
|
||||
sx={{
|
||||
fontSize: 13,
|
||||
color: theme.palette.text.secondary,
|
||||
}}
|
||||
>
|
||||
<Typography color={theme.palette.text.secondary}>
|
||||
{t("pages.logs.failedJobsExplainer")}
|
||||
</Typography>
|
||||
</Stack>
|
||||
|
||||
@@ -0,0 +1,104 @@
|
||||
import Box from "@mui/material/Box";
|
||||
import { StatBox, Gauge, Tooltip } from "@/Components/design-elements";
|
||||
import Stack from "@mui/material/Stack";
|
||||
import Typography from "@mui/material/Typography";
|
||||
|
||||
import { useTranslation } from "react-i18next";
|
||||
import prettyBytes from "pretty-bytes";
|
||||
import { useTheme } from "@mui/material";
|
||||
import type { Diagnostics } from "@/Types/Diagnostics";
|
||||
import { LAYOUT } from "@/Utils/Theme/constants";
|
||||
|
||||
interface MongoStatsProps {
|
||||
diagnostics: Diagnostics | null;
|
||||
}
|
||||
|
||||
export const MongoCollectionStats = ({ diagnostics }: MongoStatsProps) => {
|
||||
const theme = useTheme();
|
||||
const { t } = useTranslation();
|
||||
|
||||
const mongoStats = diagnostics?.mongoStats;
|
||||
if (!mongoStats) {
|
||||
return null;
|
||||
}
|
||||
|
||||
return (
|
||||
<Box
|
||||
display={"grid"}
|
||||
gap={theme.spacing(LAYOUT.MD)}
|
||||
sx={{
|
||||
gridTemplateColumns: { xs: "1fr", md: "repeat(5, 1fr)" },
|
||||
"& > *": { width: "100% !important" },
|
||||
}}
|
||||
>
|
||||
{mongoStats.collections.map((colStat) => (
|
||||
<StatBox
|
||||
key={colStat.name}
|
||||
title={colStat.name}
|
||||
subtitle={""}
|
||||
>
|
||||
<Stack
|
||||
direction={"row"}
|
||||
alignItems={"center"}
|
||||
justifyContent={"space-between"}
|
||||
>
|
||||
<Stack>
|
||||
{/* <Typography variant="body2">{`Documents: ${colStat.documentCount}`}</Typography> */}
|
||||
<Typography variant="body2">
|
||||
{t("pages.logs.diagnostics.mongoDBCollectionStats.documents", {
|
||||
count: colStat.documentCount,
|
||||
})}
|
||||
</Typography>
|
||||
{colStat.bucketCount !== undefined && (
|
||||
<Typography variant="body2">
|
||||
{t("pages.logs.diagnostics.mongoDBCollectionStats.bucketCount", {
|
||||
count: colStat.bucketCount,
|
||||
})}
|
||||
</Typography>
|
||||
)}
|
||||
<Typography variant="body2">
|
||||
{t("pages.logs.diagnostics.mongoDBCollectionStats.storageSize", {
|
||||
size: prettyBytes(colStat.storageSize),
|
||||
})}
|
||||
</Typography>
|
||||
<Typography variant="body2">
|
||||
{t("pages.logs.diagnostics.mongoDBCollectionStats.indexSize", {
|
||||
size: prettyBytes(colStat.totalIndexSize),
|
||||
})}
|
||||
</Typography>
|
||||
<Typography variant="body2">
|
||||
{t("pages.logs.diagnostics.mongoDBCollectionStats.totalSize", {
|
||||
size: prettyBytes(colStat.totalSize),
|
||||
})}
|
||||
</Typography>
|
||||
</Stack>
|
||||
<Stack alignItems={"center"}>
|
||||
<Tooltip
|
||||
title={t("pages.logs.diagnostics.mongoDBCollectionStats.dbUsageTooltip", {
|
||||
percentage: ((colStat.totalSize / mongoStats.totalSize) * 100).toFixed(
|
||||
2
|
||||
),
|
||||
})}
|
||||
placement="top"
|
||||
slotProps={{
|
||||
popper: {
|
||||
modifiers: [
|
||||
{
|
||||
name: "offset",
|
||||
options: {
|
||||
offset: [0, -10],
|
||||
},
|
||||
},
|
||||
],
|
||||
},
|
||||
}}
|
||||
>
|
||||
<Gauge progress={(colStat.totalSize / mongoStats.totalSize) * 100} />
|
||||
</Tooltip>
|
||||
</Stack>
|
||||
</Stack>
|
||||
</StatBox>
|
||||
))}
|
||||
</Box>
|
||||
);
|
||||
};
|
||||
@@ -0,0 +1,54 @@
|
||||
import Box from "@mui/material/Box";
|
||||
import { StatBox } from "@/Components/design-elements";
|
||||
|
||||
import { useTranslation } from "react-i18next";
|
||||
import prettyBytes from "pretty-bytes";
|
||||
import { useTheme } from "@mui/material";
|
||||
import type { Diagnostics } from "@/Types/Diagnostics";
|
||||
import { LAYOUT } from "@/Utils/Theme/constants";
|
||||
|
||||
interface MongoStatsProps {
|
||||
diagnostics: Diagnostics | null;
|
||||
}
|
||||
|
||||
export const MongoStats = ({ diagnostics }: MongoStatsProps) => {
|
||||
const theme = useTheme();
|
||||
const { t } = useTranslation();
|
||||
|
||||
const mongoStats = diagnostics?.mongoStats;
|
||||
if (!mongoStats) {
|
||||
return null;
|
||||
}
|
||||
|
||||
return (
|
||||
<Box
|
||||
display={"grid"}
|
||||
gap={theme.spacing(LAYOUT.MD)}
|
||||
sx={{
|
||||
gridTemplateColumns: { xs: "1fr", md: "repeat(5, 1fr)" },
|
||||
"& > *": { width: "100% !important" },
|
||||
}}
|
||||
>
|
||||
<StatBox
|
||||
title={t("pages.logs.diagnostics.mongoDBStats.readyState")}
|
||||
subtitle={mongoStats.readyState.toString()}
|
||||
/>
|
||||
<StatBox
|
||||
title={t("pages.logs.diagnostics.mongoDBStats.host")}
|
||||
subtitle={mongoStats.host}
|
||||
/>
|
||||
<StatBox
|
||||
title={t("pages.logs.diagnostics.mongoDBStats.port")}
|
||||
subtitle={mongoStats.port.toString()}
|
||||
/>
|
||||
<StatBox
|
||||
title={t("pages.logs.diagnostics.mongoDBStats.dbName")}
|
||||
subtitle={mongoStats.dbName}
|
||||
/>
|
||||
<StatBox
|
||||
title={t("pages.logs.diagnostics.mongoDBStats.storageSize")}
|
||||
subtitle={prettyBytes(mongoStats.totalSize)}
|
||||
/>
|
||||
</Box>
|
||||
);
|
||||
};
|
||||
@@ -30,6 +30,22 @@ export const TableJobs = ({ jobs }: TableJobsProps) => {
|
||||
};
|
||||
|
||||
const headers: Header<QueueJobWithId>[] = [
|
||||
{
|
||||
id: "state",
|
||||
content: t("pages.logs.table.headers.state"),
|
||||
render: (row) => {
|
||||
if (row.lockedAt) {
|
||||
return t("common.labels.running");
|
||||
}
|
||||
if (row.monitorActive === true) {
|
||||
return t("common.labels.active");
|
||||
}
|
||||
if (row.monitorActive === false) {
|
||||
return t("common.labels.paused");
|
||||
}
|
||||
return t("common.labels.idle");
|
||||
},
|
||||
},
|
||||
{
|
||||
id: "id",
|
||||
content: t("common.table.headers.monitorId"),
|
||||
@@ -47,7 +63,10 @@ export const TableJobs = ({ jobs }: TableJobsProps) => {
|
||||
id: "url",
|
||||
content: t("common.table.headers.url"),
|
||||
render: (row) => (
|
||||
<Typography title={row.monitorUrl ?? ""} sx={cellSx}>
|
||||
<Typography
|
||||
title={row.monitorUrl ?? ""}
|
||||
sx={cellSx}
|
||||
>
|
||||
{row.monitorUrl}
|
||||
</Typography>
|
||||
),
|
||||
@@ -60,9 +79,15 @@ export const TableJobs = ({ jobs }: TableJobsProps) => {
|
||||
{
|
||||
id: "interval",
|
||||
content: t("common.table.headers.interval"),
|
||||
render: (row) => (
|
||||
<Typography sx={cellSx}>{prettyMilliseconds(row.monitorInterval ?? 0)}</Typography>
|
||||
),
|
||||
render: (row) => {
|
||||
let interval;
|
||||
if (row.monitorId.toString().includes("geo")) {
|
||||
interval = row.monitorGeoInterval ?? 0;
|
||||
} else {
|
||||
interval = row.repeat ?? 0;
|
||||
}
|
||||
return <Typography sx={cellSx}>{prettyMilliseconds(interval)}</Typography>;
|
||||
},
|
||||
},
|
||||
{
|
||||
id: "lastRun",
|
||||
@@ -70,7 +95,10 @@ export const TableJobs = ({ jobs }: TableJobsProps) => {
|
||||
render: (row) => {
|
||||
const v = formatTimestamp(row.lastRunAt) ?? "-";
|
||||
return (
|
||||
<Typography title={v} sx={cellSx}>
|
||||
<Typography
|
||||
title={v}
|
||||
sx={cellSx}
|
||||
>
|
||||
{v}
|
||||
</Typography>
|
||||
);
|
||||
@@ -90,7 +118,10 @@ export const TableJobs = ({ jobs }: TableJobsProps) => {
|
||||
render: (row) => {
|
||||
const v = formatTimestamp(row.lockedAt) ?? "-";
|
||||
return (
|
||||
<Typography title={v} sx={cellSx}>
|
||||
<Typography
|
||||
title={v}
|
||||
sx={cellSx}
|
||||
>
|
||||
{v}
|
||||
</Typography>
|
||||
);
|
||||
@@ -98,16 +129,16 @@ export const TableJobs = ({ jobs }: TableJobsProps) => {
|
||||
},
|
||||
];
|
||||
|
||||
const isDark = theme.palette.mode === "dark";
|
||||
const runningBg = isDark ? "rgba(19, 113, 91, 0.18)" : "#ECF7F2";
|
||||
|
||||
return (
|
||||
<Table
|
||||
headers={headers}
|
||||
data={jobsWithId}
|
||||
getRowSx={(row) => ({
|
||||
...(row.lockedAt && {
|
||||
"& td": { backgroundColor: runningBg },
|
||||
"& td": { backgroundColor: theme.palette.rowStatus.running },
|
||||
}),
|
||||
...(row.monitorActive === false && {
|
||||
"& td": { backgroundColor: theme.palette.rowStatus.paused },
|
||||
}),
|
||||
})}
|
||||
/>
|
||||
|
||||
@@ -8,7 +8,7 @@ import { useTranslation } from "react-i18next";
|
||||
|
||||
const LogsPage = () => {
|
||||
const { t } = useTranslation();
|
||||
const [activeTab, setActiveTab] = useState<number>(1);
|
||||
const [activeTab, setActiveTab] = useState<number>(0);
|
||||
return (
|
||||
<BasePage headerKey="logs">
|
||||
<Tabs
|
||||
|
||||
@@ -22,6 +22,7 @@ import type { MaintenanceWindowFormData } from "@/Validation/maintenanceWindow";
|
||||
import { repeatOptions, durationUnitOptions } from "@/Validation/maintenanceWindow";
|
||||
import { useMaintenanceWindowForm } from "@/Hooks/useMaintenanceWindowForm";
|
||||
import { useGet, usePost, usePatch } from "@/Hooks/UseApi";
|
||||
import { mutate } from "swr";
|
||||
import { useParams, useNavigate } from "react-router-dom";
|
||||
import type { Monitor } from "@/Types/Monitor";
|
||||
import { useForm, Controller } from "react-hook-form";
|
||||
@@ -85,10 +86,6 @@ const CreateMaintenanceWindowPage = () => {
|
||||
repeat,
|
||||
};
|
||||
|
||||
if (repeat === 0) {
|
||||
payload.expiry = endDateTime.toISOString();
|
||||
}
|
||||
|
||||
return payload;
|
||||
};
|
||||
|
||||
@@ -103,6 +100,9 @@ const CreateMaintenanceWindowPage = () => {
|
||||
}
|
||||
|
||||
if (result?.success) {
|
||||
await mutate(
|
||||
(key) => typeof key === "string" && key.startsWith("/maintenance-window")
|
||||
);
|
||||
navigate("/maintenance");
|
||||
}
|
||||
};
|
||||
|
||||
@@ -1,7 +1,14 @@
|
||||
import Stack from "@mui/material/Stack";
|
||||
import Box from "@mui/material/Box";
|
||||
import Typography from "@mui/material/Typography";
|
||||
import { Table, Pagination, StatusLabel } from "@/Components/design-elements";
|
||||
import {
|
||||
Table,
|
||||
Pagination,
|
||||
StatusLabel,
|
||||
StrategyBadge,
|
||||
ColoredLabel,
|
||||
} from "@/Components/design-elements";
|
||||
import { LAYOUT, SPACING } from "@/Utils/Theme/constants";
|
||||
import { HistogramPageSpeed } from "@/Components/monitors";
|
||||
import { ArrowDown, ArrowUp } from "lucide-react";
|
||||
import type { Header } from "@/Components/design-elements/Table";
|
||||
@@ -14,10 +21,12 @@ import { useNavigate } from "react-router-dom";
|
||||
import { usePatch } from "@/Hooks/UseApi";
|
||||
|
||||
import type { Monitor, MonitorWithChecks } from "@/Types/Monitor";
|
||||
import type { Tag } from "@/Types/Tag";
|
||||
import type { ActionMenuItem } from "@/Components/actions-menu";
|
||||
|
||||
export const PageSpeedMonitorsTable = ({
|
||||
monitors,
|
||||
tags,
|
||||
refetch,
|
||||
setSelectedMonitor,
|
||||
sortField,
|
||||
@@ -31,6 +40,7 @@ export const PageSpeedMonitorsTable = ({
|
||||
setRowsPerPage,
|
||||
}: {
|
||||
monitors: MonitorWithChecks[];
|
||||
tags: Tag[];
|
||||
refetch: Function;
|
||||
setSelectedMonitor: Function;
|
||||
sortField: string;
|
||||
@@ -179,7 +189,19 @@ export const PageSpeedMonitorsTable = ({
|
||||
</Stack>
|
||||
),
|
||||
render: (row) => {
|
||||
return row.name;
|
||||
return (
|
||||
<Stack
|
||||
direction="row"
|
||||
alignItems="center"
|
||||
gap={LAYOUT.XS}
|
||||
>
|
||||
<Typography>{row.name}</Typography>
|
||||
<StrategyBadge
|
||||
strategy={row.strategy}
|
||||
variant="caption"
|
||||
/>
|
||||
</Stack>
|
||||
);
|
||||
},
|
||||
},
|
||||
{
|
||||
@@ -215,6 +237,32 @@ export const PageSpeedMonitorsTable = ({
|
||||
);
|
||||
},
|
||||
},
|
||||
{
|
||||
id: "tags",
|
||||
content: t("common.table.headers.tags"),
|
||||
render: (row) => {
|
||||
if (row.tags.length === 0) return "-";
|
||||
return (
|
||||
<Stack
|
||||
justifyContent={"center"}
|
||||
direction={isSmall ? "column" : "row"}
|
||||
gap={theme.spacing(SPACING.LG)}
|
||||
>
|
||||
{row.tags.map((tagId) => {
|
||||
const fullTag = tags.find((tag) => tag.id === tagId);
|
||||
if (!fullTag) return null;
|
||||
return (
|
||||
<ColoredLabel
|
||||
key={fullTag.id}
|
||||
text={fullTag.name}
|
||||
color={fullTag.color}
|
||||
/>
|
||||
);
|
||||
})}
|
||||
</Stack>
|
||||
);
|
||||
},
|
||||
},
|
||||
|
||||
{
|
||||
id: "actions",
|
||||
|
||||
@@ -1,22 +1,32 @@
|
||||
import {
|
||||
MonitorBasePageWithStates,
|
||||
PageSpeedKeyPriorityFallback,
|
||||
ColoredLabel,
|
||||
} from "@/Components/design-elements";
|
||||
import { Dialog } from "@/Components/inputs";
|
||||
import { Dialog, TextField } from "@/Components/inputs";
|
||||
import { HeaderCreate } from "@/Components/common";
|
||||
import { PageSpeedMonitorsTable } from "@/Pages/PageSpeed/Monitors/Components/PageSpeedMonitorsTable";
|
||||
import type { Monitor } from "@/Types/Monitor";
|
||||
import type { Tag } from "@/Types/Tag";
|
||||
import Stack from "@mui/material/Stack";
|
||||
import Typography from "@mui/material/Typography";
|
||||
import useMediaQuery from "@mui/material/useMediaQuery";
|
||||
import { useTheme } from "@mui/material";
|
||||
import { SPACING } from "@/Utils/Theme/constants";
|
||||
|
||||
import { useTranslation } from "react-i18next";
|
||||
import { useMemo, useState } from "react";
|
||||
import { useCallback, useMemo, useState } from "react";
|
||||
import { useIsAdmin } from "@/Hooks/useIsAdmin";
|
||||
import { useGet, useDelete } from "@/Hooks/UseApi";
|
||||
import useDebounce from "@/Hooks/useDebounce";
|
||||
import type { MonitorsWithChecksResponse } from "@/Types/Monitor";
|
||||
import type { AppSettingsResponse } from "@/Types/Settings";
|
||||
import { HeaderMonitorsSummary } from "@/Components/monitors";
|
||||
import { ControlsFilter, HeaderMonitorsSummary } from "@/Components/monitors";
|
||||
|
||||
const PageSpeedMonitorsPage = () => {
|
||||
const { t } = useTranslation();
|
||||
const theme = useTheme();
|
||||
const isSmall = useMediaQuery(theme.breakpoints.down("md"));
|
||||
const isAdmin = useIsAdmin();
|
||||
const { deleteFn, loading: isDeleting } = useDelete();
|
||||
|
||||
@@ -33,17 +43,50 @@ const PageSpeedMonitorsPage = () => {
|
||||
const [sortOrder, setSortOrder] = useState<"asc" | "desc">("asc");
|
||||
const [page, setPage] = useState(0);
|
||||
const [rowsPerPage, setRowsPerPage] = useState(10);
|
||||
const [selectedTags, setSelectedTags] = useState<string[]>([]);
|
||||
const [selectedStatus, setSelectedStatus] = useState<string>("");
|
||||
const [selectedState, setSelectedState] = useState<string>("");
|
||||
const [search, setSearch] = useState<string>("");
|
||||
|
||||
const debouncedSearch = useDebounce<string>(search, 300);
|
||||
|
||||
// Status: pass "up"/"down" directly to the API
|
||||
// State: "active" -> true, "paused" -> false
|
||||
const toFilterStatus = useMemo(() => {
|
||||
if (selectedStatus === "up") return "up";
|
||||
if (selectedStatus === "down") return "down";
|
||||
return undefined;
|
||||
}, [selectedStatus]);
|
||||
|
||||
const toFilterActive = useMemo(() => {
|
||||
if (selectedState === "active") return "true";
|
||||
if (selectedState === "paused") return "false";
|
||||
return undefined;
|
||||
}, [selectedState]);
|
||||
|
||||
// Priority: status > isActive > search > sort
|
||||
const filterLookup = new Map<string | undefined, string>([
|
||||
[toFilterStatus, "status"],
|
||||
[toFilterActive, "isActive"],
|
||||
]);
|
||||
const activeFilter = [...filterLookup].find(([key]) => key !== undefined);
|
||||
const field = activeFilter?.[1] || (debouncedSearch ? "name" : sortField || undefined);
|
||||
const filter = activeFilter?.[0] || debouncedSearch;
|
||||
|
||||
const { data: tags } = useGet<Tag[]>("/tags/team");
|
||||
|
||||
const monitorsWithChecksUrl = useMemo(() => {
|
||||
const params = new URLSearchParams();
|
||||
params.append("type", "pagespeed");
|
||||
selectedTags.forEach((tagId) => params.append("tags", tagId));
|
||||
params.append("limit", "25");
|
||||
if (page !== undefined) params.append("page", String(page));
|
||||
if (rowsPerPage) params.append("rowsPerPage", String(rowsPerPage));
|
||||
if (sortField) params.append("field", sortField);
|
||||
if (filter) params.append("filter", filter);
|
||||
if (field) params.append("field", field);
|
||||
if (sortOrder) params.append("order", sortOrder);
|
||||
return `/monitors/team/with-checks?${params.toString()}`;
|
||||
}, [page, rowsPerPage, sortField, sortOrder]);
|
||||
}, [page, rowsPerPage, sortOrder, selectedTags, filter, field]);
|
||||
|
||||
const {
|
||||
data: monitorsData,
|
||||
@@ -75,12 +118,28 @@ const PageSpeedMonitorsPage = () => {
|
||||
setSelectedMonitor(null);
|
||||
};
|
||||
|
||||
const handleClearFilters = useCallback(() => {
|
||||
setSelectedStatus("");
|
||||
setSelectedState("");
|
||||
setSelectedTags([]);
|
||||
setSearch("");
|
||||
}, []);
|
||||
|
||||
const hasActiveFilters = Boolean(
|
||||
selectedStatus || selectedState || selectedTags.length > 0 || search
|
||||
);
|
||||
|
||||
const effectiveTotalCount =
|
||||
hasActiveFilters && (summary?.totalMonitors ?? 0) === 0
|
||||
? 1
|
||||
: (summary?.totalMonitors ?? 0);
|
||||
|
||||
return (
|
||||
<MonitorBasePageWithStates
|
||||
headerKey="pageSpeed"
|
||||
loading={isLoading}
|
||||
error={monitorsError || settingsError}
|
||||
totalCount={summary?.totalMonitors ?? 0}
|
||||
totalCount={effectiveTotalCount}
|
||||
page="pageSpeed"
|
||||
actionLink="/pagespeed/create"
|
||||
priorityFallback={showApiKeyWarning ? <PageSpeedKeyPriorityFallback /> : undefined}
|
||||
@@ -91,8 +150,59 @@ const PageSpeedMonitorsPage = () => {
|
||||
isAdmin={isAdmin}
|
||||
/>
|
||||
<HeaderMonitorsSummary summary={summary} />
|
||||
|
||||
<Stack
|
||||
direction={isSmall ? "column" : "row"}
|
||||
justifyContent={isSmall ? "flex-start" : "space-between"}
|
||||
gap={theme.spacing(4)}
|
||||
>
|
||||
<ControlsFilter
|
||||
showTypes={false}
|
||||
selectedStatus={selectedStatus}
|
||||
setSelectedStatus={setSelectedStatus}
|
||||
selectedState={selectedState}
|
||||
setSelectedState={setSelectedState}
|
||||
tagOptions={tags ?? []}
|
||||
selectedTags={selectedTags}
|
||||
setSelectedTags={setSelectedTags}
|
||||
onClearFilters={handleClearFilters}
|
||||
/>
|
||||
<TextField
|
||||
placeholder={t("pages.uptime.filters.search.placeholder")}
|
||||
value={search}
|
||||
onChange={(event) => {
|
||||
setSearch(event.target.value);
|
||||
}}
|
||||
/>
|
||||
</Stack>
|
||||
|
||||
{selectedTags.length > 0 && (
|
||||
<Stack
|
||||
direction={isSmall ? "column" : "row"}
|
||||
alignItems={isSmall ? "flex-start" : "center"}
|
||||
flexWrap="wrap"
|
||||
gap={theme.spacing(SPACING.XL)}
|
||||
>
|
||||
<Typography color={theme.palette.text.secondary}>
|
||||
{t("pages.uptime.filters.activeTags")}
|
||||
</Typography>
|
||||
{selectedTags.map((tagId) => {
|
||||
const tag = tags?.find((t) => t.id === tagId);
|
||||
if (!tag) return null;
|
||||
return (
|
||||
<ColoredLabel
|
||||
key={tag.id}
|
||||
text={tag.name}
|
||||
color={tag.color}
|
||||
/>
|
||||
);
|
||||
})}
|
||||
</Stack>
|
||||
)}
|
||||
|
||||
<PageSpeedMonitorsTable
|
||||
monitors={monitors || []}
|
||||
tags={tags ?? []}
|
||||
refetch={refetch}
|
||||
setSelectedMonitor={setSelectedMonitor}
|
||||
sortField={sortField}
|
||||
|
||||
@@ -3,6 +3,7 @@ import Typography from "@mui/material/Typography";
|
||||
import { useTheme } from "@mui/material/styles";
|
||||
import { HeatmapResponseTime, HistogramResponseTime } from "@/Components/common";
|
||||
import type { CheckSnapshot } from "@/Types/Check";
|
||||
import { MAX_RECENT_CHECKS } from "@/Types/Monitor";
|
||||
|
||||
interface DummyChartProps {
|
||||
chartType: string;
|
||||
@@ -10,7 +11,7 @@ interface DummyChartProps {
|
||||
|
||||
const generateDummyChecks = (): CheckSnapshot[] => {
|
||||
const checks: CheckSnapshot[] = [];
|
||||
for (let i = 0; i < 25; i++) {
|
||||
for (let i = 0; i < MAX_RECENT_CHECKS; i++) {
|
||||
const isUp = Math.random() > 0.1;
|
||||
const responseTime = Math.floor(Math.random() * 80) + 20;
|
||||
checks.push({
|
||||
|
||||
@@ -32,6 +32,7 @@ import type { MonitorDisplayType, StatusPageResponse } from "@/Types/StatusPage"
|
||||
import { getMonitorTypeLabel } from "@/Types/StatusPage";
|
||||
import timezones from "@/Utils/timezones.json";
|
||||
import { useNavigate, useParams } from "react-router-dom";
|
||||
import { mutate } from "swr";
|
||||
import axios from "axios";
|
||||
import { HeaderConfigStatusControls } from "./Components/HeaderConfigStatusControls";
|
||||
import { ThemePicker } from "./Components/ThemePicker";
|
||||
@@ -49,6 +50,9 @@ interface TimezoneOption {
|
||||
name: string;
|
||||
}
|
||||
|
||||
const buildStatusPageKey = (slug: string | null | undefined) =>
|
||||
slug ? `/status-page/${slug}?type=uptime&type=infrastructure` : null;
|
||||
|
||||
const CreateStatusPage = () => {
|
||||
const theme = useTheme();
|
||||
const { t } = useTranslation();
|
||||
@@ -59,9 +63,7 @@ const CreateStatusPage = () => {
|
||||
|
||||
// Fetch existing status page data when configuring
|
||||
const { data: statusPageData, isLoading: isLoadingStatusPage } =
|
||||
useGet<StatusPageResponse>(
|
||||
isCreate ? null : `/status-page/${url}?type=uptime&type=infrastructure`
|
||||
);
|
||||
useGet<StatusPageResponse>(isCreate ? null : buildStatusPageKey(url));
|
||||
|
||||
const { data: monitorsResponse } = useGet<Monitor[]>(monitorsUrl);
|
||||
const monitors = monitorsResponse ?? [];
|
||||
@@ -181,6 +183,10 @@ const CreateStatusPage = () => {
|
||||
}
|
||||
|
||||
if (result) {
|
||||
await mutate(buildStatusPageKey(data.url));
|
||||
if (!isCreate && url !== data.url) {
|
||||
await mutate(buildStatusPageKey(url));
|
||||
}
|
||||
navigate(`/status/${data.url}`);
|
||||
}
|
||||
};
|
||||
|
||||
@@ -8,35 +8,56 @@ import { useTranslation } from "react-i18next";
|
||||
import { useIsAdmin } from "@/Hooks/useIsAdmin";
|
||||
import { useLocation, useParams } from "react-router-dom";
|
||||
import { useGet } from "@/Hooks/UseApi";
|
||||
import type { Monitor } from "@/Types/Monitor";
|
||||
import { resolveStatusPageTheme } from "@/Types/StatusPage";
|
||||
import {
|
||||
PUBLIC_STATUS_PAGE_PREFIX,
|
||||
type StatusPage,
|
||||
type StatusPageResponse,
|
||||
type StatusPageTheme,
|
||||
} from "@/Types/StatusPage";
|
||||
import { HeaderStatusPageControls } from "./Components/HeaderStatusPageControls";
|
||||
import { StatusPageThemeProvider } from "./themes/StatusPageThemeProvider";
|
||||
import { RefinedStatusPage } from "./themes/refined/RefinedStatusPage";
|
||||
import { ModernStatusPage } from "./themes/modern/ModernStatusPage";
|
||||
import { BoldStatusPage } from "./themes/bold/BoldStatusPage";
|
||||
import { EditorialStatusPage } from "./themes/editorial/EditorialStatusPage";
|
||||
import { BrowserFrame } from "./themes/BrowserFrame";
|
||||
import { HeaderStatusPageControls } from "@/Pages/StatusPage/Status/Components/HeaderStatusPageControls";
|
||||
import { StatusPageThemeProvider } from "@/Pages/StatusPage/Status/themes/StatusPageThemeProvider";
|
||||
import {
|
||||
BaseStatusPage,
|
||||
type ThemeConfig,
|
||||
} from "@/Pages/StatusPage/Status/themes/shared/BaseStatusPage";
|
||||
import { BrowserFrame } from "@/Pages/StatusPage/Status/themes/BrowserFrame";
|
||||
import { refinedStyles } from "@/Pages/StatusPage/Status/themes/refined/styles";
|
||||
import { RefinedHeader } from "@/Pages/StatusPage/Status/themes/refined/RefinedHeader";
|
||||
import { RefinedHero } from "@/Pages/StatusPage/Status/themes/refined/RefinedHero";
|
||||
import { modernStyles } from "@/Pages/StatusPage/Status/themes/modern/styles";
|
||||
import { ModernHeader } from "@/Pages/StatusPage/Status/themes/modern/ModernHeader";
|
||||
import { ModernHero } from "@/Pages/StatusPage/Status/themes/modern/ModernHero";
|
||||
import { boldStyles } from "@/Pages/StatusPage/Status/themes/bold/styles";
|
||||
import { BoldHeader } from "@/Pages/StatusPage/Status/themes/bold/BoldHeader";
|
||||
import { BoldHero } from "@/Pages/StatusPage/Status/themes/bold/BoldHero";
|
||||
import { editorialStyles } from "@/Pages/StatusPage/Status/themes/editorial/styles";
|
||||
import { EditorialHeader } from "@/Pages/StatusPage/Status/themes/editorial/EditorialHeader";
|
||||
import { EditorialHero } from "@/Pages/StatusPage/Status/themes/editorial/EditorialHero";
|
||||
|
||||
type ThemedRendererProps = {
|
||||
statusPage: StatusPage;
|
||||
monitors: (Monitor & { checks?: Monitor["recentChecks"] })[];
|
||||
};
|
||||
|
||||
const THEMED_RENDERERS: Record<
|
||||
StatusPageTheme,
|
||||
React.ComponentType<ThemedRendererProps>
|
||||
> = {
|
||||
refined: RefinedStatusPage,
|
||||
modern: ModernStatusPage,
|
||||
bold: BoldStatusPage,
|
||||
editorial: EditorialStatusPage,
|
||||
const THEME_CONFIGS: Record<StatusPageTheme, ThemeConfig<any>> = {
|
||||
refined: {
|
||||
createStyles: refinedStyles,
|
||||
HeaderSlot: RefinedHeader,
|
||||
HeroSlot: RefinedHero,
|
||||
},
|
||||
modern: {
|
||||
createStyles: modernStyles,
|
||||
HeaderSlot: ModernHeader,
|
||||
HeroSlot: ModernHero,
|
||||
overallStatusOptions: { iconSize: 20 },
|
||||
},
|
||||
bold: {
|
||||
createStyles: boldStyles,
|
||||
HeaderSlot: BoldHeader,
|
||||
HeroSlot: BoldHero,
|
||||
overallStatusOptions: { iconSize: 18 },
|
||||
},
|
||||
editorial: {
|
||||
createStyles: editorialStyles,
|
||||
HeaderSlot: EditorialHeader,
|
||||
HeroSlot: EditorialHero,
|
||||
overallStatusOptions: { allUpKey: "pages.statusPages.editorial.allUp" },
|
||||
},
|
||||
};
|
||||
|
||||
const StatusPageView = () => {
|
||||
@@ -90,11 +111,12 @@ const StatusPageView = () => {
|
||||
);
|
||||
}
|
||||
|
||||
const ThemedRenderer = THEMED_RENDERERS[resolveStatusPageTheme(statusPage.theme)];
|
||||
const themeConfig = THEME_CONFIGS[resolveStatusPageTheme(statusPage.theme)];
|
||||
const themedRenderer = (
|
||||
<ThemedRenderer
|
||||
<BaseStatusPage
|
||||
statusPage={statusPage}
|
||||
monitors={monitors}
|
||||
config={themeConfig}
|
||||
/>
|
||||
);
|
||||
|
||||
@@ -104,6 +126,7 @@ const StatusPageView = () => {
|
||||
<StatusPageThemeProvider
|
||||
theme={statusPage.theme}
|
||||
themeMode={statusPage.themeMode}
|
||||
timezone={statusPage.timezone}
|
||||
paintBody
|
||||
>
|
||||
{themedRenderer}
|
||||
@@ -127,6 +150,7 @@ const StatusPageView = () => {
|
||||
<StatusPageThemeProvider
|
||||
theme={statusPage.theme}
|
||||
themeMode={statusPage.themeMode}
|
||||
timezone={statusPage.timezone}
|
||||
transparent
|
||||
>
|
||||
<BrowserFrame url={publicUrl}>{themedRenderer}</BrowserFrame>
|
||||
|
||||
@@ -13,6 +13,7 @@ import {
|
||||
type StatusPageTheme,
|
||||
type StatusPageThemeMode,
|
||||
} from "@/Types/StatusPage";
|
||||
import { resolveTimezone } from "@/Utils/TimeUtils";
|
||||
import { themeTokens, type StatusPageThemeTokens } from "./tokens";
|
||||
|
||||
type ResolvedMode = "light" | "dark";
|
||||
@@ -21,6 +22,7 @@ interface StatusPageThemeContextValue {
|
||||
theme: StatusPageTheme;
|
||||
mode: ResolvedMode;
|
||||
tokens: StatusPageThemeTokens;
|
||||
timezone: string;
|
||||
}
|
||||
|
||||
const StatusPageThemeContext = createContext<StatusPageThemeContextValue | null>(null);
|
||||
@@ -33,6 +35,7 @@ const resolveSystemMode = (): ResolvedMode => {
|
||||
interface Props {
|
||||
theme?: StatusPageTheme;
|
||||
themeMode?: StatusPageThemeMode;
|
||||
timezone?: string;
|
||||
/**
|
||||
* When true, paint the document body with the theme background so it
|
||||
* covers beyond the provider's wrapper (useful on the public route
|
||||
@@ -54,12 +57,14 @@ interface Props {
|
||||
export const StatusPageThemeProvider = ({
|
||||
theme,
|
||||
themeMode,
|
||||
timezone,
|
||||
paintBody = false,
|
||||
transparent = false,
|
||||
children,
|
||||
}: Props) => {
|
||||
const resolvedTheme = resolveStatusPageTheme(theme);
|
||||
const resolvedThemeMode = resolveStatusPageThemeMode(themeMode);
|
||||
const resolvedTimezone = resolveTimezone(timezone);
|
||||
|
||||
const [systemMode, setSystemMode] = useState<ResolvedMode>(resolveSystemMode);
|
||||
|
||||
@@ -107,8 +112,13 @@ export const StatusPageThemeProvider = ({
|
||||
const tokens = themeTokens[resolvedTheme][resolvedMode];
|
||||
|
||||
const value = useMemo(
|
||||
() => ({ theme: resolvedTheme, mode: resolvedMode, tokens }),
|
||||
[resolvedTheme, resolvedMode, tokens]
|
||||
() => ({
|
||||
theme: resolvedTheme,
|
||||
mode: resolvedMode,
|
||||
tokens,
|
||||
timezone: resolvedTimezone,
|
||||
}),
|
||||
[resolvedTheme, resolvedMode, tokens, resolvedTimezone]
|
||||
);
|
||||
|
||||
return (
|
||||
@@ -136,6 +146,7 @@ export const useStatusPageTheme = (): StatusPageThemeContextValue => {
|
||||
theme: DEFAULT_STATUS_PAGE_THEME,
|
||||
mode: resolveSystemMode(),
|
||||
tokens: themeTokens[DEFAULT_STATUS_PAGE_THEME][resolveSystemMode()],
|
||||
timezone: resolveTimezone(),
|
||||
};
|
||||
}
|
||||
return ctx;
|
||||
|
||||
@@ -0,0 +1,20 @@
|
||||
import Box from "@mui/material/Box";
|
||||
import { monoFirstChar } from "@/Pages/StatusPage/Status/themes/shared/overallStatus";
|
||||
import type { SlotProps } from "@/Pages/StatusPage/Status/themes/shared/BaseStatusPage";
|
||||
import type { BoldStyles } from "@/Pages/StatusPage/Status/themes/bold/styles";
|
||||
|
||||
export const BoldHeader = ({ statusPage, logoSrc, styles }: SlotProps<BoldStyles>) => (
|
||||
<Box sx={styles.brand}>
|
||||
{logoSrc ? (
|
||||
<Box
|
||||
component="img"
|
||||
src={logoSrc}
|
||||
alt={statusPage.companyName}
|
||||
sx={styles.logoImg}
|
||||
/>
|
||||
) : (
|
||||
<Box sx={styles.logoConic}>{monoFirstChar(statusPage.companyName)}</Box>
|
||||
)}
|
||||
{statusPage.companyName}
|
||||
</Box>
|
||||
);
|
||||
@@ -0,0 +1,32 @@
|
||||
import Box from "@mui/material/Box";
|
||||
import { useTranslation } from "react-i18next";
|
||||
import type { SlotProps } from "@/Pages/StatusPage/Status/themes/shared/BaseStatusPage";
|
||||
import type { BoldStyles } from "@/Pages/StatusPage/Status/themes/bold/styles";
|
||||
|
||||
export const BoldHero = ({ overall, monitorCount, styles }: SlotProps<BoldStyles>) => {
|
||||
const { t } = useTranslation();
|
||||
return (
|
||||
<Box sx={styles.hero}>
|
||||
<Box
|
||||
component="h1"
|
||||
sx={styles.heroTitle}
|
||||
>
|
||||
<Box
|
||||
component="span"
|
||||
sx={styles.heroCheck(overall.tone)}
|
||||
>
|
||||
{overall.icon}
|
||||
</Box>
|
||||
{overall.message}
|
||||
</Box>
|
||||
<Box
|
||||
component="p"
|
||||
sx={styles.heroSub}
|
||||
>
|
||||
{t("pages.statusPages.statusBar.monitoringSummary", {
|
||||
count: monitorCount,
|
||||
})}
|
||||
</Box>
|
||||
</Box>
|
||||
);
|
||||
};
|
||||
@@ -1,207 +0,0 @@
|
||||
import { useMemo, useState } from "react";
|
||||
import Box from "@mui/material/Box";
|
||||
import Stack from "@mui/material/Stack";
|
||||
import { useTranslation } from "react-i18next";
|
||||
import type { Monitor } from "@/Types/Monitor";
|
||||
import type { StatusPage } from "@/Types/StatusPage";
|
||||
import { getMonitorTypeLabel } from "@/Types/StatusPage";
|
||||
import { ThemedHeatmap } from "../shared/ThemedHeatmap";
|
||||
import { ThemedHistogram } from "../shared/ThemedHistogram";
|
||||
import { ThemedInfrastructure } from "../shared/ThemedInfrastructure";
|
||||
import {
|
||||
monitorBadgeTone,
|
||||
monoFirstChar,
|
||||
resolveOverallStatus,
|
||||
statusBadgeKey,
|
||||
} from "../shared/overallStatus";
|
||||
import { useStatusPageTheme } from "../StatusPageThemeProvider";
|
||||
import { boldStyles } from "./styles";
|
||||
|
||||
type StatusPageMonitor = Monitor & { checks?: Monitor["recentChecks"] };
|
||||
|
||||
interface Props {
|
||||
statusPage: StatusPage;
|
||||
monitors: StatusPageMonitor[];
|
||||
}
|
||||
|
||||
export const BoldStatusPage = ({ statusPage, monitors }: Props) => {
|
||||
const { t } = useTranslation();
|
||||
const { tokens, mode } = useStatusPageTheme();
|
||||
const styles = useMemo(() => boldStyles(tokens, mode === "dark"), [tokens, mode]);
|
||||
const [chartMode, setChartMode] = useState<"heatmap" | "histogram">("heatmap");
|
||||
|
||||
const overall = resolveOverallStatus(monitors, t, { iconSize: 18 });
|
||||
const logoSrc = statusPage.logo?.data
|
||||
? `data:${statusPage.logo.contentType};base64,${statusPage.logo.data}`
|
||||
: null;
|
||||
|
||||
return (
|
||||
<Box sx={styles.page}>
|
||||
<Box
|
||||
component="header"
|
||||
sx={styles.top}
|
||||
>
|
||||
<Box sx={styles.brand}>
|
||||
{logoSrc ? (
|
||||
<Box
|
||||
component="img"
|
||||
src={logoSrc}
|
||||
alt={statusPage.companyName}
|
||||
sx={styles.logoImg}
|
||||
/>
|
||||
) : (
|
||||
<Box sx={styles.logoConic}>{monoFirstChar(statusPage.companyName)}</Box>
|
||||
)}
|
||||
{statusPage.companyName}
|
||||
</Box>
|
||||
</Box>
|
||||
|
||||
<Box sx={styles.hero}>
|
||||
<Box
|
||||
component="h1"
|
||||
sx={styles.heroTitle}
|
||||
>
|
||||
<Box
|
||||
component="span"
|
||||
sx={styles.heroCheck(overall.tone)}
|
||||
>
|
||||
{overall.icon}
|
||||
</Box>
|
||||
{overall.message}
|
||||
</Box>
|
||||
<Box
|
||||
component="p"
|
||||
sx={styles.heroSub}
|
||||
>
|
||||
{t("pages.statusPages.statusBar.monitoringSummary", {
|
||||
count: monitors.length,
|
||||
})}
|
||||
</Box>
|
||||
</Box>
|
||||
|
||||
{statusPage.showCharts && (
|
||||
<Box sx={styles.chartSwitchWrap}>
|
||||
<Box
|
||||
sx={styles.chartSwitch}
|
||||
role="radiogroup"
|
||||
>
|
||||
<Box
|
||||
component="button"
|
||||
type="button"
|
||||
role="radio"
|
||||
aria-checked={chartMode === "heatmap"}
|
||||
onClick={() => setChartMode("heatmap")}
|
||||
sx={styles.chartSwitchButton(chartMode === "heatmap")}
|
||||
>
|
||||
{t("pages.statusPages.monitorsList.chartTypeHeatmap")}
|
||||
</Box>
|
||||
<Box
|
||||
component="button"
|
||||
type="button"
|
||||
role="radio"
|
||||
aria-checked={chartMode === "histogram"}
|
||||
onClick={() => setChartMode("histogram")}
|
||||
sx={styles.chartSwitchButton(chartMode === "histogram")}
|
||||
>
|
||||
{t("pages.statusPages.monitorsList.chartTypeHistogram")}
|
||||
</Box>
|
||||
</Box>
|
||||
</Box>
|
||||
)}
|
||||
|
||||
<Stack
|
||||
component="ul"
|
||||
sx={styles.monitorList}
|
||||
>
|
||||
{monitors.map((monitor) => {
|
||||
const isHardware = monitor.type === "hardware";
|
||||
const showInfra = isHardware && statusPage.showInfrastructure !== false;
|
||||
const showChart = !isHardware && statusPage.showCharts !== false;
|
||||
const badgeTone = monitorBadgeTone(monitor.status);
|
||||
|
||||
return (
|
||||
<Box
|
||||
component="li"
|
||||
key={monitor.id}
|
||||
sx={styles.card}
|
||||
>
|
||||
<Box sx={styles.cardRow}>
|
||||
<Box sx={styles.cardLeft}>
|
||||
<Box sx={styles.monitorName}>{monitor.name}</Box>
|
||||
<Box sx={styles.monitorMeta}>
|
||||
<Box
|
||||
component="span"
|
||||
sx={isHardware ? styles.pillHardware : styles.pill}
|
||||
>
|
||||
{getMonitorTypeLabel(monitor.type, t)}
|
||||
</Box>
|
||||
{monitor.url && (
|
||||
<Box
|
||||
component="span"
|
||||
sx={styles.monitorUrl}
|
||||
title={monitor.url}
|
||||
>
|
||||
{monitor.url}
|
||||
</Box>
|
||||
)}
|
||||
</Box>
|
||||
</Box>
|
||||
<Box
|
||||
component="span"
|
||||
sx={styles.badge(badgeTone)}
|
||||
>
|
||||
{t(statusBadgeKey[monitor.status])}
|
||||
</Box>
|
||||
</Box>
|
||||
|
||||
{showInfra && (
|
||||
<ThemedInfrastructure
|
||||
monitor={monitor}
|
||||
sxApi={{
|
||||
containerSx: styles.infra,
|
||||
emptySx: styles.infraEmpty,
|
||||
gaugeSx: styles.gauge,
|
||||
gaugeLabelSx: styles.gaugeLabel,
|
||||
gaugeValueSx: styles.gaugeValue,
|
||||
gaugeBarSx: styles.gaugeBar,
|
||||
gaugeFillSx: styles.gaugeFill,
|
||||
gaugeSubSx: styles.gaugeSub,
|
||||
}}
|
||||
/>
|
||||
)}
|
||||
{showChart &&
|
||||
(chartMode === "heatmap" ? (
|
||||
<ThemedHeatmap
|
||||
checks={monitor.recentChecks ?? []}
|
||||
containerSx={styles.heatmap}
|
||||
cellSx={styles.heatmapCell}
|
||||
/>
|
||||
) : (
|
||||
<ThemedHistogram
|
||||
checks={monitor.recentChecks ?? []}
|
||||
containerSx={styles.histogram}
|
||||
barSx={styles.bar}
|
||||
statsSx={styles.chartStats}
|
||||
/>
|
||||
))}
|
||||
</Box>
|
||||
);
|
||||
})}
|
||||
</Stack>
|
||||
|
||||
<Box
|
||||
component="footer"
|
||||
sx={styles.footer}
|
||||
>
|
||||
{t("pages.statusPages.footer.poweredBy")}{" "}
|
||||
<a
|
||||
href="https://checkmate.so"
|
||||
target="_blank"
|
||||
rel="noopener noreferrer"
|
||||
>
|
||||
Checkmate
|
||||
</a>
|
||||
</Box>
|
||||
</Box>
|
||||
);
|
||||
};
|
||||
@@ -2,6 +2,7 @@ import type { SxProps, Theme } from "@mui/material/styles";
|
||||
import type { StatusPageThemeTokens } from "../tokens";
|
||||
import { type OverallTone, toneColor, toneSoft } from "../shared/overallStatus";
|
||||
import { BOLD_SANS_STACK, MONO_STACK } from "../shared/fontStacks";
|
||||
import { MAX_RECENT_CHECKS } from "@/Types/Monitor";
|
||||
|
||||
export type BoldHeatCell = "fast" | "med" | "slow" | "down" | "empty";
|
||||
export type BoldBarKind = "up" | "down" | "empty";
|
||||
@@ -297,7 +298,7 @@ export const boldStyles = (
|
||||
heatmap: {
|
||||
padding: "0 28px 22px",
|
||||
display: "grid",
|
||||
gridTemplateColumns: "repeat(25, 1fr)",
|
||||
gridTemplateColumns: `repeat(${MAX_RECENT_CHECKS}, 1fr)`,
|
||||
gap: "3px",
|
||||
height: 48,
|
||||
},
|
||||
@@ -313,7 +314,7 @@ export const boldStyles = (
|
||||
histogram: {
|
||||
padding: "0 28px",
|
||||
display: "grid",
|
||||
gridTemplateColumns: "repeat(25, 1fr)",
|
||||
gridTemplateColumns: `repeat(${MAX_RECENT_CHECKS}, 1fr)`,
|
||||
gap: "3px",
|
||||
alignItems: "flex-end",
|
||||
height: 48,
|
||||
|
||||
@@ -0,0 +1,36 @@
|
||||
import Box from "@mui/material/Box";
|
||||
import { useTranslation } from "react-i18next";
|
||||
import type { SlotProps } from "@/Pages/StatusPage/Status/themes/shared/BaseStatusPage";
|
||||
import type { EditorialStyles } from "@/Pages/StatusPage/Status/themes/editorial/styles";
|
||||
|
||||
export const EditorialHeader = ({
|
||||
statusPage,
|
||||
logoSrc,
|
||||
styles,
|
||||
}: SlotProps<EditorialStyles>) => {
|
||||
const { t } = useTranslation();
|
||||
return (
|
||||
<Box sx={styles.brandWrap}>
|
||||
{logoSrc && (
|
||||
<Box
|
||||
component="img"
|
||||
src={logoSrc}
|
||||
alt={statusPage.companyName}
|
||||
sx={styles.logoImg}
|
||||
/>
|
||||
)}
|
||||
<Box
|
||||
component="h2"
|
||||
sx={styles.brandEyebrow}
|
||||
>
|
||||
{statusPage.companyName}
|
||||
</Box>
|
||||
<Box
|
||||
component="h1"
|
||||
sx={styles.brandTitle}
|
||||
>
|
||||
{t("pages.statusPages.editorial.reportTitle")}
|
||||
</Box>
|
||||
</Box>
|
||||
);
|
||||
};
|
||||
@@ -0,0 +1,46 @@
|
||||
import { useMemo } from "react";
|
||||
import Box from "@mui/material/Box";
|
||||
import { useTranslation } from "react-i18next";
|
||||
import type { SlotProps } from "@/Pages/StatusPage/Status/themes/shared/BaseStatusPage";
|
||||
import type { EditorialStyles } from "@/Pages/StatusPage/Status/themes/editorial/styles";
|
||||
|
||||
export const EditorialHero = ({
|
||||
overall,
|
||||
monitorCount,
|
||||
styles,
|
||||
}: SlotProps<EditorialStyles>) => {
|
||||
const { t } = useTranslation();
|
||||
const todayLabel = useMemo(
|
||||
() =>
|
||||
new Date().toLocaleDateString(undefined, {
|
||||
year: "numeric",
|
||||
month: "long",
|
||||
day: "numeric",
|
||||
}),
|
||||
[]
|
||||
);
|
||||
|
||||
return (
|
||||
<>
|
||||
<Box
|
||||
component="p"
|
||||
sx={styles.statusLine}
|
||||
>
|
||||
<Box
|
||||
component="span"
|
||||
sx={styles.statusDot(overall.tone)}
|
||||
/>
|
||||
{overall.message}
|
||||
</Box>
|
||||
<Box
|
||||
component="p"
|
||||
sx={styles.dateline}
|
||||
>
|
||||
{todayLabel} ·{" "}
|
||||
{t("pages.statusPages.statusBar.monitoringSummary", {
|
||||
count: monitorCount,
|
||||
})}
|
||||
</Box>
|
||||
</>
|
||||
);
|
||||
};
|
||||
@@ -1,224 +0,0 @@
|
||||
import { useMemo, useState } from "react";
|
||||
import Box from "@mui/material/Box";
|
||||
import Stack from "@mui/material/Stack";
|
||||
import { useTranslation } from "react-i18next";
|
||||
import type { Monitor } from "@/Types/Monitor";
|
||||
import type { StatusPage } from "@/Types/StatusPage";
|
||||
import { getMonitorTypeLabel } from "@/Types/StatusPage";
|
||||
import { ThemedHeatmap } from "../shared/ThemedHeatmap";
|
||||
import { ThemedHistogram } from "../shared/ThemedHistogram";
|
||||
import { ThemedInfrastructure } from "../shared/ThemedInfrastructure";
|
||||
import {
|
||||
monitorBadgeTone,
|
||||
resolveOverallStatus,
|
||||
statusBadgeKey,
|
||||
} from "../shared/overallStatus";
|
||||
import { useStatusPageTheme } from "../StatusPageThemeProvider";
|
||||
import { editorialStyles } from "./styles";
|
||||
|
||||
type StatusPageMonitor = Monitor & { checks?: Monitor["recentChecks"] };
|
||||
|
||||
interface Props {
|
||||
statusPage: StatusPage;
|
||||
monitors: StatusPageMonitor[];
|
||||
}
|
||||
|
||||
export const EditorialStatusPage = ({ statusPage, monitors }: Props) => {
|
||||
const { t } = useTranslation();
|
||||
const { tokens } = useStatusPageTheme();
|
||||
const styles = useMemo(() => editorialStyles(tokens), [tokens]);
|
||||
const [chartMode, setChartMode] = useState<"heatmap" | "histogram">("heatmap");
|
||||
|
||||
const todayLabel = useMemo(
|
||||
() =>
|
||||
new Date().toLocaleDateString(undefined, {
|
||||
year: "numeric",
|
||||
month: "long",
|
||||
day: "numeric",
|
||||
}),
|
||||
[]
|
||||
);
|
||||
|
||||
const overall = resolveOverallStatus(monitors, t, {
|
||||
allUpKey: "pages.statusPages.editorial.allUp",
|
||||
});
|
||||
const logoSrc = statusPage.logo?.data
|
||||
? `data:${statusPage.logo.contentType};base64,${statusPage.logo.data}`
|
||||
: null;
|
||||
|
||||
return (
|
||||
<Box sx={styles.page}>
|
||||
<Box
|
||||
component="header"
|
||||
sx={styles.top}
|
||||
>
|
||||
<Box sx={styles.brandWrap}>
|
||||
{logoSrc && (
|
||||
<Box
|
||||
component="img"
|
||||
src={logoSrc}
|
||||
alt={statusPage.companyName}
|
||||
sx={styles.logoImg}
|
||||
/>
|
||||
)}
|
||||
<Box
|
||||
component="h2"
|
||||
sx={styles.brandEyebrow}
|
||||
>
|
||||
{statusPage.companyName}
|
||||
</Box>
|
||||
<Box
|
||||
component="h1"
|
||||
sx={styles.brandTitle}
|
||||
>
|
||||
{t("pages.statusPages.editorial.reportTitle")}
|
||||
</Box>
|
||||
</Box>
|
||||
</Box>
|
||||
|
||||
<Box
|
||||
component="p"
|
||||
sx={styles.statusLine}
|
||||
>
|
||||
<Box
|
||||
component="span"
|
||||
sx={styles.statusDot(overall.tone)}
|
||||
/>
|
||||
{overall.message}
|
||||
</Box>
|
||||
<Box
|
||||
component="p"
|
||||
sx={styles.dateline}
|
||||
>
|
||||
{todayLabel} ·{" "}
|
||||
{t("pages.statusPages.statusBar.monitoringSummary", {
|
||||
count: monitors.length,
|
||||
})}
|
||||
</Box>
|
||||
|
||||
{statusPage.showCharts && (
|
||||
<Box sx={styles.chartSwitchWrap}>
|
||||
<Box
|
||||
sx={styles.chartSwitch}
|
||||
role="radiogroup"
|
||||
>
|
||||
<Box
|
||||
component="button"
|
||||
type="button"
|
||||
role="radio"
|
||||
aria-checked={chartMode === "heatmap"}
|
||||
onClick={() => setChartMode("heatmap")}
|
||||
sx={styles.chartSwitchButton(chartMode === "heatmap")}
|
||||
>
|
||||
{t("pages.statusPages.monitorsList.chartTypeHeatmap")}
|
||||
</Box>
|
||||
<Box
|
||||
component="button"
|
||||
type="button"
|
||||
role="radio"
|
||||
aria-checked={chartMode === "histogram"}
|
||||
onClick={() => setChartMode("histogram")}
|
||||
sx={styles.chartSwitchButton(chartMode === "histogram")}
|
||||
>
|
||||
{t("pages.statusPages.monitorsList.chartTypeHistogram")}
|
||||
</Box>
|
||||
</Box>
|
||||
</Box>
|
||||
)}
|
||||
|
||||
<Stack
|
||||
component="ul"
|
||||
sx={styles.monitorList}
|
||||
>
|
||||
{monitors.map((monitor) => {
|
||||
const isHardware = monitor.type === "hardware";
|
||||
const showInfra = isHardware && statusPage.showInfrastructure !== false;
|
||||
const showChart = !isHardware && statusPage.showCharts !== false;
|
||||
const badgeTone = monitorBadgeTone(monitor.status);
|
||||
|
||||
return (
|
||||
<Box
|
||||
component="li"
|
||||
key={monitor.id}
|
||||
sx={styles.card}
|
||||
>
|
||||
<Box sx={styles.cardRow}>
|
||||
<Box sx={styles.cardLeft}>
|
||||
<Box sx={styles.monitorName}>{monitor.name}</Box>
|
||||
<Box sx={styles.monitorMeta}>
|
||||
<Box
|
||||
component="span"
|
||||
sx={isHardware ? styles.pillHardware : styles.pill}
|
||||
>
|
||||
{getMonitorTypeLabel(monitor.type, t)}
|
||||
</Box>
|
||||
{monitor.url && (
|
||||
<Box
|
||||
component="span"
|
||||
sx={styles.monitorUrl}
|
||||
title={monitor.url}
|
||||
>
|
||||
{monitor.url}
|
||||
</Box>
|
||||
)}
|
||||
</Box>
|
||||
</Box>
|
||||
<Box
|
||||
component="span"
|
||||
sx={styles.badge(badgeTone)}
|
||||
>
|
||||
{t(statusBadgeKey[monitor.status])}
|
||||
</Box>
|
||||
</Box>
|
||||
|
||||
{showInfra && (
|
||||
<ThemedInfrastructure
|
||||
monitor={monitor}
|
||||
sxApi={{
|
||||
containerSx: styles.infra,
|
||||
emptySx: styles.infraEmpty,
|
||||
gaugeSx: styles.gauge,
|
||||
gaugeLabelSx: styles.gaugeLabel,
|
||||
gaugeValueSx: styles.gaugeValue,
|
||||
gaugeBarSx: styles.gaugeBar,
|
||||
gaugeFillSx: styles.gaugeFill,
|
||||
gaugeSubSx: styles.gaugeSub,
|
||||
}}
|
||||
/>
|
||||
)}
|
||||
{showChart &&
|
||||
(chartMode === "heatmap" ? (
|
||||
<ThemedHeatmap
|
||||
checks={monitor.recentChecks ?? []}
|
||||
containerSx={styles.heatmap}
|
||||
cellSx={styles.heatmapCell}
|
||||
/>
|
||||
) : (
|
||||
<ThemedHistogram
|
||||
checks={monitor.recentChecks ?? []}
|
||||
containerSx={styles.histogram}
|
||||
barSx={styles.bar}
|
||||
statsSx={styles.chartStats}
|
||||
/>
|
||||
))}
|
||||
</Box>
|
||||
);
|
||||
})}
|
||||
</Stack>
|
||||
|
||||
<Box
|
||||
component="footer"
|
||||
sx={styles.footer}
|
||||
>
|
||||
{t("pages.statusPages.footer.poweredBy")}{" "}
|
||||
<a
|
||||
href="https://checkmate.so"
|
||||
target="_blank"
|
||||
rel="noopener noreferrer"
|
||||
>
|
||||
Checkmate
|
||||
</a>
|
||||
</Box>
|
||||
</Box>
|
||||
);
|
||||
};
|
||||
@@ -6,6 +6,7 @@ import {
|
||||
MONO_STACK,
|
||||
SERIF_STACK,
|
||||
} from "../shared/fontStacks";
|
||||
import { MAX_RECENT_CHECKS } from "@/Types/Monitor";
|
||||
|
||||
export type EditorialHeatCell = "fast" | "med" | "slow" | "down" | "empty";
|
||||
export type EditorialBarKind = "up" | "down" | "empty";
|
||||
@@ -50,7 +51,10 @@ export interface EditorialStyles {
|
||||
footer: SxProps<Theme>;
|
||||
}
|
||||
|
||||
export const editorialStyles = (tokens: StatusPageThemeTokens): EditorialStyles => {
|
||||
export const editorialStyles = (
|
||||
tokens: StatusPageThemeTokens,
|
||||
_isDark: boolean
|
||||
): EditorialStyles => {
|
||||
const heatCellBg: Record<EditorialHeatCell, string> = {
|
||||
fast: tokens.up,
|
||||
med: `color-mix(in srgb, ${tokens.up} 60%, ${tokens.bg})`,
|
||||
@@ -245,7 +249,7 @@ export const editorialStyles = (tokens: StatusPageThemeTokens): EditorialStyles
|
||||
heatmap: {
|
||||
mt: "16px",
|
||||
display: "grid",
|
||||
gridTemplateColumns: "repeat(25, 1fr)",
|
||||
gridTemplateColumns: `repeat(${MAX_RECENT_CHECKS}, 1fr)`,
|
||||
gap: "2px",
|
||||
height: 40,
|
||||
},
|
||||
@@ -257,7 +261,7 @@ export const editorialStyles = (tokens: StatusPageThemeTokens): EditorialStyles
|
||||
histogram: {
|
||||
mt: "16px",
|
||||
display: "grid",
|
||||
gridTemplateColumns: "repeat(25, 1fr)",
|
||||
gridTemplateColumns: `repeat(${MAX_RECENT_CHECKS}, 1fr)`,
|
||||
gap: "2px",
|
||||
alignItems: "flex-end",
|
||||
height: 40,
|
||||
|
||||
@@ -0,0 +1,24 @@
|
||||
import Box from "@mui/material/Box";
|
||||
import { monoFirstChar } from "@/Pages/StatusPage/Status/themes/shared/overallStatus";
|
||||
import type { SlotProps } from "@/Pages/StatusPage/Status/themes/shared/BaseStatusPage";
|
||||
import type { ModernStyles } from "@/Pages/StatusPage/Status/themes/modern/styles";
|
||||
|
||||
export const ModernHeader = ({
|
||||
statusPage,
|
||||
logoSrc,
|
||||
styles,
|
||||
}: SlotProps<ModernStyles>) => (
|
||||
<Box sx={styles.brand}>
|
||||
{logoSrc ? (
|
||||
<Box
|
||||
component="img"
|
||||
src={logoSrc}
|
||||
alt={statusPage.companyName}
|
||||
sx={styles.logoImg}
|
||||
/>
|
||||
) : (
|
||||
<Box sx={styles.logoGrad}>{monoFirstChar(statusPage.companyName)}</Box>
|
||||
)}
|
||||
{statusPage.companyName}
|
||||
</Box>
|
||||
);
|
||||
@@ -0,0 +1,34 @@
|
||||
import Box from "@mui/material/Box";
|
||||
import { useTranslation } from "react-i18next";
|
||||
import type { SlotProps } from "@/Pages/StatusPage/Status/themes/shared/BaseStatusPage";
|
||||
import type { ModernStyles } from "@/Pages/StatusPage/Status/themes/modern/styles";
|
||||
|
||||
export const ModernHero = ({
|
||||
overall,
|
||||
monitorCount,
|
||||
styles,
|
||||
}: SlotProps<ModernStyles>) => {
|
||||
const { t } = useTranslation();
|
||||
return (
|
||||
<Box sx={styles.hero}>
|
||||
<Box sx={styles.pulse(overall.tone)} />
|
||||
<Box sx={styles.statusCopy}>
|
||||
<Box
|
||||
component="h1"
|
||||
sx={styles.heroTitle}
|
||||
>
|
||||
{overall.message}
|
||||
</Box>
|
||||
<Box
|
||||
component="p"
|
||||
sx={styles.heroSub}
|
||||
>
|
||||
{t("pages.statusPages.statusBar.monitoringSummary", {
|
||||
count: monitorCount,
|
||||
})}
|
||||
</Box>
|
||||
</Box>
|
||||
<Box sx={styles.heroIcon(overall.tone)}>{overall.icon}</Box>
|
||||
</Box>
|
||||
);
|
||||
};
|
||||
@@ -3,6 +3,7 @@ import { keyframes } from "@mui/system";
|
||||
import type { StatusPageThemeTokens } from "../tokens";
|
||||
import { type OverallTone, toneColor, toneSoft } from "../shared/overallStatus";
|
||||
import { MONO_STACK, SANS_STACK } from "../shared/fontStacks";
|
||||
import { MAX_RECENT_CHECKS } from "@/Types/Monitor";
|
||||
|
||||
export type ModernHeatCell = "fast" | "med" | "slow" | "down" | "empty";
|
||||
export type ModernBarKind = "up" | "down" | "empty";
|
||||
@@ -320,7 +321,7 @@ export const modernStyles = (
|
||||
heatmap: {
|
||||
padding: "0 24px 20px",
|
||||
display: "grid",
|
||||
gridTemplateColumns: "repeat(25, 1fr)",
|
||||
gridTemplateColumns: `repeat(${MAX_RECENT_CHECKS}, 1fr)`,
|
||||
gap: "3px",
|
||||
height: 46,
|
||||
},
|
||||
@@ -335,7 +336,7 @@ export const modernStyles = (
|
||||
histogram: {
|
||||
padding: "0 24px",
|
||||
display: "grid",
|
||||
gridTemplateColumns: "repeat(25, 1fr)",
|
||||
gridTemplateColumns: `repeat(${MAX_RECENT_CHECKS}, 1fr)`,
|
||||
gap: "3px",
|
||||
alignItems: "flex-end",
|
||||
height: 46,
|
||||
|
||||
@@ -0,0 +1,29 @@
|
||||
import Box from "@mui/material/Box";
|
||||
import { monoFirstChar } from "@/Pages/StatusPage/Status/themes/shared/overallStatus";
|
||||
import type { SlotProps } from "@/Pages/StatusPage/Status/themes/shared/BaseStatusPage";
|
||||
import type { RefinedStyles } from "@/Pages/StatusPage/Status/themes/refined/styles";
|
||||
|
||||
export const RefinedHeader = ({
|
||||
statusPage,
|
||||
logoSrc,
|
||||
styles,
|
||||
}: SlotProps<RefinedStyles>) => (
|
||||
<Box sx={styles.brand}>
|
||||
{logoSrc ? (
|
||||
<Box
|
||||
component="img"
|
||||
src={logoSrc}
|
||||
alt={statusPage.companyName}
|
||||
sx={styles.logoImg}
|
||||
/>
|
||||
) : (
|
||||
<Box sx={styles.logoMono}>{monoFirstChar(statusPage.companyName)}</Box>
|
||||
)}
|
||||
<Box
|
||||
component="span"
|
||||
sx={styles.company}
|
||||
>
|
||||
{statusPage.companyName}
|
||||
</Box>
|
||||
</Box>
|
||||
);
|
||||
@@ -0,0 +1,34 @@
|
||||
import Box from "@mui/material/Box";
|
||||
import { useTranslation } from "react-i18next";
|
||||
import type { SlotProps } from "@/Pages/StatusPage/Status/themes/shared/BaseStatusPage";
|
||||
import type { RefinedStyles } from "@/Pages/StatusPage/Status/themes/refined/styles";
|
||||
|
||||
export const RefinedHero = ({
|
||||
overall,
|
||||
monitorCount,
|
||||
styles,
|
||||
}: SlotProps<RefinedStyles>) => {
|
||||
const { t } = useTranslation();
|
||||
return (
|
||||
<Box sx={styles.hero}>
|
||||
<Box sx={styles.statusDot(overall.tone)} />
|
||||
<Box sx={styles.statusCopy}>
|
||||
<Box
|
||||
component="h1"
|
||||
sx={styles.heroTitle}
|
||||
>
|
||||
{overall.message}
|
||||
</Box>
|
||||
<Box
|
||||
component="p"
|
||||
sx={styles.heroSub}
|
||||
>
|
||||
{t("pages.statusPages.statusBar.monitoringSummary", {
|
||||
count: monitorCount,
|
||||
})}
|
||||
</Box>
|
||||
</Box>
|
||||
<Box sx={styles.heroIcon(overall.tone)}>{overall.icon}</Box>
|
||||
</Box>
|
||||
);
|
||||
};
|
||||
@@ -1,210 +0,0 @@
|
||||
import { useMemo, useState } from "react";
|
||||
import Box from "@mui/material/Box";
|
||||
import Stack from "@mui/material/Stack";
|
||||
import { useTranslation } from "react-i18next";
|
||||
import type { Monitor } from "@/Types/Monitor";
|
||||
import type { StatusPage } from "@/Types/StatusPage";
|
||||
import { getMonitorTypeLabel } from "@/Types/StatusPage";
|
||||
import { ThemedHeatmap } from "../shared/ThemedHeatmap";
|
||||
import { ThemedHistogram } from "../shared/ThemedHistogram";
|
||||
import { ThemedInfrastructure } from "../shared/ThemedInfrastructure";
|
||||
import {
|
||||
monitorBadgeTone,
|
||||
monoFirstChar,
|
||||
resolveOverallStatus,
|
||||
statusBadgeKey,
|
||||
} from "../shared/overallStatus";
|
||||
import { useStatusPageTheme } from "../StatusPageThemeProvider";
|
||||
import { refinedStyles } from "./styles";
|
||||
|
||||
type StatusPageMonitor = Monitor & { checks?: Monitor["recentChecks"] };
|
||||
|
||||
interface Props {
|
||||
statusPage: StatusPage;
|
||||
monitors: StatusPageMonitor[];
|
||||
}
|
||||
|
||||
export const RefinedStatusPage = ({ statusPage, monitors }: Props) => {
|
||||
const { t } = useTranslation();
|
||||
const { tokens } = useStatusPageTheme();
|
||||
const styles = useMemo(() => refinedStyles(tokens), [tokens]);
|
||||
const [chartMode, setChartMode] = useState<"heatmap" | "histogram">("heatmap");
|
||||
|
||||
const overall = resolveOverallStatus(monitors, t);
|
||||
const logoSrc = statusPage.logo?.data
|
||||
? `data:${statusPage.logo.contentType};base64,${statusPage.logo.data}`
|
||||
: null;
|
||||
|
||||
return (
|
||||
<Box sx={styles.page}>
|
||||
<Box
|
||||
component="header"
|
||||
sx={styles.top}
|
||||
>
|
||||
<Box sx={styles.brand}>
|
||||
{logoSrc ? (
|
||||
<Box
|
||||
component="img"
|
||||
src={logoSrc}
|
||||
alt={statusPage.companyName}
|
||||
sx={styles.logoImg}
|
||||
/>
|
||||
) : (
|
||||
<Box sx={styles.logoMono}>{monoFirstChar(statusPage.companyName)}</Box>
|
||||
)}
|
||||
<Box
|
||||
component="span"
|
||||
sx={styles.company}
|
||||
>
|
||||
{statusPage.companyName}
|
||||
</Box>
|
||||
</Box>
|
||||
</Box>
|
||||
|
||||
<Box sx={styles.hero}>
|
||||
<Box sx={styles.statusDot(overall.tone)} />
|
||||
<Box sx={styles.statusCopy}>
|
||||
<Box
|
||||
component="h1"
|
||||
sx={styles.heroTitle}
|
||||
>
|
||||
{overall.message}
|
||||
</Box>
|
||||
<Box
|
||||
component="p"
|
||||
sx={styles.heroSub}
|
||||
>
|
||||
{t("pages.statusPages.statusBar.monitoringSummary", {
|
||||
count: monitors.length,
|
||||
})}
|
||||
</Box>
|
||||
</Box>
|
||||
<Box sx={styles.heroIcon(overall.tone)}>{overall.icon}</Box>
|
||||
</Box>
|
||||
|
||||
{statusPage.showCharts && (
|
||||
<Box sx={styles.chartSwitchWrap}>
|
||||
<Box
|
||||
sx={styles.chartSwitch}
|
||||
role="radiogroup"
|
||||
>
|
||||
<Box
|
||||
component="button"
|
||||
type="button"
|
||||
role="radio"
|
||||
aria-checked={chartMode === "heatmap"}
|
||||
onClick={() => setChartMode("heatmap")}
|
||||
sx={styles.chartSwitchButton(chartMode === "heatmap")}
|
||||
>
|
||||
{t("pages.statusPages.monitorsList.chartTypeHeatmap")}
|
||||
</Box>
|
||||
<Box
|
||||
component="button"
|
||||
type="button"
|
||||
role="radio"
|
||||
aria-checked={chartMode === "histogram"}
|
||||
onClick={() => setChartMode("histogram")}
|
||||
sx={styles.chartSwitchButton(chartMode === "histogram")}
|
||||
>
|
||||
{t("pages.statusPages.monitorsList.chartTypeHistogram")}
|
||||
</Box>
|
||||
</Box>
|
||||
</Box>
|
||||
)}
|
||||
|
||||
<Stack
|
||||
component="ul"
|
||||
sx={styles.monitorList}
|
||||
>
|
||||
{monitors.map((monitor) => {
|
||||
const isHardware = monitor.type === "hardware";
|
||||
const showInfra = isHardware && statusPage.showInfrastructure !== false;
|
||||
const showChart = !isHardware && statusPage.showCharts !== false;
|
||||
const badgeTone = monitorBadgeTone(monitor.status);
|
||||
|
||||
return (
|
||||
<Box
|
||||
component="li"
|
||||
key={monitor.id}
|
||||
sx={styles.card}
|
||||
>
|
||||
<Box sx={styles.cardRow}>
|
||||
<Box sx={styles.cardLeft}>
|
||||
<Box sx={styles.monitorName}>{monitor.name}</Box>
|
||||
<Box sx={styles.monitorMeta}>
|
||||
<Box
|
||||
component="span"
|
||||
sx={isHardware ? styles.pillHardware : styles.pill}
|
||||
>
|
||||
{getMonitorTypeLabel(monitor.type, t)}
|
||||
</Box>
|
||||
{monitor.url && (
|
||||
<Box
|
||||
component="span"
|
||||
sx={styles.monitorUrl}
|
||||
title={monitor.url}
|
||||
>
|
||||
{monitor.url}
|
||||
</Box>
|
||||
)}
|
||||
</Box>
|
||||
</Box>
|
||||
<Box
|
||||
component="span"
|
||||
sx={styles.badge(badgeTone)}
|
||||
>
|
||||
{t(statusBadgeKey[monitor.status])}
|
||||
</Box>
|
||||
</Box>
|
||||
|
||||
{showInfra && (
|
||||
<ThemedInfrastructure
|
||||
monitor={monitor}
|
||||
sxApi={{
|
||||
containerSx: styles.infra,
|
||||
emptySx: styles.infraEmpty,
|
||||
gaugeSx: styles.gauge,
|
||||
gaugeLabelSx: styles.gaugeLabel,
|
||||
gaugeValueSx: styles.gaugeValue,
|
||||
gaugeBarSx: styles.gaugeBar,
|
||||
gaugeFillSx: styles.gaugeFill,
|
||||
gaugeSubSx: styles.gaugeSub,
|
||||
}}
|
||||
/>
|
||||
)}
|
||||
{showChart &&
|
||||
(chartMode === "heatmap" ? (
|
||||
<ThemedHeatmap
|
||||
checks={monitor.recentChecks ?? []}
|
||||
containerSx={styles.heatmap}
|
||||
cellSx={styles.heatmapCell}
|
||||
/>
|
||||
) : (
|
||||
<ThemedHistogram
|
||||
checks={monitor.recentChecks ?? []}
|
||||
containerSx={styles.histogram}
|
||||
barSx={styles.bar}
|
||||
statsSx={styles.chartStats}
|
||||
/>
|
||||
))}
|
||||
</Box>
|
||||
);
|
||||
})}
|
||||
</Stack>
|
||||
|
||||
<Box
|
||||
component="footer"
|
||||
sx={styles.footer}
|
||||
>
|
||||
{t("pages.statusPages.footer.poweredBy")}{" "}
|
||||
<a
|
||||
href="https://checkmate.so"
|
||||
target="_blank"
|
||||
rel="noopener noreferrer"
|
||||
>
|
||||
Checkmate
|
||||
</a>
|
||||
</Box>
|
||||
</Box>
|
||||
);
|
||||
};
|
||||
@@ -6,6 +6,7 @@ import { MONO_STACK, SANS_STACK } from "../shared/fontStacks";
|
||||
export type RefinedHeatCell = "fast" | "med" | "slow" | "down" | "empty";
|
||||
export type RefinedBarKind = "up" | "down" | "empty";
|
||||
export type RefinedGaugeFill = "ok" | "warm" | "hot";
|
||||
import { MAX_RECENT_CHECKS } from "@/Types/Monitor";
|
||||
|
||||
export interface RefinedStyles {
|
||||
page: SxProps<Theme>;
|
||||
@@ -62,7 +63,10 @@ const pillBase = {
|
||||
fontWeight: 600,
|
||||
};
|
||||
|
||||
export const refinedStyles = (tokens: StatusPageThemeTokens): RefinedStyles => {
|
||||
export const refinedStyles = (
|
||||
tokens: StatusPageThemeTokens,
|
||||
_isDark: boolean
|
||||
): RefinedStyles => {
|
||||
const heatCellBg: Record<RefinedHeatCell, string> = {
|
||||
fast: tokens.up,
|
||||
med: `color-mix(in srgb, ${tokens.up} 60%, #ffffff 40%)`,
|
||||
@@ -259,7 +263,7 @@ export const refinedStyles = (tokens: StatusPageThemeTokens): RefinedStyles => {
|
||||
heatmap: {
|
||||
padding: "0 20px 16px",
|
||||
display: "grid",
|
||||
gridTemplateColumns: "repeat(25, 1fr)",
|
||||
gridTemplateColumns: `repeat(${MAX_RECENT_CHECKS}, 1fr)`,
|
||||
gap: "3px",
|
||||
height: 42,
|
||||
},
|
||||
@@ -274,7 +278,7 @@ export const refinedStyles = (tokens: StatusPageThemeTokens): RefinedStyles => {
|
||||
histogram: {
|
||||
padding: "0 20px",
|
||||
display: "grid",
|
||||
gridTemplateColumns: "repeat(25, 1fr)",
|
||||
gridTemplateColumns: `repeat(${MAX_RECENT_CHECKS}, 1fr)`,
|
||||
gap: "3px",
|
||||
alignItems: "flex-end",
|
||||
height: 42,
|
||||
|
||||
+88
-43
@@ -2,80 +2,125 @@ import { useMemo, useState } from "react";
|
||||
import Box from "@mui/material/Box";
|
||||
import Stack from "@mui/material/Stack";
|
||||
import { useTranslation } from "react-i18next";
|
||||
import type { SxProps, Theme } from "@mui/material/styles";
|
||||
import type { Monitor } from "@/Types/Monitor";
|
||||
import type { StatusPage } from "@/Types/StatusPage";
|
||||
import { getMonitorTypeLabel } from "@/Types/StatusPage";
|
||||
import { ThemedHeatmap } from "../shared/ThemedHeatmap";
|
||||
import { ThemedHistogram } from "../shared/ThemedHistogram";
|
||||
import { ThemedInfrastructure } from "../shared/ThemedInfrastructure";
|
||||
import type { StatusPageThemeTokens } from "@/Pages/StatusPage/Status/themes/tokens";
|
||||
import {
|
||||
ThemedHeatmap,
|
||||
type HeatCellKind,
|
||||
} from "@/Pages/StatusPage/Status/themes/shared/ThemedHeatmap";
|
||||
import {
|
||||
ThemedHistogram,
|
||||
type BarKind,
|
||||
} from "@/Pages/StatusPage/Status/themes/shared/ThemedHistogram";
|
||||
import {
|
||||
ThemedInfrastructure,
|
||||
type GaugeFillLevel,
|
||||
} from "@/Pages/StatusPage/Status/themes/shared/ThemedInfrastructure";
|
||||
import {
|
||||
type OverallStatus,
|
||||
type OverallTone,
|
||||
monitorBadgeTone,
|
||||
monoFirstChar,
|
||||
resolveOverallStatus,
|
||||
statusBadgeKey,
|
||||
} from "../shared/overallStatus";
|
||||
import { useStatusPageTheme } from "../StatusPageThemeProvider";
|
||||
import { modernStyles } from "./styles";
|
||||
} from "@/Pages/StatusPage/Status/themes/shared/overallStatus";
|
||||
import { useStatusPageTheme } from "@/Pages/StatusPage/Status/themes/StatusPageThemeProvider";
|
||||
|
||||
type StatusPageMonitor = Monitor & { checks?: Monitor["recentChecks"] };
|
||||
|
||||
export interface BaseStyles {
|
||||
page: SxProps<Theme>;
|
||||
top: SxProps<Theme>;
|
||||
chartSwitchWrap: SxProps<Theme>;
|
||||
chartSwitch: SxProps<Theme>;
|
||||
chartSwitchButton: (active: boolean) => SxProps<Theme>;
|
||||
monitorList: SxProps<Theme>;
|
||||
card: SxProps<Theme>;
|
||||
cardRow: SxProps<Theme>;
|
||||
cardLeft: SxProps<Theme>;
|
||||
monitorName: SxProps<Theme>;
|
||||
monitorMeta: SxProps<Theme>;
|
||||
pill: SxProps<Theme>;
|
||||
pillHardware: SxProps<Theme>;
|
||||
monitorUrl: SxProps<Theme>;
|
||||
badge: (tone: OverallTone) => SxProps<Theme>;
|
||||
heatmap: SxProps<Theme>;
|
||||
heatmapCell: (kind: HeatCellKind) => SxProps<Theme>;
|
||||
histogram: SxProps<Theme>;
|
||||
bar: (kind: BarKind, heightPct: number) => SxProps<Theme>;
|
||||
chartStats: SxProps<Theme>;
|
||||
infra: SxProps<Theme>;
|
||||
infraEmpty: SxProps<Theme>;
|
||||
gauge: SxProps<Theme>;
|
||||
gaugeLabel: SxProps<Theme>;
|
||||
gaugeValue: SxProps<Theme>;
|
||||
gaugeBar: SxProps<Theme>;
|
||||
gaugeFill: (level: GaugeFillLevel, widthPct: number) => SxProps<Theme>;
|
||||
gaugeSub: SxProps<Theme>;
|
||||
footer: SxProps<Theme>;
|
||||
}
|
||||
|
||||
export interface SlotProps<S extends BaseStyles = BaseStyles> {
|
||||
statusPage: StatusPage;
|
||||
logoSrc: string | null;
|
||||
overall: OverallStatus;
|
||||
monitorCount: number;
|
||||
styles: S;
|
||||
}
|
||||
|
||||
export interface ThemeConfig<S extends BaseStyles = BaseStyles> {
|
||||
createStyles: (tokens: StatusPageThemeTokens, isDark: boolean) => S;
|
||||
HeaderSlot: React.ComponentType<SlotProps<S>>;
|
||||
HeroSlot: React.ComponentType<SlotProps<S>>;
|
||||
overallStatusOptions?: { iconSize?: number; allUpKey?: string };
|
||||
}
|
||||
|
||||
interface Props {
|
||||
statusPage: StatusPage;
|
||||
monitors: StatusPageMonitor[];
|
||||
config: ThemeConfig<any>;
|
||||
}
|
||||
|
||||
export const ModernStatusPage = ({ statusPage, monitors }: Props) => {
|
||||
export const BaseStatusPage = ({ statusPage, monitors, config }: Props) => {
|
||||
const { t } = useTranslation();
|
||||
const { tokens, mode } = useStatusPageTheme();
|
||||
const styles = useMemo(() => modernStyles(tokens, mode === "dark"), [tokens, mode]);
|
||||
const styles = useMemo(
|
||||
() => config.createStyles(tokens, mode === "dark"),
|
||||
[config, tokens, mode]
|
||||
);
|
||||
const [chartMode, setChartMode] = useState<"heatmap" | "histogram">("heatmap");
|
||||
|
||||
const overall = resolveOverallStatus(monitors, t, { iconSize: 20 });
|
||||
const overall = resolveOverallStatus(monitors, t, config.overallStatusOptions);
|
||||
const logoSrc = statusPage.logo?.data
|
||||
? `data:${statusPage.logo.contentType};base64,${statusPage.logo.data}`
|
||||
: null;
|
||||
|
||||
const { HeaderSlot, HeroSlot } = config;
|
||||
|
||||
return (
|
||||
<Box sx={styles.page}>
|
||||
<Box
|
||||
component="header"
|
||||
sx={styles.top}
|
||||
>
|
||||
<Box sx={styles.brand}>
|
||||
{logoSrc ? (
|
||||
<Box
|
||||
component="img"
|
||||
src={logoSrc}
|
||||
alt={statusPage.companyName}
|
||||
sx={styles.logoImg}
|
||||
/>
|
||||
) : (
|
||||
<Box sx={styles.logoGrad}>{monoFirstChar(statusPage.companyName)}</Box>
|
||||
)}
|
||||
{statusPage.companyName}
|
||||
</Box>
|
||||
<HeaderSlot
|
||||
statusPage={statusPage}
|
||||
logoSrc={logoSrc}
|
||||
overall={overall}
|
||||
monitorCount={monitors.length}
|
||||
styles={styles}
|
||||
/>
|
||||
</Box>
|
||||
|
||||
<Box sx={styles.hero}>
|
||||
<Box sx={styles.pulse(overall.tone)} />
|
||||
<Box sx={styles.statusCopy}>
|
||||
<Box
|
||||
component="h1"
|
||||
sx={styles.heroTitle}
|
||||
>
|
||||
{overall.message}
|
||||
</Box>
|
||||
<Box
|
||||
component="p"
|
||||
sx={styles.heroSub}
|
||||
>
|
||||
{t("pages.statusPages.statusBar.monitoringSummary", {
|
||||
count: monitors.length,
|
||||
})}
|
||||
</Box>
|
||||
</Box>
|
||||
<Box sx={styles.heroIcon(overall.tone)}>{overall.icon}</Box>
|
||||
</Box>
|
||||
<HeroSlot
|
||||
statusPage={statusPage}
|
||||
logoSrc={logoSrc}
|
||||
overall={overall}
|
||||
monitorCount={monitors.length}
|
||||
styles={styles}
|
||||
/>
|
||||
|
||||
{statusPage.showCharts && (
|
||||
<Box sx={styles.chartSwitchWrap}>
|
||||
@@ -4,12 +4,12 @@ import Stack from "@mui/material/Stack";
|
||||
import Typography from "@mui/material/Typography";
|
||||
import type { SxProps, Theme } from "@mui/material/styles";
|
||||
import { useTranslation } from "react-i18next";
|
||||
import { useSelector } from "react-redux";
|
||||
import type { RootState } from "@/store";
|
||||
import type { CheckSnapshot } from "@/Types/Check";
|
||||
import { formatDateWithTz } from "@/Utils/TimeUtils";
|
||||
import { MAX_RECENT_CHECKS } from "@/Types/Monitor";
|
||||
import { useStatusPageTheme } from "../StatusPageThemeProvider";
|
||||
|
||||
const CELLS = 25;
|
||||
const CELLS = MAX_RECENT_CHECKS;
|
||||
|
||||
export type HeatCellKind = "fast" | "med" | "slow" | "down" | "empty";
|
||||
|
||||
@@ -29,7 +29,7 @@ const classify = (check: CheckSnapshot): Exclude<HeatCellKind, "empty"> => {
|
||||
|
||||
export const ThemedHeatmap = ({ checks, containerSx, cellSx }: Props) => {
|
||||
const { t } = useTranslation();
|
||||
const uiTimezone = useSelector((state: RootState) => state.ui.timezone);
|
||||
const { timezone } = useStatusPageTheme();
|
||||
|
||||
const source = checks.slice(-CELLS);
|
||||
const padded: (CheckSnapshot | null)[] = [
|
||||
@@ -67,11 +67,7 @@ export const ThemedHeatmap = ({ checks, containerSx, cellSx }: Props) => {
|
||||
variant="caption"
|
||||
sx={{ opacity: 0.8 }}
|
||||
>
|
||||
{formatDateWithTz(
|
||||
check.createdAt,
|
||||
"ddd, MMMM D, YYYY, HH:mm A",
|
||||
uiTimezone
|
||||
)}
|
||||
{formatDateWithTz(check.createdAt, "ddd, MMMM D, YYYY, HH:mm A", timezone)}
|
||||
</Typography>
|
||||
</Stack>
|
||||
);
|
||||
|
||||
@@ -5,12 +5,11 @@ import Stack from "@mui/material/Stack";
|
||||
import Typography from "@mui/material/Typography";
|
||||
import type { SxProps, Theme } from "@mui/material/styles";
|
||||
import { useTranslation } from "react-i18next";
|
||||
import { useSelector } from "react-redux";
|
||||
import type { RootState } from "@/store";
|
||||
import type { CheckSnapshot } from "@/Types/Check";
|
||||
import { formatDateWithTz } from "@/Utils/TimeUtils";
|
||||
|
||||
const CELLS = 25;
|
||||
import { MAX_RECENT_CHECKS } from "@/Types/Monitor";
|
||||
import { useStatusPageTheme } from "../StatusPageThemeProvider";
|
||||
const CELLS = MAX_RECENT_CHECKS;
|
||||
const MIN_HEIGHT_PCT = 6;
|
||||
|
||||
export type BarKind = "up" | "down" | "empty";
|
||||
@@ -34,7 +33,7 @@ export const ThemedHistogram = ({
|
||||
statsGap = 1,
|
||||
}: Props) => {
|
||||
const { t } = useTranslation();
|
||||
const uiTimezone = useSelector((state: RootState) => state.ui.timezone);
|
||||
const { timezone } = useStatusPageTheme();
|
||||
|
||||
const { padded, max, avg, peak } = useMemo(() => {
|
||||
const source = checks.slice(-CELLS);
|
||||
@@ -83,7 +82,7 @@ export const ThemedHistogram = ({
|
||||
{formatDateWithTz(
|
||||
check.createdAt,
|
||||
"ddd, MMMM D, YYYY, HH:mm A",
|
||||
uiTimezone
|
||||
timezone
|
||||
)}
|
||||
</Typography>
|
||||
</Stack>
|
||||
|
||||
@@ -0,0 +1,109 @@
|
||||
import { ActionsMenu, type ActionMenuItem } from "@/Components/actions-menu";
|
||||
import Typography from "@mui/material/Typography";
|
||||
import Box from "@mui/material/Box";
|
||||
import type { Header } from "@/Components/design-elements/Table";
|
||||
import { Table, ColoredLabel } from "@/Components/design-elements";
|
||||
import { Pagination } from "@/Components/design-elements/Table";
|
||||
import { useClientPagination } from "@/Hooks/useClientPagination";
|
||||
|
||||
import type { Tag } from "@/Types/Tag";
|
||||
import { useNavigate } from "react-router";
|
||||
import { useTranslation } from "react-i18next";
|
||||
import { useTheme } from "@mui/material";
|
||||
|
||||
interface TagsTableProps {
|
||||
tags: Tag[];
|
||||
setSelectedTag: Function;
|
||||
}
|
||||
|
||||
export const TagsTable = ({ tags, setSelectedTag }: TagsTableProps) => {
|
||||
const navigate = useNavigate();
|
||||
const { t } = useTranslation();
|
||||
const theme = useTheme();
|
||||
const { pagedRows, paginationProps } = useClientPagination(tags);
|
||||
|
||||
const getActions = (tag: Tag): ActionMenuItem[] => {
|
||||
return [
|
||||
{
|
||||
id: 1,
|
||||
label: t("pages.common.monitors.actions.configure"),
|
||||
action: () => {
|
||||
navigate(`/tags/configure/${tag.id}`);
|
||||
},
|
||||
closeMenu: true,
|
||||
},
|
||||
|
||||
{
|
||||
id: 2,
|
||||
label: (
|
||||
<Typography color={theme.palette.error.main}>
|
||||
{t("pages.common.monitors.actions.delete")}
|
||||
</Typography>
|
||||
),
|
||||
action: async () => {
|
||||
setSelectedTag(tag);
|
||||
},
|
||||
closeMenu: true,
|
||||
},
|
||||
];
|
||||
};
|
||||
|
||||
const getHeaders = () => {
|
||||
const headers: Header<Tag>[] = [
|
||||
{
|
||||
id: "name",
|
||||
content: t("common.table.headers.name"),
|
||||
render: (row) => {
|
||||
return <Typography>{row?.name}</Typography>;
|
||||
},
|
||||
},
|
||||
|
||||
{
|
||||
id: "color",
|
||||
content: t("pages.tags.table.headers.color"),
|
||||
render: (row) => {
|
||||
return <Typography textTransform={"capitalize"}>{row?.color}</Typography>;
|
||||
},
|
||||
},
|
||||
{
|
||||
id: "chip",
|
||||
content: t("pages.tags.table.headers.appearance"),
|
||||
render: (row) => {
|
||||
return (
|
||||
<Box
|
||||
display="flex"
|
||||
justifyContent="center"
|
||||
>
|
||||
<ColoredLabel
|
||||
text={row.name}
|
||||
color={row.color}
|
||||
/>
|
||||
</Box>
|
||||
);
|
||||
},
|
||||
},
|
||||
|
||||
{
|
||||
id: "actions",
|
||||
content: t("common.table.headers.actions"),
|
||||
render: (row) => {
|
||||
return <ActionsMenu items={getActions(row)} />;
|
||||
},
|
||||
},
|
||||
];
|
||||
return headers;
|
||||
};
|
||||
|
||||
return (
|
||||
<>
|
||||
<Table
|
||||
headers={getHeaders()}
|
||||
data={pagedRows}
|
||||
onRowClick={(row) => {
|
||||
navigate(`/tags/configure/${row.id}`);
|
||||
}}
|
||||
/>
|
||||
{tags.length > 0 && <Pagination {...paginationProps} />}
|
||||
</>
|
||||
);
|
||||
};
|
||||
@@ -0,0 +1,118 @@
|
||||
import { BasePage, ConfigBox } from "@/Components/design-elements";
|
||||
import { TextField, Button, ColorInput } from "@/Components/inputs";
|
||||
import Stack from "@mui/material/Stack";
|
||||
import { useTheme } from "@mui/material/styles";
|
||||
|
||||
import { useEffect } from "react";
|
||||
import { useParams } from "react-router-dom";
|
||||
import { useNavigate } from "react-router-dom";
|
||||
import { Controller, useForm } from "react-hook-form";
|
||||
import { zodResolver } from "@hookform/resolvers/zod";
|
||||
import { mutate } from "swr";
|
||||
import { useGet, usePost, usePatch } from "@/Hooks/UseApi";
|
||||
import type { TagFormData } from "@/Validation/tag";
|
||||
import type { Tag } from "@/Types/Tag";
|
||||
import { useTranslation } from "react-i18next";
|
||||
import { useTagsForm } from "@/Hooks/useTagsForm";
|
||||
|
||||
const TagsCreatePage = () => {
|
||||
const { t } = useTranslation();
|
||||
const theme = useTheme();
|
||||
const navigate = useNavigate();
|
||||
const { tagId } = useParams<{ tagId: string }>();
|
||||
const isEditMode = Boolean(tagId);
|
||||
|
||||
const { data: existingTag } = useGet<Tag>(isEditMode ? `/tags/${tagId}` : null);
|
||||
|
||||
const { post, loading: isSubmitting } = usePost<TagFormData, Tag>();
|
||||
const { patch, loading: isPatching } = usePatch<TagFormData, Tag>();
|
||||
|
||||
const { schema, defaults } = useTagsForm({ data: existingTag });
|
||||
|
||||
const form = useForm<TagFormData>({
|
||||
resolver: zodResolver(schema),
|
||||
defaultValues: defaults,
|
||||
});
|
||||
|
||||
const { control, reset, handleSubmit } = form;
|
||||
|
||||
useEffect(() => {
|
||||
reset(defaults);
|
||||
}, [defaults, reset]);
|
||||
|
||||
const onSubmit = async (data: TagFormData) => {
|
||||
const result = isEditMode
|
||||
? await patch(`/tags/${tagId}`, data)
|
||||
: await post("/tags", data);
|
||||
if (result?.success) {
|
||||
await mutate((key) => typeof key === "string" && key.startsWith("/tags"));
|
||||
navigate("/tags");
|
||||
}
|
||||
};
|
||||
|
||||
return (
|
||||
<BasePage
|
||||
component="form"
|
||||
onSubmit={handleSubmit(onSubmit)}
|
||||
>
|
||||
<ConfigBox
|
||||
title={t("pages.tags.form.name.title")}
|
||||
subtitle={t("pages.tags.form.name.description")}
|
||||
rightContent={
|
||||
<Controller
|
||||
name="name"
|
||||
control={control}
|
||||
defaultValue={defaults.name}
|
||||
render={({ field, fieldState }) => (
|
||||
<TextField
|
||||
{...field}
|
||||
type="text"
|
||||
fieldLabel={t("pages.tags.form.name.optionName")}
|
||||
placeholder={t("pages.tags.form.name.placeholder")}
|
||||
fullWidth
|
||||
error={!!fieldState.error}
|
||||
helperText={fieldState.error?.message ?? ""}
|
||||
/>
|
||||
)}
|
||||
/>
|
||||
}
|
||||
/>
|
||||
<ConfigBox
|
||||
title={t("pages.tags.form.color.title")}
|
||||
subtitle={t("pages.tags.form.color.description")}
|
||||
rightContent={
|
||||
<Controller
|
||||
name="color"
|
||||
control={control}
|
||||
defaultValue={defaults.color}
|
||||
render={({ field }) => (
|
||||
<ColorInput
|
||||
format="hex"
|
||||
value={field.value}
|
||||
onChange={field.onChange}
|
||||
fieldLabel={t("pages.tags.form.color.optionName")}
|
||||
/>
|
||||
)}
|
||||
/>
|
||||
}
|
||||
/>
|
||||
|
||||
<Stack
|
||||
direction="row"
|
||||
justifyContent="flex-end"
|
||||
spacing={theme.spacing(2)}
|
||||
>
|
||||
<Button
|
||||
loading={isSubmitting || isPatching}
|
||||
type="submit"
|
||||
variant="contained"
|
||||
color="primary"
|
||||
>
|
||||
{t("common.buttons.save")}
|
||||
</Button>
|
||||
</Stack>
|
||||
</BasePage>
|
||||
);
|
||||
};
|
||||
|
||||
export default TagsCreatePage;
|
||||
@@ -0,0 +1,72 @@
|
||||
import { BasePageWithStates } from "@/Components/design-elements";
|
||||
import { TagsTable } from "@/Pages/Tags/components/TagsTable";
|
||||
import { Dialog } from "@/Components/inputs";
|
||||
import { HeaderCreate } from "@/Components/common";
|
||||
|
||||
import { useState } from "react";
|
||||
import { useGet, useDelete } from "@/Hooks/UseApi";
|
||||
import { useTranslation } from "react-i18next";
|
||||
import type { Tag } from "@/Types/Tag";
|
||||
import { useIsAdmin } from "@/Hooks/useIsAdmin";
|
||||
|
||||
const TagsPage = () => {
|
||||
const { t } = useTranslation();
|
||||
const isAdmin = useIsAdmin();
|
||||
|
||||
const [selectedTag, setSelectedTag] = useState<Tag | null>(null);
|
||||
const isDialogOpen = Boolean(selectedTag);
|
||||
|
||||
const {
|
||||
data: tags,
|
||||
isLoading,
|
||||
isValidating,
|
||||
error,
|
||||
refetch,
|
||||
} = useGet<Tag[]>("/tags/team", {}, { keepPreviousData: true });
|
||||
|
||||
const { deleteFn, loading: isDeleting } = useDelete();
|
||||
|
||||
const handleConfirm = async () => {
|
||||
if (!selectedTag) return;
|
||||
await deleteFn(`/tags/${selectedTag.id}`);
|
||||
setSelectedTag(null);
|
||||
refetch();
|
||||
};
|
||||
|
||||
const handleCancel = () => {
|
||||
setSelectedTag(null);
|
||||
};
|
||||
|
||||
return (
|
||||
<BasePageWithStates
|
||||
headerKey="tags"
|
||||
page={t("pages.tags.fallback.title")}
|
||||
description={t("pages.tags.fallback.description")}
|
||||
loading={isLoading || isValidating}
|
||||
error={!!error}
|
||||
totalCount={tags?.length ?? 0}
|
||||
actionButtonText={t("pages.tags.fallback.actionButton")}
|
||||
actionLink="/tags/create"
|
||||
>
|
||||
<HeaderCreate
|
||||
path="/tags/create"
|
||||
isLoading={isLoading || isValidating}
|
||||
isAdmin={isAdmin}
|
||||
/>
|
||||
<TagsTable
|
||||
tags={tags ?? []}
|
||||
setSelectedTag={setSelectedTag}
|
||||
/>
|
||||
<Dialog
|
||||
open={isDialogOpen}
|
||||
title={t("common.dialogs.delete.title")}
|
||||
content={t("common.dialogs.delete.description")}
|
||||
onConfirm={handleConfirm}
|
||||
onCancel={handleCancel}
|
||||
loading={isDeleting}
|
||||
/>
|
||||
</BasePageWithStates>
|
||||
);
|
||||
};
|
||||
|
||||
export default TagsPage;
|
||||
@@ -1,4 +1,9 @@
|
||||
import { Table, Pagination, StatusLabel } from "@/Components/design-elements";
|
||||
import {
|
||||
Table,
|
||||
Pagination,
|
||||
StatusLabel,
|
||||
StatusCodeLabel,
|
||||
} from "@/Components/design-elements";
|
||||
import Box from "@mui/material/Box";
|
||||
import type { Header } from "@/Components/design-elements";
|
||||
import type { Check } from "@/Types/Check";
|
||||
@@ -9,7 +14,25 @@ import { formatDateWithTz } from "@/Utils/TimeUtils";
|
||||
import type { RootState } from "@/Types/state";
|
||||
import { useSelector } from "react-redux";
|
||||
|
||||
const getHeaders = (t: Function, uiTimezone: string) => {
|
||||
export const ChecksTable = ({
|
||||
checks,
|
||||
count,
|
||||
page,
|
||||
setPage,
|
||||
rowsPerPage,
|
||||
setRowsPerPage,
|
||||
}: {
|
||||
checks: Check[];
|
||||
count: number;
|
||||
page: number;
|
||||
setPage: (page: number) => void;
|
||||
rowsPerPage: number;
|
||||
setRowsPerPage: (rowsPerPage: number) => void;
|
||||
}) => {
|
||||
const navigate = useNavigate();
|
||||
const { t } = useTranslation();
|
||||
const uiTimezone = useSelector((state: RootState) => state.ui.timezone);
|
||||
|
||||
const headers: Header<Check>[] = [
|
||||
{
|
||||
id: "status",
|
||||
@@ -36,32 +59,15 @@ const getHeaders = (t: Function, uiTimezone: string) => {
|
||||
id: "statusCode",
|
||||
content: t("pages.checks.table.headers.statusCode"),
|
||||
render: (row) => {
|
||||
return row.statusCode || "N/A";
|
||||
return (
|
||||
<StatusCodeLabel
|
||||
statusCode={row.statusCode}
|
||||
message={row.message}
|
||||
/>
|
||||
);
|
||||
},
|
||||
},
|
||||
];
|
||||
return headers;
|
||||
};
|
||||
|
||||
export const ChecksTable = ({
|
||||
checks,
|
||||
count,
|
||||
page,
|
||||
setPage,
|
||||
rowsPerPage,
|
||||
setRowsPerPage,
|
||||
}: {
|
||||
checks: Check[];
|
||||
count: number;
|
||||
page: number;
|
||||
setPage: (page: number) => void;
|
||||
rowsPerPage: number;
|
||||
setRowsPerPage: (rowsPerPage: number) => void;
|
||||
}) => {
|
||||
const navigate = useNavigate();
|
||||
const { t } = useTranslation();
|
||||
const uiTimezone = useSelector((state: RootState) => state.ui.timezone);
|
||||
const headers = getHeaders(t, uiTimezone);
|
||||
|
||||
const handlePageChange = (
|
||||
_e: React.MouseEvent<HTMLButtonElement> | null,
|
||||
|
||||
@@ -1,4 +1,9 @@
|
||||
import { Table, Pagination, StatusLabel } from "@/Components/design-elements";
|
||||
import {
|
||||
Table,
|
||||
Pagination,
|
||||
StatusLabel,
|
||||
StatusCodeLabel,
|
||||
} from "@/Components/design-elements";
|
||||
import Box from "@mui/material/Box";
|
||||
import type { Header } from "@/Components/design-elements";
|
||||
import type { FlatGeoCheck } from "@/Types/GeoCheck";
|
||||
@@ -8,7 +13,24 @@ import type { RootState } from "@/Types/state";
|
||||
import { useSelector } from "react-redux";
|
||||
import prettyMilliseconds from "pretty-ms";
|
||||
|
||||
const getHeaders = (t: Function, uiTimezone: string) => {
|
||||
export const GeoChecksTable = ({
|
||||
geoChecks,
|
||||
count,
|
||||
page,
|
||||
setPage,
|
||||
rowsPerPage,
|
||||
setRowsPerPage,
|
||||
}: {
|
||||
geoChecks: FlatGeoCheck[];
|
||||
count: number;
|
||||
page: number;
|
||||
setPage: (page: number) => void;
|
||||
rowsPerPage: number;
|
||||
setRowsPerPage: (rowsPerPage: number) => void;
|
||||
}) => {
|
||||
const { t } = useTranslation();
|
||||
const uiTimezone = useSelector((state: RootState) => state.ui.timezone);
|
||||
|
||||
const headers: Header<FlatGeoCheck>[] = [
|
||||
{
|
||||
id: "status",
|
||||
@@ -29,7 +51,7 @@ const getHeaders = (t: Function, uiTimezone: string) => {
|
||||
id: "statusCode",
|
||||
content: t("pages.checks.table.headers.statusCode"),
|
||||
render: (row) => {
|
||||
return row.statusCode || "N/A";
|
||||
return <StatusCodeLabel statusCode={row.statusCode} />;
|
||||
},
|
||||
},
|
||||
{
|
||||
@@ -51,27 +73,6 @@ const getHeaders = (t: Function, uiTimezone: string) => {
|
||||
},
|
||||
},
|
||||
];
|
||||
return headers;
|
||||
};
|
||||
|
||||
export const GeoChecksTable = ({
|
||||
geoChecks,
|
||||
count,
|
||||
page,
|
||||
setPage,
|
||||
rowsPerPage,
|
||||
setRowsPerPage,
|
||||
}: {
|
||||
geoChecks: FlatGeoCheck[];
|
||||
count: number;
|
||||
page: number;
|
||||
setPage: (page: number) => void;
|
||||
rowsPerPage: number;
|
||||
setRowsPerPage: (rowsPerPage: number) => void;
|
||||
}) => {
|
||||
const { t } = useTranslation();
|
||||
const uiTimezone = useSelector((state: RootState) => state.ui.timezone);
|
||||
const headers = getHeaders(t, uiTimezone);
|
||||
|
||||
const handlePageChange = (
|
||||
_e: React.MouseEvent<HTMLButtonElement> | null,
|
||||
|
||||
@@ -6,6 +6,7 @@ import {
|
||||
type Header,
|
||||
Pagination,
|
||||
StatusLabel,
|
||||
ColoredLabel,
|
||||
} from "@/Components/design-elements";
|
||||
import { HeatmapResponseTime, HistogramResponseTime } from "@/Components/common";
|
||||
import { ActionsMenu } from "@/Components/actions-menu";
|
||||
@@ -16,13 +17,36 @@ import { useTheme } from "@mui/material/styles";
|
||||
import { useNavigate } from "react-router-dom";
|
||||
import { usePost } from "@/Hooks/UseApi";
|
||||
import { useSelector } from "react-redux";
|
||||
import useMediaQuery from "@mui/material/useMediaQuery";
|
||||
|
||||
import type { Monitor } from "@/Types/Monitor";
|
||||
import type { ActionMenuItem } from "@/Components/actions-menu";
|
||||
import type { RootState } from "@/Types/state";
|
||||
import { Checkbox } from "@/Components/inputs";
|
||||
import type { Tag } from "@/Types/Tag";
|
||||
import { SPACING } from "@/Utils/Theme/constants";
|
||||
|
||||
interface MonitorTableProps {
|
||||
monitors: Monitor[];
|
||||
tags: Tag[];
|
||||
refetch: () => void;
|
||||
setSelectedMonitor: (monitor: Monitor | null) => void;
|
||||
sortField: string;
|
||||
setSortField: (field: string) => void;
|
||||
sortOrder: "asc" | "desc";
|
||||
setSortOrder: (order: "asc" | "desc") => void;
|
||||
count: number;
|
||||
page: number;
|
||||
setPage: (page: number) => void;
|
||||
rowsPerPage: number;
|
||||
setRowsPerPage: (rowsPerPage: number) => void;
|
||||
selectedRows?: string[];
|
||||
onSelectionChange?: (selected: string[]) => void;
|
||||
}
|
||||
|
||||
export const MonitorTable = ({
|
||||
monitors,
|
||||
tags,
|
||||
refetch,
|
||||
setSelectedMonitor,
|
||||
sortField,
|
||||
@@ -34,31 +58,35 @@ export const MonitorTable = ({
|
||||
setPage,
|
||||
rowsPerPage,
|
||||
setRowsPerPage,
|
||||
}: {
|
||||
monitors: Monitor[];
|
||||
refetch: Function;
|
||||
setSelectedMonitor: (monitor: Monitor | null) => void;
|
||||
sortField: string;
|
||||
setSortField: (field: string) => void;
|
||||
sortOrder: "asc" | "desc";
|
||||
setSortOrder: (order: "asc" | "desc") => void;
|
||||
count: number;
|
||||
page: number;
|
||||
setPage: (page: number) => void;
|
||||
rowsPerPage: number;
|
||||
setRowsPerPage: (rowsPerPage: number) => void;
|
||||
}) => {
|
||||
selectedRows = [],
|
||||
onSelectionChange,
|
||||
}: MonitorTableProps) => {
|
||||
const { t } = useTranslation();
|
||||
const theme = useTheme();
|
||||
const navigate = useNavigate();
|
||||
const chartType = useSelector((state: RootState) => state.ui?.chartType ?? "histogram");
|
||||
const {
|
||||
post,
|
||||
// loading: isPosting,
|
||||
// error: postError,
|
||||
} = usePost<any, Monitor>();
|
||||
const { post } = usePost<Record<string, never>, Monitor>();
|
||||
const isSmall = useMediaQuery(theme.breakpoints.down("md"));
|
||||
|
||||
const handleSort = (e: any, field: string) => {
|
||||
const selectedSet = new Set(selectedRows);
|
||||
const isAllSelected =
|
||||
monitors.length > 0 && monitors.every((m) => selectedSet.has(m.id));
|
||||
const isSomeSelected = selectedRows.length > 0 && !isAllSelected;
|
||||
|
||||
const handleSelectAll = (checked: boolean) => {
|
||||
onSelectionChange?.(checked ? monitors.map((m) => m.id) : []);
|
||||
};
|
||||
|
||||
const handleSelectRow = (id: string, checked: boolean) => {
|
||||
if (!onSelectionChange) return;
|
||||
onSelectionChange(
|
||||
checked ? [...selectedRows, id] : selectedRows.filter((rowId) => rowId !== id)
|
||||
);
|
||||
};
|
||||
|
||||
const isRowSelected = (id: string) => selectedSet.has(id);
|
||||
|
||||
const handleSort = (e: React.MouseEvent, field: string) => {
|
||||
e.preventDefault();
|
||||
e.stopPropagation();
|
||||
if (sortField === field) {
|
||||
@@ -110,13 +138,6 @@ export const MonitorTable = ({
|
||||
navigate(`/uptime/configure/${monitor.id}`);
|
||||
},
|
||||
},
|
||||
// {
|
||||
// id: 5,
|
||||
// label: "Clone",
|
||||
// action: () => {
|
||||
|
||||
// },
|
||||
// },
|
||||
{
|
||||
id: 6,
|
||||
label:
|
||||
@@ -160,8 +181,35 @@ export const MonitorTable = ({
|
||||
</Box>
|
||||
);
|
||||
const headers: Header<Monitor>[] = [
|
||||
{
|
||||
id: "selection",
|
||||
content: (
|
||||
<Checkbox
|
||||
aria-label={t("pages.common.monitors.actions.selectAll")}
|
||||
indeterminate={isSomeSelected}
|
||||
checked={isAllSelected}
|
||||
onChange={(e) => handleSelectAll(e.target.checked)}
|
||||
/>
|
||||
),
|
||||
hideMobileLabel: true,
|
||||
render: (row) => (
|
||||
<Checkbox
|
||||
aria-label={t("pages.common.monitors.actions.selectMonitor", {
|
||||
name: row.name,
|
||||
})}
|
||||
checked={isRowSelected(row.id)}
|
||||
onChange={(e) => {
|
||||
handleSelectRow(row.id, e.target.checked);
|
||||
}}
|
||||
onClick={(e) => e.stopPropagation()}
|
||||
/>
|
||||
),
|
||||
onClick: (e) => e?.stopPropagation(),
|
||||
},
|
||||
{
|
||||
id: "name",
|
||||
align: "left",
|
||||
mobileLabel: t("common.table.headers.name"),
|
||||
content: (
|
||||
<Stack
|
||||
gap={theme.spacing(4)}
|
||||
@@ -181,6 +229,7 @@ export const MonitorTable = ({
|
||||
},
|
||||
{
|
||||
id: "status",
|
||||
mobileLabel: t("common.table.headers.status"),
|
||||
content: (
|
||||
<Stack
|
||||
gap={theme.spacing(4)}
|
||||
@@ -210,8 +259,36 @@ export const MonitorTable = ({
|
||||
}
|
||||
},
|
||||
},
|
||||
{
|
||||
id: "tags",
|
||||
content: t("common.table.headers.tags"),
|
||||
render: (row) => {
|
||||
if (row.tags.length === 0) return "-";
|
||||
|
||||
return (
|
||||
<Stack
|
||||
justifyContent={"center"}
|
||||
direction={isSmall ? "column" : "row"}
|
||||
gap={theme.spacing(SPACING.LG)}
|
||||
>
|
||||
{row.tags.map((tag) => {
|
||||
const fullTag = tags.find((t) => t.id === tag);
|
||||
if (!fullTag) return null;
|
||||
return (
|
||||
<ColoredLabel
|
||||
key={fullTag.id}
|
||||
text={fullTag.name}
|
||||
color={fullTag.color}
|
||||
/>
|
||||
);
|
||||
})}
|
||||
</Stack>
|
||||
);
|
||||
},
|
||||
},
|
||||
{
|
||||
id: "type",
|
||||
mobileLabel: t("common.table.headers.type"),
|
||||
content: (
|
||||
<Stack
|
||||
gap={theme.spacing(4)}
|
||||
@@ -251,6 +328,11 @@ export const MonitorTable = ({
|
||||
onRowClick={(row) => {
|
||||
navigate(`/uptime/${row.id}`);
|
||||
}}
|
||||
getRowSx={(row) => ({
|
||||
backgroundColor: isRowSelected(row.id)
|
||||
? theme.palette.action.selected
|
||||
: "inherit",
|
||||
})}
|
||||
/>
|
||||
<Pagination
|
||||
component="div"
|
||||
|
||||
@@ -1,14 +1,21 @@
|
||||
import { ControlsFilter, HeaderMonitorsSummary } from "@/Components/monitors";
|
||||
import { MonitorBasePageWithStates } from "@/Components/design-elements";
|
||||
import { TextField, Dialog } from "@/Components/inputs";
|
||||
import {
|
||||
ControlsFilter,
|
||||
HeaderMonitorsSummary,
|
||||
BulkActionsBar,
|
||||
} from "@/Components/monitors";
|
||||
import { MonitorBasePageWithStates, ColoredLabel } from "@/Components/design-elements";
|
||||
import { TextField, Dialog, Button } from "@/Components/inputs";
|
||||
import Stack from "@mui/material/Stack";
|
||||
import { MonitorTable } from "@/Pages/Uptime/Monitors/Components/UptimeMonitorsTable";
|
||||
import { HeaderCreate } from "@/Components/common";
|
||||
import { Play, Pause } from "lucide-react";
|
||||
import Typography from "@mui/material/Typography";
|
||||
|
||||
import { useTranslation } from "react-i18next";
|
||||
import useMediaQuery from "@mui/material/useMediaQuery";
|
||||
import { useGet, useDelete } from "@/Hooks/UseApi";
|
||||
import type { Monitor, MonitorType, MonitorsWithChecksResponse } from "@/Types/Monitor";
|
||||
import type { Tag } from "@/Types/Tag";
|
||||
import { useState, useMemo, useCallback } from "react";
|
||||
import { useSelector, useDispatch } from "react-redux";
|
||||
import { setRowsPerPage } from "@/Features/UI/uiSlice.js";
|
||||
@@ -16,6 +23,8 @@ import { useIsAdmin } from "@/Hooks/useIsAdmin";
|
||||
import type { RootState } from "@/Types/state";
|
||||
import { useTheme } from "@mui/material";
|
||||
import useDebounce from "@/Hooks/useDebounce";
|
||||
import { useBulkMonitorActions } from "@/Hooks/useBulkMonitorActions";
|
||||
import { SPACING } from "@/Utils/Theme/constants";
|
||||
|
||||
const UptimeMonitorsPage = () => {
|
||||
const { t } = useTranslation();
|
||||
@@ -32,11 +41,13 @@ const UptimeMonitorsPage = () => {
|
||||
const [selectedTypes, setSelectedTypes] = useState<MonitorType[]>([]);
|
||||
const [selectedStatus, setSelectedStatus] = useState<string>("");
|
||||
const [selectedState, setSelectedState] = useState<string>("");
|
||||
const [selectedTags, setSelectedTags] = useState<string[]>([]);
|
||||
const [page, setPage] = useState<number>(0);
|
||||
const [search, setSearch] = useState<string>("");
|
||||
const [sortField, setSortField] = useState<string>("");
|
||||
const [sortOrder, setSortOrder] = useState<"asc" | "desc">("asc");
|
||||
const [selectedMonitor, setSelectedMonitor] = useState<Monitor | null>(null);
|
||||
|
||||
const isDialogOpen = Boolean(selectedMonitor);
|
||||
|
||||
const debouncedSearch = useDebounce<string>(search, 300);
|
||||
@@ -70,12 +81,13 @@ const UptimeMonitorsPage = () => {
|
||||
const effectiveTypes =
|
||||
selectedTypes.length > 0
|
||||
? selectedTypes
|
||||
: ["http", "ping", "docker", "port", "game", "grpc", "websocket"];
|
||||
: ["http", "ping", "docker", "port", "game", "grpc", "websocket", "dns"];
|
||||
|
||||
// Build URL for monitors with checks
|
||||
const monitorsWithChecksUrl = useMemo(() => {
|
||||
const params = new URLSearchParams();
|
||||
effectiveTypes.forEach((type) => params.append("type", type));
|
||||
selectedTags.forEach((tagId) => params.append("tags", tagId));
|
||||
params.append("limit", "25");
|
||||
if (page !== undefined) params.append("page", String(page));
|
||||
if (rowsPerPage) params.append("rowsPerPage", String(rowsPerPage));
|
||||
@@ -83,7 +95,7 @@ const UptimeMonitorsPage = () => {
|
||||
if (field) params.append("field", field);
|
||||
if (sortOrder) params.append("order", sortOrder);
|
||||
return `/monitors/team/with-checks?${params.toString()}`;
|
||||
}, [effectiveTypes, page, rowsPerPage, filter, field, sortOrder]);
|
||||
}, [effectiveTypes, selectedTags, page, rowsPerPage, filter, field, sortOrder]);
|
||||
|
||||
const {
|
||||
data: monitorsWithChecksData,
|
||||
@@ -96,12 +108,23 @@ const UptimeMonitorsPage = () => {
|
||||
{ refreshInterval: 5000, keepPreviousData: true }
|
||||
);
|
||||
|
||||
const { data: tags } = useGet<Tag[]>("/tags/team");
|
||||
|
||||
const {
|
||||
monitors: monitorsWithChecks,
|
||||
summary,
|
||||
count,
|
||||
} = monitorsWithChecksData ?? { monitors: null, summary: null, count: 0 };
|
||||
|
||||
// Bulk actions
|
||||
const {
|
||||
selectedRows,
|
||||
setSelectedRows,
|
||||
handleBulkPause,
|
||||
handleBulkResume,
|
||||
handleCancelSelection,
|
||||
} = useBulkMonitorActions(refetch, page);
|
||||
|
||||
// Delete hook
|
||||
const { deleteFn, loading: isDeleting } = useDelete();
|
||||
|
||||
@@ -110,6 +133,7 @@ const UptimeMonitorsPage = () => {
|
||||
setSelectedTypes([]);
|
||||
setSelectedStatus("");
|
||||
setSelectedState("");
|
||||
setSelectedTags([]);
|
||||
setSearch("");
|
||||
}, []);
|
||||
|
||||
@@ -128,7 +152,11 @@ const UptimeMonitorsPage = () => {
|
||||
|
||||
// Check if any filters are active
|
||||
const hasActiveFilters = Boolean(
|
||||
selectedTypes.length > 0 || selectedStatus || selectedState || search
|
||||
selectedTypes.length > 0 ||
|
||||
selectedStatus ||
|
||||
selectedState ||
|
||||
selectedTags.length > 0 ||
|
||||
search
|
||||
);
|
||||
|
||||
// Show empty state only when there are truly no monitors (not just filtered out)
|
||||
@@ -167,6 +195,9 @@ const UptimeMonitorsPage = () => {
|
||||
setSelectedStatus={setSelectedStatus}
|
||||
selectedState={selectedState}
|
||||
setSelectedState={setSelectedState}
|
||||
tagOptions={tags ?? []}
|
||||
selectedTags={selectedTags}
|
||||
setSelectedTags={setSelectedTags}
|
||||
onClearFilters={handleClearFilters}
|
||||
/>
|
||||
<TextField
|
||||
@@ -177,8 +208,56 @@ const UptimeMonitorsPage = () => {
|
||||
}}
|
||||
/>
|
||||
</Stack>
|
||||
|
||||
{selectedTags.length > 0 && (
|
||||
<Stack
|
||||
direction={isSmall ? "column" : "row"}
|
||||
alignItems={isSmall ? "flex-start" : "center"}
|
||||
flexWrap="wrap"
|
||||
gap={theme.spacing(SPACING.XL)}
|
||||
>
|
||||
<Typography color={theme.palette.text.secondary}>
|
||||
{t("pages.uptime.filters.activeTags")}
|
||||
</Typography>
|
||||
{selectedTags.map((tagId) => {
|
||||
const tag = tags?.find((t) => t.id === tagId);
|
||||
if (!tag) return null;
|
||||
return (
|
||||
<ColoredLabel
|
||||
key={tag.id}
|
||||
text={tag.name}
|
||||
color={tag.color}
|
||||
/>
|
||||
);
|
||||
})}
|
||||
</Stack>
|
||||
)}
|
||||
|
||||
{!isLoading && (
|
||||
<BulkActionsBar
|
||||
selectedCount={selectedRows.length}
|
||||
onCancel={handleCancelSelection}
|
||||
>
|
||||
<Button
|
||||
size="small"
|
||||
startIcon={<Play size={16} />}
|
||||
onClick={handleBulkResume}
|
||||
>
|
||||
{t("common.buttons.resume")}
|
||||
</Button>
|
||||
<Button
|
||||
size="small"
|
||||
startIcon={<Pause size={16} />}
|
||||
onClick={handleBulkPause}
|
||||
>
|
||||
{t("common.buttons.pause")}
|
||||
</Button>
|
||||
</BulkActionsBar>
|
||||
)}
|
||||
|
||||
<MonitorTable
|
||||
monitors={monitorsWithChecks || []}
|
||||
tags={tags || []}
|
||||
refetch={refetch}
|
||||
setSelectedMonitor={setSelectedMonitor}
|
||||
count={count || 0}
|
||||
@@ -198,6 +277,8 @@ const UptimeMonitorsPage = () => {
|
||||
);
|
||||
setPage(0);
|
||||
}}
|
||||
selectedRows={selectedRows}
|
||||
onSelectionChange={setSelectedRows}
|
||||
/>
|
||||
<Dialog
|
||||
open={isDialogOpen}
|
||||
|
||||
@@ -31,9 +31,14 @@ import CreateStatus from "@/Pages/StatusPage/Create/";
|
||||
import StatusPages from "@/Pages/StatusPage/StatusPages";
|
||||
import Status from "@/Pages/StatusPage/Status";
|
||||
|
||||
// Notifications
|
||||
import Notifications from "@/Pages/Notifications";
|
||||
import CreateNotifications from "@/Pages/Notifications/create";
|
||||
|
||||
// Tags
|
||||
import Tags from "@/Pages/Tags";
|
||||
import CreateTags from "@/Pages/Tags/create";
|
||||
|
||||
// Settings
|
||||
import Account from "@/Pages/Account";
|
||||
import EditUser from "@/Pages/Account/EditUser";
|
||||
@@ -159,6 +164,19 @@ const Routes = () => {
|
||||
path="notifications/configure/:notificationId"
|
||||
element={<CreateNotifications />}
|
||||
/>
|
||||
<Route
|
||||
path="tags"
|
||||
element={<Tags />}
|
||||
/>
|
||||
<Route
|
||||
path="tags/create"
|
||||
element={<CreateTags />}
|
||||
/>
|
||||
|
||||
<Route
|
||||
path="tags/configure/:tagId"
|
||||
element={<CreateTags />}
|
||||
/>
|
||||
|
||||
<Route
|
||||
path="maintenance"
|
||||
|
||||
@@ -1,28 +1,17 @@
|
||||
export interface Diagnostics {
|
||||
osStats: OsStats;
|
||||
memoryUsage: MemoryUsage;
|
||||
cpuUsage: CpuUsage;
|
||||
v8HeapStats: V8HeapStats;
|
||||
eventLoopDelayMs: number;
|
||||
uptimeMs: number;
|
||||
mongoStats: MongoStats;
|
||||
}
|
||||
|
||||
export interface OsStats {
|
||||
freeMemoryBytes: number;
|
||||
totalMemoryBytes: number;
|
||||
}
|
||||
|
||||
export interface MemoryUsage {
|
||||
rss: number;
|
||||
heapTotal: number;
|
||||
heapUsed: number;
|
||||
external: number;
|
||||
arrayBuffers: number;
|
||||
}
|
||||
|
||||
export interface CpuUsage {
|
||||
userUsageMs: number;
|
||||
systemUsageMs: number;
|
||||
usagePercentage: number;
|
||||
}
|
||||
|
||||
@@ -31,3 +20,21 @@ export interface V8HeapStats {
|
||||
usedHeapSizeBytes: number;
|
||||
heapSizeLimitBytes: number;
|
||||
}
|
||||
|
||||
export interface MongoStats {
|
||||
readyState: number;
|
||||
host: string;
|
||||
port: number;
|
||||
dbName: string;
|
||||
totalSize: number;
|
||||
collections: CollectionStats[];
|
||||
}
|
||||
|
||||
export interface CollectionStats {
|
||||
name: string;
|
||||
documentCount: number;
|
||||
storageSize: number;
|
||||
totalIndexSize: number;
|
||||
totalSize: number;
|
||||
bucketCount?: number;
|
||||
}
|
||||
@@ -2,7 +2,7 @@ export type DurationUnit = "seconds" | "minutes" | "hours" | "days";
|
||||
|
||||
export interface MaintenanceWindow {
|
||||
id: string;
|
||||
monitorId: string;
|
||||
monitorIds: string[];
|
||||
teamId: string;
|
||||
active: boolean;
|
||||
name: string;
|
||||
|
||||
@@ -3,6 +3,8 @@ import type { PageSpeedGroupedCheck } from "@/Types/Check";
|
||||
import type { GeoContinent } from "@/Types/GeoCheck";
|
||||
export type { GeoContinent } from "@/Types/GeoCheck";
|
||||
|
||||
export const MAX_RECENT_CHECKS = 50;
|
||||
|
||||
export const MonitorTypes = [
|
||||
"http",
|
||||
"ping",
|
||||
@@ -13,10 +15,14 @@ export const MonitorTypes = [
|
||||
"game",
|
||||
"grpc",
|
||||
"websocket",
|
||||
"dns",
|
||||
"unknown",
|
||||
] as const;
|
||||
export type MonitorType = (typeof MonitorTypes)[number];
|
||||
|
||||
export const DnsRecordTypes = ["A", "AAAA", "CNAME", "MX", "TXT", "NS"] as const;
|
||||
export type DnsRecordType = (typeof DnsRecordTypes)[number];
|
||||
|
||||
export const GeoCheckSupportedTypes: readonly MonitorType[] = ["http", "ping"] as const;
|
||||
|
||||
export const supportsGeoCheck = (type: MonitorType | undefined): boolean => {
|
||||
@@ -38,6 +44,10 @@ export type MonitorStatus = (typeof MonitorStatuses)[number];
|
||||
|
||||
export type MonitorMatchMethod = "equal" | "include" | "regex" | "";
|
||||
|
||||
export const PageSpeedStrategies = ["desktop", "mobile"] as const;
|
||||
export type PageSpeedStrategy = (typeof PageSpeedStrategies)[number];
|
||||
export const DefaultPageSpeedStrategy: PageSpeedStrategy = "desktop";
|
||||
|
||||
export interface Monitor {
|
||||
id: string;
|
||||
userId: string;
|
||||
@@ -60,6 +70,7 @@ export interface Monitor {
|
||||
interval: number;
|
||||
uptimePercentage?: number;
|
||||
notifications: string[];
|
||||
tags: string[];
|
||||
secret?: string;
|
||||
cpuAlertThreshold: number;
|
||||
cpuAlertCounter: number;
|
||||
@@ -72,10 +83,13 @@ export interface Monitor {
|
||||
selectedDisks: string[];
|
||||
gameId?: string;
|
||||
grpcServiceName?: string;
|
||||
strategy?: PageSpeedStrategy;
|
||||
group: string | null;
|
||||
geoCheckEnabled?: boolean;
|
||||
geoCheckLocations?: GeoContinent[];
|
||||
geoCheckInterval?: number;
|
||||
dnsServer?: string;
|
||||
dnsRecordType?: DnsRecordType;
|
||||
recentChecks: CheckSnapshot[];
|
||||
createdAt: string;
|
||||
updatedAt: string;
|
||||
|
||||
@@ -23,6 +23,8 @@ export interface QueueJobSummary {
|
||||
monitorUrl: string | null;
|
||||
monitorType: MonitorType | null;
|
||||
monitorInterval: number | null;
|
||||
monitorGeoInterval: number | null;
|
||||
monitorActive: boolean | null;
|
||||
active: boolean;
|
||||
lockedAt: number | null;
|
||||
runCount: number;
|
||||
@@ -32,6 +34,7 @@ export interface QueueJobSummary {
|
||||
lastFinishedAt: number | null;
|
||||
lastRunTook: number | null;
|
||||
lastFailedAt: number | null;
|
||||
repeat: number | null;
|
||||
}
|
||||
|
||||
export interface QueueData {
|
||||
|
||||
@@ -0,0 +1,8 @@
|
||||
export interface Tag {
|
||||
id: string;
|
||||
teamId: string;
|
||||
name: string;
|
||||
color: string;
|
||||
createdAt: string;
|
||||
updatedAt: string;
|
||||
}
|
||||
@@ -10,6 +10,7 @@ export const getMonitorPath = (type: MonitorType): string => {
|
||||
game: "uptime",
|
||||
grpc: "uptime",
|
||||
websocket: "uptime",
|
||||
dns: "uptime",
|
||||
unknown: "uptime",
|
||||
docker: "uptime",
|
||||
hardware: "infrastructure",
|
||||
|
||||
@@ -1,3 +1,5 @@
|
||||
import { alpha } from "@mui/material/styles";
|
||||
|
||||
const typographyBase = 13;
|
||||
|
||||
export const typographyLevels = {
|
||||
@@ -17,6 +19,9 @@ export const colors = {
|
||||
gray850: "#1c1c21",
|
||||
brandGreen: "#13715B",
|
||||
brandGreenLight: "#4DAF94",
|
||||
green200: "#ECF7F2",
|
||||
yellow200: "#FFF4E5",
|
||||
orange500: "#FFA500",
|
||||
};
|
||||
|
||||
export const lightPalette = {
|
||||
@@ -29,6 +34,10 @@ export const lightPalette = {
|
||||
sidebar: {
|
||||
accent: colors.brandGreen,
|
||||
},
|
||||
rowStatus: {
|
||||
running: colors.green200,
|
||||
paused: colors.yellow200,
|
||||
},
|
||||
};
|
||||
|
||||
export const darkPalette = {
|
||||
@@ -45,4 +54,8 @@ export const darkPalette = {
|
||||
sidebar: {
|
||||
accent: colors.brandGreenLight,
|
||||
},
|
||||
rowStatus: {
|
||||
running: alpha(colors.brandGreen, 0.18),
|
||||
paused: alpha(colors.orange500, 0.18),
|
||||
},
|
||||
};
|
||||
@@ -15,9 +15,11 @@ declare module "@mui/material/styles" {
|
||||
}
|
||||
interface Palette {
|
||||
sidebar: { accent: string };
|
||||
rowStatus: { running: string; paused: string };
|
||||
}
|
||||
interface PaletteOptions {
|
||||
sidebar?: { accent: string };
|
||||
rowStatus?: { running: string; paused: string };
|
||||
}
|
||||
}
|
||||
|
||||
|
||||
@@ -1,4 +1,5 @@
|
||||
export const SPACING = {
|
||||
XXS: 0.25,
|
||||
XS: 0.5,
|
||||
SM: 1,
|
||||
MD: 1.5,
|
||||
|
||||
@@ -15,12 +15,30 @@ export const MS_PER_HOUR = 60 * MS_PER_MINUTE;
|
||||
export const MS_PER_DAY = 24 * MS_PER_HOUR;
|
||||
export const MS_PER_WEEK = MS_PER_DAY * 7;
|
||||
|
||||
export const formatDateWithTz = (timestamp: string, format: string, timezone: string) => {
|
||||
const resolveSystemTimezone = (): string => {
|
||||
try {
|
||||
return Intl.DateTimeFormat().resolvedOptions().timeZone || "UTC";
|
||||
} catch {
|
||||
return "UTC";
|
||||
}
|
||||
};
|
||||
|
||||
export const SYSTEM_TIMEZONE = resolveSystemTimezone();
|
||||
|
||||
export const resolveTimezone = (preferred?: string | null): string =>
|
||||
preferred?.trim() || SYSTEM_TIMEZONE;
|
||||
|
||||
export const formatDateWithTz = (
|
||||
timestamp: string,
|
||||
format: string,
|
||||
timezone?: string
|
||||
) => {
|
||||
if (!timestamp) {
|
||||
return "Unknown time";
|
||||
}
|
||||
const tz = resolveTimezone(timezone);
|
||||
try {
|
||||
return dayjs(timestamp).tz(timezone).format(format);
|
||||
return dayjs(timestamp).tz(tz).format(format);
|
||||
} catch {
|
||||
return dayjs(timestamp).utc().format(format);
|
||||
}
|
||||
|
||||
@@ -0,0 +1,76 @@
|
||||
import type { ValueType } from "@/Components/design-elements/StatusLabel";
|
||||
|
||||
export const NETWORK_ERROR_CODE = 5000;
|
||||
|
||||
export const NETWORK_ERROR_SUBTYPES = [
|
||||
"timeout",
|
||||
"dns",
|
||||
"refused",
|
||||
"tls",
|
||||
"reset",
|
||||
"unknown",
|
||||
] as const;
|
||||
export type NetworkErrorSubtype = (typeof NETWORK_ERROR_SUBTYPES)[number];
|
||||
|
||||
type TranslateFn = (key: string) => string;
|
||||
|
||||
export const isNetworkError = (code?: number | null): boolean =>
|
||||
code === NETWORK_ERROR_CODE;
|
||||
|
||||
const ERROR_CODE_PATTERN =
|
||||
/\b(E[A-Z_]{2,}|CERT_[A-Z_]+|UNABLE_TO_VERIFY[A-Z_]*|DEPTH_ZERO_SELF_SIGNED[A-Z_]*|SELF_SIGNED[A-Z_]*)\b/;
|
||||
|
||||
export const extractErrorCode = (message?: string | null): string | null => {
|
||||
if (!message) return null;
|
||||
const match = message.match(ERROR_CODE_PATTERN);
|
||||
return match ? match[1] : null;
|
||||
};
|
||||
|
||||
export const getNetworkErrorSubtype = (message?: string | null): NetworkErrorSubtype => {
|
||||
if (!message) return "unknown";
|
||||
const m = message.toUpperCase();
|
||||
if (m.includes("ETIMEDOUT") || m.includes("TIMEOUT") || m.includes("ESOCKETTIMEDOUT"))
|
||||
return "timeout";
|
||||
if (m.includes("ENOTFOUND") || m.includes("EAI_AGAIN") || m.includes("DNS"))
|
||||
return "dns";
|
||||
if (m.includes("ECONNREFUSED")) return "refused";
|
||||
if (
|
||||
m.includes("CERT_") ||
|
||||
m.includes("UNABLE_TO_VERIFY") ||
|
||||
m.includes("DEPTH_ZERO_SELF_SIGNED") ||
|
||||
m.includes("SELF_SIGNED") ||
|
||||
m.includes("TLS") ||
|
||||
m.includes("SSL")
|
||||
)
|
||||
return "tls";
|
||||
if (m.includes("ECONNRESET")) return "reset";
|
||||
return "unknown";
|
||||
};
|
||||
|
||||
export const formatStatusCode = (
|
||||
code: number | null | undefined,
|
||||
t: TranslateFn
|
||||
): string => {
|
||||
if (isNetworkError(code)) return t("common.statusCode.down");
|
||||
return String(code);
|
||||
};
|
||||
|
||||
export const getStatusCodeTooltip = (
|
||||
code: number | null | undefined,
|
||||
message: string | null | undefined,
|
||||
t: TranslateFn
|
||||
): string | null => {
|
||||
if (!isNetworkError(code)) return null;
|
||||
const description = t(
|
||||
`common.statusCode.networkError.${getNetworkErrorSubtype(message)}`
|
||||
);
|
||||
const errorCode = extractErrorCode(message);
|
||||
return errorCode ? `${description} (${errorCode})` : description;
|
||||
};
|
||||
|
||||
export const getStatusCodeValueType = (code: number): ValueType => {
|
||||
if (isNetworkError(code)) return "negative";
|
||||
if (code < 300) return "positive";
|
||||
if (code < 400) return "neutral";
|
||||
return "negative";
|
||||
};
|
||||
@@ -14,30 +14,32 @@ export const durationUnitOptions = [
|
||||
{ id: "days", name: "days", multiplier: 86400000 },
|
||||
] as const;
|
||||
|
||||
export const maintenanceWindowSchema = z
|
||||
.object({
|
||||
name: z
|
||||
.string()
|
||||
.min(1, "Name is required")
|
||||
.max(100, "Name must be at most 100 characters"),
|
||||
repeat: z.string(),
|
||||
startDate: z.string().min(1, "Start date is required"),
|
||||
startTime: z.string().min(1, "Start time is required"),
|
||||
duration: z.number().int().min(1, "Duration must be at least 1"),
|
||||
durationUnit: z.string(),
|
||||
monitors: z.array(z.string()).min(1, "At least one monitor is required"),
|
||||
})
|
||||
.refine(
|
||||
(data) => {
|
||||
const startDateTime = dayjs(data.startDate)
|
||||
.set("hour", parseInt(data.startTime.split(":")[0], 10))
|
||||
.set("minute", parseInt(data.startTime.split(":")[1], 10));
|
||||
return startDateTime.isAfter(dayjs());
|
||||
},
|
||||
{
|
||||
message: "Start date and time must be in the future",
|
||||
path: ["startDate"],
|
||||
}
|
||||
);
|
||||
const maintenanceWindowBaseSchema = z.object({
|
||||
name: z
|
||||
.string()
|
||||
.min(1, "Name is required")
|
||||
.max(100, "Name must be at most 100 characters"),
|
||||
repeat: z.string(),
|
||||
startDate: z.string().min(1, "Start date is required"),
|
||||
startTime: z.string().min(1, "Start time is required"),
|
||||
duration: z.number().int().min(1, "Duration must be at least 1"),
|
||||
durationUnit: z.string(),
|
||||
monitors: z.array(z.string()).min(1, "At least one monitor is required"),
|
||||
});
|
||||
|
||||
export const maintenanceWindowSchema = maintenanceWindowBaseSchema.refine(
|
||||
(data) => {
|
||||
const startDateTime = dayjs(data.startDate)
|
||||
.set("hour", parseInt(data.startTime.split(":")[0], 10))
|
||||
.set("minute", parseInt(data.startTime.split(":")[1], 10));
|
||||
return startDateTime.isAfter(dayjs());
|
||||
},
|
||||
{
|
||||
message: "Start date and time must be in the future",
|
||||
path: ["startDate"],
|
||||
}
|
||||
);
|
||||
|
||||
export const maintenanceWindowEditSchema = maintenanceWindowBaseSchema;
|
||||
|
||||
export type MaintenanceWindowFormData = z.infer<typeof maintenanceWindowSchema>;
|
||||
@@ -1,5 +1,12 @@
|
||||
import { z } from "zod";
|
||||
import type { FieldPath } from "react-hook-form";
|
||||
import { GeoContinents } from "@/Types/GeoCheck";
|
||||
import { DnsRecordTypes, PageSpeedStrategies, type MonitorType } from "@/Types/Monitor";
|
||||
|
||||
// Wizard step a field is validated on. Attached inline to each field below so
|
||||
// the grouping lives next to the field definition; unannotated fields default
|
||||
// to step 0. Read via `stepFieldsFor`.
|
||||
export const monitorStepRegistry = z.registry<{ step: number }>();
|
||||
|
||||
// URL schema with custom error message
|
||||
const urlSchema = z.url({ message: "Please enter a valid URL" });
|
||||
@@ -11,39 +18,60 @@ const baseSchema = z.object({
|
||||
.min(1, "Monitor name is required")
|
||||
.max(50, "Monitor name must be at most 50 characters"),
|
||||
description: z.string().optional(),
|
||||
interval: z.number().min(15000, "Interval must be at least 15 seconds"),
|
||||
notifications: z.array(z.string()),
|
||||
interval: z
|
||||
.number()
|
||||
.min(15000, "Interval must be at least 15 seconds")
|
||||
.register(monitorStepRegistry, { step: 1 }),
|
||||
notifications: z.array(z.string()).register(monitorStepRegistry, { step: 1 }),
|
||||
tags: z.array(z.string()).register(monitorStepRegistry, { step: 1 }),
|
||||
statusWindowSize: z
|
||||
.number({ message: "Status window size is required" })
|
||||
.min(1, "Status window size must be at least 1")
|
||||
.max(25, "Status window size must be at most 25"),
|
||||
.max(25, "Status window size must be at most 25")
|
||||
.register(monitorStepRegistry, { step: 1 }),
|
||||
statusWindowThreshold: z
|
||||
.number({ message: "Threshold percentage is required" })
|
||||
.min(1, "Incident percentage must be at least 1")
|
||||
.max(100, "Incident percentage must be at most 100"),
|
||||
geoCheckEnabled: z.boolean().optional(),
|
||||
geoCheckLocations: z.array(z.enum(GeoContinents)).optional(),
|
||||
.max(100, "Incident percentage must be at most 100")
|
||||
.register(monitorStepRegistry, { step: 1 }),
|
||||
});
|
||||
|
||||
// Geo-distributed check fields. Only http and ping support geo checks
|
||||
// (GeoCheckSupportedTypes), so these live on those schemas rather than the base
|
||||
// — that way each type's step count is exactly what its own fields declare.
|
||||
const geoCheckFields = {
|
||||
geoCheckEnabled: z.boolean().optional().register(monitorStepRegistry, { step: 2 }),
|
||||
geoCheckLocations: z
|
||||
.array(z.enum(GeoContinents))
|
||||
.optional()
|
||||
.register(monitorStepRegistry, { step: 2 }),
|
||||
geoCheckInterval: z
|
||||
.number()
|
||||
.min(300000, "Interval must be at least 5 minutes")
|
||||
.optional(),
|
||||
});
|
||||
.optional()
|
||||
.register(monitorStepRegistry, { step: 2 }),
|
||||
};
|
||||
|
||||
// HTTP monitor schema
|
||||
const httpSchema = baseSchema.extend({
|
||||
type: z.literal("http"),
|
||||
url: urlSchema,
|
||||
ignoreTlsErrors: z.boolean(),
|
||||
useAdvancedMatching: z.boolean(),
|
||||
matchMethod: z.enum(["equal", "include", "regex", ""]).optional(),
|
||||
expectedValue: z.string().optional(),
|
||||
jsonPath: z.string().optional(),
|
||||
ignoreTlsErrors: z.boolean().register(monitorStepRegistry, { step: 2 }),
|
||||
useAdvancedMatching: z.boolean().register(monitorStepRegistry, { step: 2 }),
|
||||
matchMethod: z
|
||||
.enum(["equal", "include", "regex", ""])
|
||||
.optional()
|
||||
.register(monitorStepRegistry, { step: 2 }),
|
||||
expectedValue: z.string().optional().register(monitorStepRegistry, { step: 2 }),
|
||||
jsonPath: z.string().optional().register(monitorStepRegistry, { step: 2 }),
|
||||
...geoCheckFields,
|
||||
});
|
||||
|
||||
// Ping monitor schema
|
||||
const pingSchema = baseSchema.extend({
|
||||
type: z.literal("ping"),
|
||||
url: z.string().min(1, "Host is required"),
|
||||
...geoCheckFields,
|
||||
});
|
||||
|
||||
// Port monitor schema
|
||||
@@ -82,13 +110,14 @@ const grpcSchema = baseSchema.extend({
|
||||
.min(1, "Port must be at least 1")
|
||||
.max(65535, "Port must be at most 65535"),
|
||||
grpcServiceName: z.string().optional(),
|
||||
ignoreTlsErrors: z.boolean(),
|
||||
ignoreTlsErrors: z.boolean().register(monitorStepRegistry, { step: 2 }),
|
||||
});
|
||||
|
||||
// PageSpeed monitor schema
|
||||
const pagespeedSchema = baseSchema.extend({
|
||||
type: z.literal("pagespeed"),
|
||||
url: urlSchema,
|
||||
strategy: z.enum(PageSpeedStrategies),
|
||||
});
|
||||
|
||||
// Hardware/Infrastructure monitor schema
|
||||
@@ -119,7 +148,30 @@ const hardwareSchema = baseSchema.extend({
|
||||
const websocketSchema = baseSchema.extend({
|
||||
type: z.literal("websocket"),
|
||||
url: z.string().min(1, "WebSocket URL is required"),
|
||||
ignoreTlsErrors: z.boolean(),
|
||||
ignoreTlsErrors: z.boolean().register(monitorStepRegistry, { step: 2 }),
|
||||
});
|
||||
|
||||
// Hostname (FQDN) — labels of 1-63 alphanumerics/hyphens separated by dots,
|
||||
// optionally prefixed with `_` for service labels (e.g. _dmarc, _imaps._tcp).
|
||||
// No scheme, port, path, or whitespace. Total length ≤ 253.
|
||||
const hostnameRegex =
|
||||
/^(?=.{1,253}$)([a-zA-Z0-9_](?:[a-zA-Z0-9-]{0,61}[a-zA-Z0-9])?\.)+[a-zA-Z]{2,63}$/;
|
||||
|
||||
// DNS monitor schema
|
||||
const dnsSchema = baseSchema.extend({
|
||||
type: z.literal("dns"),
|
||||
url: z
|
||||
.string()
|
||||
.min(1, "Domain is required")
|
||||
.regex(hostnameRegex, "Enter a valid domain (e.g. www.example.com)"),
|
||||
dnsServer: z
|
||||
.string()
|
||||
.min(1, "DNS server is required")
|
||||
.refine(
|
||||
(v) => z.ipv4().safeParse(v).success || z.ipv6().safeParse(v).success,
|
||||
"Enter a valid IPv4 or IPv6 address (e.g. 8.8.8.8)"
|
||||
),
|
||||
dnsRecordType: z.enum(DnsRecordTypes),
|
||||
});
|
||||
|
||||
// Discriminated union of all monitor types
|
||||
@@ -133,10 +185,39 @@ export const monitorSchema = z.discriminatedUnion("type", [
|
||||
pagespeedSchema,
|
||||
hardwareSchema,
|
||||
websocketSchema,
|
||||
dnsSchema,
|
||||
]);
|
||||
|
||||
export type MonitorFormData = z.infer<typeof monitorSchema>;
|
||||
|
||||
const optionForType = (type: MonitorType) =>
|
||||
monitorSchema.options.find((o) => o.shape.type.value === type);
|
||||
|
||||
// The step each field of a type is validated on, from the per-field
|
||||
// `monitorStepRegistry` metadata (unannotated fields default to step 0).
|
||||
const fieldStepsFor = (
|
||||
type: MonitorType
|
||||
): [name: FieldPath<MonitorFormData>, step: number][] =>
|
||||
Object.entries(optionForType(type)?.shape ?? {}).map(([name, field]) => [
|
||||
name as FieldPath<MonitorFormData>,
|
||||
monitorStepRegistry.get(field)?.step ?? 0,
|
||||
]);
|
||||
|
||||
// The selected type's fields that belong to a given wizard step. Derived from
|
||||
// the schema so it can't drift from the field definitions.
|
||||
export const stepFieldsFor = (
|
||||
type: MonitorType,
|
||||
step: number
|
||||
): FieldPath<MonitorFormData>[] =>
|
||||
fieldStepsFor(type)
|
||||
.filter(([, fieldStep]) => fieldStep === step)
|
||||
.map(([name]) => name);
|
||||
|
||||
// Number of wizard steps a type has, derived from the highest step its fields
|
||||
// declare. A type with no step-2 fields is a 2-step form, and so on.
|
||||
export const monitorStepCount = (type: MonitorType): number =>
|
||||
Math.max(0, ...fieldStepsFor(type).map(([, step]) => step)) + 1;
|
||||
|
||||
// Type-specific schemas exported for individual use
|
||||
export {
|
||||
httpSchema,
|
||||
|
||||
@@ -0,0 +1,10 @@
|
||||
import { z } from "zod";
|
||||
|
||||
export const tagSchema = z.object({
|
||||
name: z.string().min(1, "Please enter a tag name"),
|
||||
color: z
|
||||
.string()
|
||||
.regex(/^#([0-9a-fA-F]{6})$/, "Color must be a 6-digit hex value (e.g. #13715B)"),
|
||||
});
|
||||
|
||||
export type TagFormData = z.infer<typeof tagSchema>;
|
||||
+160
-44
@@ -73,7 +73,9 @@
|
||||
"paused": "متوقف مؤقتاً",
|
||||
"na": "غير متوفر",
|
||||
"resolved": "تم الحل",
|
||||
"responseTime": "وقت الاستجابة"
|
||||
"responseTime": "وقت الاستجابة",
|
||||
"idle": "خامل",
|
||||
"running": "قيد التشغيل"
|
||||
},
|
||||
"form": {
|
||||
"role": {
|
||||
@@ -120,6 +122,17 @@
|
||||
"active": "نشط",
|
||||
"responseTime": "وقت الاستجابة"
|
||||
}
|
||||
},
|
||||
"statusCode": {
|
||||
"down": "متوقف",
|
||||
"networkError": {
|
||||
"dns": "تعذر تحليل اسم المضيف (فشل بحث DNS).",
|
||||
"refused": "رفض الخادم الاتصال (المنفذ مغلق أو الخدمة لا تستمع).",
|
||||
"reset": "تمت إعادة تعيين الاتصال قبل تلقي استجابة.",
|
||||
"timeout": "لم يستجب الخادم في الوقت المحدد (انتهت مهلة الطلب).",
|
||||
"tls": "فشل تأكيد اتصال TLS أو SSL (مشكلة في الشهادة أو التشفير).",
|
||||
"unknown": "لم يتم تلقي أي استجابة HTTP من الهدف."
|
||||
}
|
||||
}
|
||||
},
|
||||
"components": {
|
||||
@@ -306,28 +319,28 @@
|
||||
"common": {
|
||||
"passwordRules": {
|
||||
"length": {
|
||||
"beginning": "",
|
||||
"highlighted": ""
|
||||
"beginning": "يجب أن يكون على الأقل",
|
||||
"highlighted": "8 أحرف"
|
||||
},
|
||||
"lowercase": {
|
||||
"beginning": "",
|
||||
"highlighted": ""
|
||||
"beginning": "يجب أن يحتوي على الأقل على",
|
||||
"highlighted": "حرف صغير واحد"
|
||||
},
|
||||
"match": {
|
||||
"beginning": "",
|
||||
"highlighted": ""
|
||||
"beginning": "كلمات المرور",
|
||||
"highlighted": "يجب أن تتطابق"
|
||||
},
|
||||
"number": {
|
||||
"beginning": "",
|
||||
"highlighted": ""
|
||||
"beginning": "يجب أن يحتوي على الأقل على",
|
||||
"highlighted": "رقم واحد"
|
||||
},
|
||||
"special": {
|
||||
"beginning": "",
|
||||
"highlighted": ""
|
||||
"beginning": "يجب أن يحتوي على الأقل على",
|
||||
"highlighted": "حرف خاص واحد (!?@#$%^&*()-_=+[]{}|;:'\",./\\~`)"
|
||||
},
|
||||
"uppercase": {
|
||||
"beginning": "",
|
||||
"highlighted": ""
|
||||
"beginning": "يجب أن يحتوي على الأقل على",
|
||||
"highlighted": "حرف كبير واحد"
|
||||
}
|
||||
},
|
||||
"form": {
|
||||
@@ -421,7 +434,11 @@
|
||||
"inviteMember": "دعوة عضو",
|
||||
"openSite": "فتح الموقع",
|
||||
"pause": "إيقاف مؤقت",
|
||||
"resume": "استئناف"
|
||||
"resume": "استئناف",
|
||||
"selectAll": "تحديد جميع الشاشات",
|
||||
"selectMonitor": "تحديد {{name}}",
|
||||
"bulkSelected_one": "{{count}} شاشة محددة",
|
||||
"bulkSelected_other": "{{count}} شاشات محددة"
|
||||
},
|
||||
"statBoxes": {
|
||||
"activeFor": "نشط منذ",
|
||||
@@ -448,7 +465,19 @@
|
||||
"optionPagespeed": "PageSpeed",
|
||||
"optionHardware": "البنية التحتية",
|
||||
"optionGrpc": "gRPC",
|
||||
"optionWebSocket": "WebSocket"
|
||||
"optionWebSocket": "WebSocket",
|
||||
"optionDns": "DNS"
|
||||
},
|
||||
"bulkPause": {
|
||||
"paused_one": "تم إيقاف {{count}} شاشة مؤقتاً",
|
||||
"paused_other": "تم إيقاف {{count}} شاشات مؤقتاً",
|
||||
"resumed_one": "تم استئناف {{count}} شاشة",
|
||||
"resumed_other": "تم استئناف {{count}} شاشات",
|
||||
"alreadyPaused_one": "الشاشة المحددة متوقفة مؤقتاً بالفعل",
|
||||
"alreadyPaused_other": "جميع الشاشات المحددة متوقفة مؤقتاً بالفعل",
|
||||
"alreadyRunning_one": "الشاشة المحددة قيد التشغيل بالفعل",
|
||||
"alreadyRunning_other": "جميع الشاشات المحددة قيد التشغيل بالفعل",
|
||||
"partialFailure": "تم تحديث {{successCount}} من أجهزة المراقبة، ولكن فشلت مزامنة {{failedCount}} مع قائمة انتظار الوظائف"
|
||||
}
|
||||
}
|
||||
},
|
||||
@@ -469,9 +498,9 @@
|
||||
},
|
||||
"matchMethod": {
|
||||
"label": "طريقة المطابقة",
|
||||
"equal": "",
|
||||
"include": "",
|
||||
"regex": ""
|
||||
"equal": "يساوي",
|
||||
"include": "يحتوي",
|
||||
"regex": "تعبير عادي"
|
||||
}
|
||||
},
|
||||
"title": "إعدادات متقدمة"
|
||||
@@ -483,15 +512,15 @@
|
||||
"label": "تكرار الفحص",
|
||||
"value": {
|
||||
"fifteenMinutes": "15 دقيقة",
|
||||
"fifteenSeconds": "",
|
||||
"fifteenSeconds": "15 ثانية",
|
||||
"fiveMinutes": "5 دقائق",
|
||||
"fourMinutes": "",
|
||||
"oneMinute": "",
|
||||
"fourMinutes": "4 دقائق",
|
||||
"oneMinute": "دقيقة واحدة",
|
||||
"tenMinutes": "10 دقائق",
|
||||
"thirtyMinutes": "30 دقيقة",
|
||||
"thirtySeconds": "",
|
||||
"threeMinutes": "",
|
||||
"twoMinutes": ""
|
||||
"thirtySeconds": "30 ثانية",
|
||||
"threeMinutes": "3 دقائق",
|
||||
"twoMinutes": "دقيقتان"
|
||||
}
|
||||
}
|
||||
},
|
||||
@@ -520,8 +549,8 @@
|
||||
"placeholder": "https://www.google.com"
|
||||
},
|
||||
"game": {
|
||||
"label": "",
|
||||
"placeholder": ""
|
||||
"label": "اختر اللعبة",
|
||||
"placeholder": "حدد لعبة"
|
||||
},
|
||||
"port": {
|
||||
"label": "المنفذ المراد مراقبته",
|
||||
@@ -534,19 +563,44 @@
|
||||
"wsUrl": {
|
||||
"label": "رابط WebSocket",
|
||||
"placeholder": "wss://example.com/socket"
|
||||
},
|
||||
"captureUrl": {
|
||||
"label": "نقطة نهاية Capture",
|
||||
"placeholder": "http://192.168.1.10:5001/api/v1/metrics"
|
||||
},
|
||||
"dnsRecordType": {
|
||||
"label": "نوع سجل DNS",
|
||||
"value": {
|
||||
"A": "A",
|
||||
"AAAA": "AAAA",
|
||||
"CNAME": "CNAME",
|
||||
"MX": "MX",
|
||||
"NS": "NS",
|
||||
"TXT": "TXT"
|
||||
}
|
||||
},
|
||||
"dnsServer": {
|
||||
"label": "خادم DNS",
|
||||
"placeholder": "8.8.8.8"
|
||||
},
|
||||
"strategy": {
|
||||
"desktop": "سطح المكتب",
|
||||
"label": "الاستراتيجية",
|
||||
"mobile": "الجوال"
|
||||
}
|
||||
},
|
||||
"title": "الإعدادات العامة",
|
||||
"description": {
|
||||
"http": "أدخل الرابط أو عنوان IP للمراقبة (مثال: https://example.com/ أو 192.168.1.100) وأضف اسم عرض واضح يظهر في لوحة التحكم.",
|
||||
"ping": "",
|
||||
"port": "",
|
||||
"docker": "",
|
||||
"ping": "أدخل عنوان IP أو اسم المضيف للاتصال (على سبيل المثال، 192.168.1.100 أو example.com) وأضف اسماً واضحاً يظهر في لوحة المعلومات.",
|
||||
"port": "أدخل عنوان URL أو IP للخادم ورقم المنفذ واسماً واضحاً يظهر في لوحة المعلومات.",
|
||||
"docker": "أدخل اسم حاوية Docker أو المعرف. يمكنك استخدام اسم الحاوية (مثل my-app) أو معرف الحاوية (معرف كامل 64 حرف أو معرف قصير).",
|
||||
"game": "أدخل عنوان IP أو اسم المضيف ورقم المنفذ للاختبار (مثل 192.168.1.100 أو example.com) واختر نوع اللعبة. تتطلب بعض الألعاب تفعيل استعلامات الخادم في ملف الإعدادات الخاص بها — يُرجى مراجعة وثائق خادم اللعبة. اطّلع على <gamedigLink>قائمة الألعاب المدعومة</gamedigLink> لمعرفة تفاصيل البروتوكول.",
|
||||
"pagespeed": "تتبع أداء تحميل الصفحة ومؤشرات Core Web Vitals ودرجات التحسين لموقعك.",
|
||||
"grpc": "أدخل اسم المضيف ومنفذ خادم gRPC، وحدد اختيارياً اسم خدمة لفحص الصحة، وأضف اسم عرض.",
|
||||
"websocket": "أدخل رابط WebSocket للمراقبة (مثال: wss://example.com/socket) وأضف اسم عرض.",
|
||||
"hardware": "مراقبة استخدام CPU والذاكرة والقرص ودرجة الحرارة للبنية التحتية الخاصة بك."
|
||||
"hardware": "راقب استخدام وحدة المعالجة المركزية والذاكرة والقرص ودرجة الحرارة لبنيتك التحتية. يجب أن يتضمن عنوان URL لنقطة نهاية Capture المسار الكامل /api/v1/metrics (مثال: http://192.168.1.10:5001/api/v1/metrics). بالنسبة لمفتاح التفويض، الصق سلسلة الرمز فقط — لا تُضمّن كلمة 'Bearer'.",
|
||||
"dns": "راقب ما إذا كان خادم DNS محدد يستجيب."
|
||||
}
|
||||
},
|
||||
"ignoreTls": {
|
||||
@@ -583,7 +637,8 @@
|
||||
"optionHttpDescription": "استخدم HTTP(S) لمراقبة موقعك الإلكتروني أو نقطة نهاية API.",
|
||||
"optionPingDescription": "استخدم ICMP Ping لمراقبة ما إذا كان الخادم متصلاً.",
|
||||
"optionPortDescription": "مراقبة ما إذا كان منفذ معين على الخادم مفتوحاً.",
|
||||
"title": "النوع"
|
||||
"title": "النوع",
|
||||
"optionDnsDescription": "راقب ما إذا كان خادم DNS محدد يستجيب."
|
||||
},
|
||||
"thresholds": {
|
||||
"title": "حدود التنبيه",
|
||||
@@ -747,7 +802,7 @@
|
||||
"headers": {
|
||||
"endTime": "وقت الانتهاء",
|
||||
"resolutionType": "نوع الحل",
|
||||
"startTime": "",
|
||||
"startTime": "وقت البدء",
|
||||
"statusCode": "رمز الحالة"
|
||||
},
|
||||
"resolvedIncidents": "الحوادث المحلولة",
|
||||
@@ -791,13 +846,13 @@
|
||||
}
|
||||
},
|
||||
"statBoxes": {
|
||||
"avgCpuTemperature": "",
|
||||
"cpuFrequency": "",
|
||||
"cpuLogical": "",
|
||||
"cpuPhysical": "",
|
||||
"avgCpuTemperature": "متوسط درجة حرارة المعالج",
|
||||
"cpuFrequency": "تردد المعالج",
|
||||
"cpuLogical": "المعالج (المنطقي)",
|
||||
"cpuPhysical": "المعالج (الفعلي)",
|
||||
"disk": "القرص",
|
||||
"memory": "الذاكرة",
|
||||
"os": ""
|
||||
"os": "نظام التشغيل"
|
||||
},
|
||||
"table": {
|
||||
"headers": {
|
||||
@@ -808,7 +863,7 @@
|
||||
},
|
||||
"tabs": {
|
||||
"labels": {
|
||||
"network": "",
|
||||
"network": "الشبكة",
|
||||
"overview": "نظرة عامة"
|
||||
}
|
||||
},
|
||||
@@ -891,7 +946,8 @@
|
||||
"lastFinishedAt": "آخر انتهاء في",
|
||||
"lastRunTook": "مدة آخر تشغيل",
|
||||
"lastFailedAt": "آخر فشل في",
|
||||
"failReason": "سبب الفشل"
|
||||
"failReason": "سبب الفشل",
|
||||
"state": "الحالة"
|
||||
}
|
||||
},
|
||||
"queueFallback": {
|
||||
@@ -911,8 +967,8 @@
|
||||
},
|
||||
"table": {
|
||||
"headers": {
|
||||
"nextWindow": "",
|
||||
"repeat": ""
|
||||
"nextWindow": "النافذة التالية",
|
||||
"repeat": "تكرار"
|
||||
}
|
||||
},
|
||||
"form": {
|
||||
@@ -1014,7 +1070,7 @@
|
||||
},
|
||||
"telegram": {
|
||||
"title": "تهيئة Telegram",
|
||||
"description": "",
|
||||
"description": "قم بتكوين بوت Telegram الخاص بك لإرسال الإشعارات.",
|
||||
"optionBotToken": "رمز البوت",
|
||||
"placeholderBotToken": "123456789:ABCdefGhIJKlmNoPQRsTUVwxyZ",
|
||||
"optionChatId": "معرّف المحادثة",
|
||||
@@ -1081,6 +1137,10 @@
|
||||
"header": {
|
||||
"title": "مراقبات PageSpeed",
|
||||
"description": "تابع Core Web Vitals ودرجات Lighthouse عبر الزمن لاكتشاف التراجع قبل أن يلاحظه المستخدمون."
|
||||
},
|
||||
"strategy": {
|
||||
"desktop": "سطح المكتب",
|
||||
"mobile": "الجوال"
|
||||
}
|
||||
},
|
||||
"settings": {
|
||||
@@ -1183,7 +1243,7 @@
|
||||
"email": {
|
||||
"title": "إعدادات البريد الإلكتروني",
|
||||
"description": "تهيئة إعدادات البريد الإلكتروني لنظامك. يُستخدم لإرسال الإشعارات والتنبيهات.",
|
||||
"descriptionTransport": "",
|
||||
"descriptionTransport": "هذا يبني نقل SMTP لـ NodeMailer",
|
||||
"descriptionTransportLink": "اطلع على المواصفات هنا",
|
||||
"option": {
|
||||
"host": {
|
||||
@@ -1229,6 +1289,10 @@
|
||||
},
|
||||
"rejectUnauthorized": {
|
||||
"label": "رفض الشهادات غير الصالحة: رفض الاتصالات ذات الشهادات الموقعة ذاتياً أو غير الموثوقة"
|
||||
},
|
||||
"displayName": {
|
||||
"label": "اسم المرسل (اختياري) - الاسم الودي المعروض في حقل المرسل",
|
||||
"placeholder": "إشعارات Checkmate"
|
||||
}
|
||||
}
|
||||
},
|
||||
@@ -1289,6 +1353,20 @@
|
||||
"uptime": {
|
||||
"title": "وقت التشغيل",
|
||||
"responseTime": "وقت الاستجابة"
|
||||
},
|
||||
"chart": {
|
||||
"avg": "متوسط {{value}} مللي ثانية",
|
||||
"downTooltip": "متوقف",
|
||||
"heatmapAria": "خريطة حرارية لزمن الاستجابة",
|
||||
"max": "أقصى {{value}} مللي ثانية"
|
||||
},
|
||||
"status": {
|
||||
"breached": "تم تجاوز الحد",
|
||||
"down": "متوقف",
|
||||
"initializing": "قيد التهيئة",
|
||||
"maintenance": "صيانة",
|
||||
"paused": "متوقف مؤقتاً",
|
||||
"up": "قيد التشغيل"
|
||||
}
|
||||
},
|
||||
"statusBar": {
|
||||
@@ -1306,7 +1384,9 @@
|
||||
"maintenance": "بعض الأنظمة قيد الصيانة",
|
||||
"partiallyPaused": "بعض الأنظمة متوقفة مؤقتًا",
|
||||
"initializing": "بعض الأنظمة قيد التهيئة",
|
||||
"noMonitors": "لم يتم تكوين أي شاشة"
|
||||
"noMonitors": "لم يتم تكوين أي شاشة",
|
||||
"monitoringSummary": "مراقبة {{count}} خدمة · يتم التحديث كل 10 ثوانٍ",
|
||||
"monitoringSummary_other": "مراقبة {{count}} خدمات · يتم التحديث كل 10 ثوانٍ"
|
||||
},
|
||||
"table": {
|
||||
"headers": {
|
||||
@@ -1397,11 +1477,47 @@
|
||||
"label": "إظهار مقاييس البنية التحتية"
|
||||
}
|
||||
}
|
||||
},
|
||||
"theme": {
|
||||
"description": "اختر النمط المرئي لصفحة الحالة العامة الخاصة بك.",
|
||||
"label": "السمة",
|
||||
"options": {
|
||||
"bold": {
|
||||
"description": "خط كبير ومسافات واثقة. رائعة للصفحات التي تركز على العلامة التجارية.",
|
||||
"name": "غامق"
|
||||
},
|
||||
"editorial": {
|
||||
"description": "عناوين بخط مسرف وفواصل دقيقة. مميز وهادئ.",
|
||||
"name": "تحريري"
|
||||
},
|
||||
"modern": {
|
||||
"description": "بجودة SaaS مع نقطة حالة نابضة وبطاقات تتلاشى بنعومة.",
|
||||
"name": "حديث"
|
||||
},
|
||||
"refined": {
|
||||
"description": "نظيف واحترافي وقريب من مظهر Checkmate الكلاسيكي.",
|
||||
"name": "مكرر"
|
||||
}
|
||||
},
|
||||
"title": "سمة الصفحة"
|
||||
},
|
||||
"themeMode": {
|
||||
"auto": "تلقائي (اتبع جهاز الزائر)",
|
||||
"dark": "داكن فقط",
|
||||
"label": "وضع السمة",
|
||||
"light": "فاتح فقط"
|
||||
}
|
||||
},
|
||||
"header": {
|
||||
"title": "صفحات الحالة",
|
||||
"description": "انشر صفحات عامة تُظهر للعملاء وأصحاب المصلحة وقت التشغيل الفعلي وتاريخ الحوادث."
|
||||
},
|
||||
"editorial": {
|
||||
"allUp": "جميع الأنظمة تعمل بشكل طبيعي.",
|
||||
"reportTitle": "تقرير الخدمة"
|
||||
},
|
||||
"footer": {
|
||||
"poweredBy": "مشغل بواسطة"
|
||||
}
|
||||
},
|
||||
"uptime": {
|
||||
|
||||
File diff suppressed because it is too large.
Load diff
+148
-32
@@ -73,7 +73,9 @@
|
||||
"paused": "pozastaveno",
|
||||
"na": "N/A",
|
||||
"resolved": "Vyřešeno",
|
||||
"responseTime": "Doba odezvy"
|
||||
"responseTime": "Doba odezvy",
|
||||
"idle": "Nečinný",
|
||||
"running": "Spuštěno"
|
||||
},
|
||||
"form": {
|
||||
"role": {
|
||||
@@ -120,6 +122,17 @@
|
||||
"active": "Aktivní",
|
||||
"responseTime": "Doba odezvy"
|
||||
}
|
||||
},
|
||||
"statusCode": {
|
||||
"down": "Mimo provoz",
|
||||
"networkError": {
|
||||
"dns": "Nepodařilo se přeložit název hostitele (vyhledávání DNS selhalo).",
|
||||
"refused": "Server odmítl spojení (port je uzavřený nebo služba neposlouchá).",
|
||||
"reset": "Spojení bylo resetováno před přijetím odpovědi.",
|
||||
"timeout": "Server neodpověděl včas (vypršel časový limit požadavku).",
|
||||
"tls": "Selhal handshake TLS nebo SSL (problém s certifikátem nebo šifrováním).",
|
||||
"unknown": "Z cíle nebyla obdržena žádná odpověď HTTP."
|
||||
}
|
||||
}
|
||||
},
|
||||
"components": {
|
||||
@@ -421,7 +434,11 @@
|
||||
"inviteMember": "Pozvat člena",
|
||||
"openSite": "Otevřít stránku",
|
||||
"pause": "Pozastavit",
|
||||
"resume": "Obnovit"
|
||||
"resume": "Obnovit",
|
||||
"selectAll": "Vybrat všechny monitory",
|
||||
"selectMonitor": "Vybrat {{name}}",
|
||||
"bulkSelected_one": "Vybrán {{count}} monitor",
|
||||
"bulkSelected_other": "Vybráno {{count}} monitorů"
|
||||
},
|
||||
"statBoxes": {
|
||||
"activeFor": "Aktivní po dobu",
|
||||
@@ -448,7 +465,19 @@
|
||||
"optionPagespeed": "PageSpeed",
|
||||
"optionHardware": "Infrastruktura",
|
||||
"optionGrpc": "gRPC",
|
||||
"optionWebSocket": "WebSocket"
|
||||
"optionWebSocket": "WebSocket",
|
||||
"optionDns": "DNS"
|
||||
},
|
||||
"bulkPause": {
|
||||
"paused_one": "{{count}} monitor pozastaven",
|
||||
"paused_other": "{{count}} monitorů pozastaveno",
|
||||
"resumed_one": "{{count}} monitor obnoven",
|
||||
"resumed_other": "{{count}} monitorů obnoveno",
|
||||
"alreadyPaused_one": "Vybraný monitor je již pozastaven",
|
||||
"alreadyPaused_other": "Všechny vybrané monitory jsou již pozastaveny",
|
||||
"alreadyRunning_one": "Vybraný monitor již běží",
|
||||
"alreadyRunning_other": "Všechny vybrané monitory již běží",
|
||||
"partialFailure": "Bylo aktualizováno {{successCount}} monitorů, ale u {{failedCount}} se nezdařila synchronizace s frontou úloh"
|
||||
}
|
||||
}
|
||||
},
|
||||
@@ -469,9 +498,9 @@
|
||||
},
|
||||
"matchMethod": {
|
||||
"label": "Metoda porovnání",
|
||||
"equal": "",
|
||||
"include": "",
|
||||
"regex": ""
|
||||
"equal": "Rovná se",
|
||||
"include": "Obsahuje",
|
||||
"regex": "Regulární výraz"
|
||||
}
|
||||
},
|
||||
"title": "Pokročilá nastavení"
|
||||
@@ -483,15 +512,15 @@
|
||||
"label": "Frekvence kontroly",
|
||||
"value": {
|
||||
"fifteenMinutes": "15 minut",
|
||||
"fifteenSeconds": "",
|
||||
"fifteenSeconds": "15 sekund",
|
||||
"fiveMinutes": "5 minut",
|
||||
"fourMinutes": "",
|
||||
"oneMinute": "",
|
||||
"fourMinutes": "4 minuty",
|
||||
"oneMinute": "1 minuta",
|
||||
"tenMinutes": "10 minut",
|
||||
"thirtyMinutes": "30 minut",
|
||||
"thirtySeconds": "",
|
||||
"threeMinutes": "",
|
||||
"twoMinutes": ""
|
||||
"thirtySeconds": "30 sekund",
|
||||
"threeMinutes": "3 minuty",
|
||||
"twoMinutes": "2 minuty"
|
||||
}
|
||||
}
|
||||
},
|
||||
@@ -520,8 +549,8 @@
|
||||
"placeholder": "https://www.google.com"
|
||||
},
|
||||
"game": {
|
||||
"label": "",
|
||||
"placeholder": ""
|
||||
"label": "Vybrat hru",
|
||||
"placeholder": "Vyberte hru"
|
||||
},
|
||||
"port": {
|
||||
"label": "Port ke sledování",
|
||||
@@ -534,19 +563,44 @@
|
||||
"wsUrl": {
|
||||
"label": "WebSocket URL",
|
||||
"placeholder": "wss://example.com/socket"
|
||||
},
|
||||
"captureUrl": {
|
||||
"label": "Endpoint Capture",
|
||||
"placeholder": "http://192.168.1.10:5001/api/v1/metrics"
|
||||
},
|
||||
"dnsRecordType": {
|
||||
"label": "Typ záznamu DNS",
|
||||
"value": {
|
||||
"A": "A",
|
||||
"AAAA": "AAAA",
|
||||
"CNAME": "CNAME",
|
||||
"MX": "MX",
|
||||
"NS": "NS",
|
||||
"TXT": "TXT"
|
||||
}
|
||||
},
|
||||
"dnsServer": {
|
||||
"label": "DNS server",
|
||||
"placeholder": "8.8.8.8"
|
||||
},
|
||||
"strategy": {
|
||||
"desktop": "Stolní počítač",
|
||||
"label": "Strategie",
|
||||
"mobile": "Mobil"
|
||||
}
|
||||
},
|
||||
"title": "Obecná nastavení",
|
||||
"description": {
|
||||
"http": "Zadejte URL nebo IP adresu ke sledování (např. https://example.com/ nebo 192.168.1.100) a přidejte jasný zobrazovaný název, který se zobrazí na přehledu.",
|
||||
"ping": "",
|
||||
"port": "",
|
||||
"docker": "",
|
||||
"ping": "Zadejte IP adresu nebo název hostitele pro ping (např. 192.168.1.100 nebo example.com) a přidejte přehledný název, který se zobrazí na dashboardu.",
|
||||
"port": "Zadejte URL nebo IP serveru, číslo portu a přehledný název, který se zobrazí na dashboardu.",
|
||||
"docker": "Zadejte název nebo ID Docker kontejneru. Můžete použít buď název kontejneru (např. my-app) nebo ID kontejneru (úplné 64znakové ID nebo krátké ID).",
|
||||
"game": "Zadejte IP adresu nebo název hostitele a číslo portu pro ping (např. 192.168.1.100 nebo example.com) a vyberte typ hry. Některé hry vyžadují povolení dotazů na server v jejich konfiguračním souboru — viz dokumentace vašeho herního serveru. Podrobnosti o protokolu najdete v <gamedigLink>seznamu podporovaných her</gamedigLink>.",
|
||||
"pagespeed": "Sledujte výkon načítání stránky, metriky Core Web Vitals a hodnocení optimalizace vašeho webu.",
|
||||
"grpc": "Zadejte název hostitele a port gRPC serveru, volitelně zadejte název služby pro kontrolu stavu a přidejte zobrazovaný název.",
|
||||
"websocket": "Zadejte WebSocket URL ke sledování (např. wss://example.com/socket) a přidejte zobrazovaný název.",
|
||||
"hardware": "Sledujte využití CPU, paměti, disku a teplotu vaší infrastruktury."
|
||||
"hardware": "Sledujte využití CPU, paměti, disku a teplotu vaší infrastruktury. URL endpointu Capture musí obsahovat celou cestu /api/v1/metrics (např. http://192.168.1.10:5001/api/v1/metrics). Do autorizačního klíče vložte pouze řetězec tokenu — nezahrnujte 'Bearer'.",
|
||||
"dns": "Sledujte, zda konkrétní DNS server odpovídá."
|
||||
}
|
||||
},
|
||||
"ignoreTls": {
|
||||
@@ -583,7 +637,8 @@
|
||||
"optionHttpDescription": "Použijte HTTP(S) ke sledování vašeho webu nebo API koncového bodu.",
|
||||
"optionPingDescription": "Použijte ICMP Ping ke sledování, zda je server online.",
|
||||
"optionPortDescription": "Sledujte, zda je konkrétní port na serveru otevřen.",
|
||||
"title": "Typ"
|
||||
"title": "Typ",
|
||||
"optionDnsDescription": "Sledujte, zda konkrétní DNS server odpovídá."
|
||||
},
|
||||
"thresholds": {
|
||||
"title": "Prahové hodnoty upozornění",
|
||||
@@ -747,7 +802,7 @@
|
||||
"headers": {
|
||||
"endTime": "Čas ukončení",
|
||||
"resolutionType": "Typ řešení",
|
||||
"startTime": "",
|
||||
"startTime": "Čas zahájení",
|
||||
"statusCode": "Stavový kód"
|
||||
},
|
||||
"resolvedIncidents": "Vyřešené incidenty",
|
||||
@@ -791,13 +846,13 @@
|
||||
}
|
||||
},
|
||||
"statBoxes": {
|
||||
"avgCpuTemperature": "",
|
||||
"cpuFrequency": "",
|
||||
"cpuLogical": "",
|
||||
"cpuPhysical": "",
|
||||
"avgCpuTemperature": "Průměrná teplota CPU",
|
||||
"cpuFrequency": "Frekvence CPU",
|
||||
"cpuLogical": "CPU (logický)",
|
||||
"cpuPhysical": "CPU (fyzický)",
|
||||
"disk": "Disk",
|
||||
"memory": "Paměť",
|
||||
"os": ""
|
||||
"os": "OS"
|
||||
},
|
||||
"table": {
|
||||
"headers": {
|
||||
@@ -808,7 +863,7 @@
|
||||
},
|
||||
"tabs": {
|
||||
"labels": {
|
||||
"network": "",
|
||||
"network": "Síť",
|
||||
"overview": "Přehled"
|
||||
}
|
||||
},
|
||||
@@ -891,7 +946,8 @@
|
||||
"lastFinishedAt": "Naposledy dokončeno",
|
||||
"lastRunTook": "Poslední běh trval",
|
||||
"lastFailedAt": "Poslední selhání",
|
||||
"failReason": "Důvod selhání"
|
||||
"failReason": "Důvod selhání",
|
||||
"state": "Stav"
|
||||
}
|
||||
},
|
||||
"queueFallback": {
|
||||
@@ -911,8 +967,8 @@
|
||||
},
|
||||
"table": {
|
||||
"headers": {
|
||||
"nextWindow": "",
|
||||
"repeat": ""
|
||||
"nextWindow": "Další okno",
|
||||
"repeat": "Opakovat"
|
||||
}
|
||||
},
|
||||
"form": {
|
||||
@@ -1014,7 +1070,7 @@
|
||||
},
|
||||
"telegram": {
|
||||
"title": "Konfigurace Telegramu",
|
||||
"description": "",
|
||||
"description": "Nakonfigurujte svého Telegram bota pro odesílání oznámení.",
|
||||
"optionBotToken": "Token bota",
|
||||
"placeholderBotToken": "123456789:ABCdefGhIJKlmNoPQRsTUVwxyZ",
|
||||
"optionChatId": "ID chatu",
|
||||
@@ -1081,6 +1137,10 @@
|
||||
"header": {
|
||||
"title": "Monitory PageSpeed",
|
||||
"description": "Sledujte Core Web Vitals a skóre Lighthouse v čase a zachyťte regrese dříve než vaši uživatelé."
|
||||
},
|
||||
"strategy": {
|
||||
"desktop": "Stolní počítač",
|
||||
"mobile": "Mobil"
|
||||
}
|
||||
},
|
||||
"settings": {
|
||||
@@ -1183,7 +1243,7 @@
|
||||
"email": {
|
||||
"title": "Nastavení emailu",
|
||||
"description": "Nastavte emailovou konfiguraci pro váš systém. Používá se k odesílání oznámení a upozornění.",
|
||||
"descriptionTransport": "",
|
||||
"descriptionTransport": "Toto vytvoří SMTP transport pro NodeMailer",
|
||||
"descriptionTransportLink": "Zobrazit specifikace zde",
|
||||
"option": {
|
||||
"host": {
|
||||
@@ -1229,6 +1289,10 @@
|
||||
},
|
||||
"rejectUnauthorized": {
|
||||
"label": "Odmítnout neplatné certifikáty: Odmítnout připojení se sebou podepsanými nebo nedůvěryhodnými certifikáty"
|
||||
},
|
||||
"displayName": {
|
||||
"label": "Jméno odesílatele (nepovinné) - Přátelské jméno zobrazené v poli Od",
|
||||
"placeholder": "Oznámení Checkmate"
|
||||
}
|
||||
}
|
||||
},
|
||||
@@ -1289,6 +1353,20 @@
|
||||
"uptime": {
|
||||
"title": "Dostupnost",
|
||||
"responseTime": "Doba odezvy"
|
||||
},
|
||||
"chart": {
|
||||
"avg": "průměr {{value}}ms",
|
||||
"downTooltip": "Mimo provoz",
|
||||
"heatmapAria": "Tepelná mapa doby odezvy",
|
||||
"max": "max {{value}}ms"
|
||||
},
|
||||
"status": {
|
||||
"breached": "Překročen limit",
|
||||
"down": "Mimo provoz",
|
||||
"initializing": "Inicializace",
|
||||
"maintenance": "Údržba",
|
||||
"paused": "Pozastaveno",
|
||||
"up": "V provozu"
|
||||
}
|
||||
},
|
||||
"statusBar": {
|
||||
@@ -1306,7 +1384,9 @@
|
||||
"maintenance": "Některé systémy jsou v údržbě",
|
||||
"partiallyPaused": "Některé systémy jsou pozastavené",
|
||||
"initializing": "Některé systémy se inicializují",
|
||||
"noMonitors": "Nebyly nakonfigurovány žádné monitory"
|
||||
"noMonitors": "Nebyly nakonfigurovány žádné monitory",
|
||||
"monitoringSummary": "Sledování {{count}} služby · Aktualizace každých 10 sekund",
|
||||
"monitoringSummary_other": "Sledování {{count}} služeb · Aktualizace každých 10 sekund"
|
||||
},
|
||||
"table": {
|
||||
"headers": {
|
||||
@@ -1397,11 +1477,47 @@
|
||||
"label": "Zobrazit metriky infrastruktury"
|
||||
}
|
||||
}
|
||||
},
|
||||
"theme": {
|
||||
"description": "Vyberte vizuální styl pro veřejnou stavovou stránku.",
|
||||
"label": "Motiv",
|
||||
"options": {
|
||||
"bold": {
|
||||
"description": "Velké písmo a sebevědomé rozložení. Vhodné pro stránky zaměřené na značku.",
|
||||
"name": "Tučný"
|
||||
},
|
||||
"editorial": {
|
||||
"description": "Patkové nadpisy a tenké oddělovače. Odlišný a klidný.",
|
||||
"name": "Redakční"
|
||||
},
|
||||
"modern": {
|
||||
"description": "Úroveň SaaS s pulzující stavovou tečkou a jemně mizejícími kartami.",
|
||||
"name": "Moderní"
|
||||
},
|
||||
"refined": {
|
||||
"description": "Čistý, profesionální, blízký klasickému vzhledu Checkmate.",
|
||||
"name": "Vytříbený"
|
||||
}
|
||||
},
|
||||
"title": "Motiv stránky"
|
||||
},
|
||||
"themeMode": {
|
||||
"auto": "Automaticky (podle zařízení návštěvníka)",
|
||||
"dark": "Pouze tmavý",
|
||||
"label": "Režim motivu",
|
||||
"light": "Pouze světlý"
|
||||
}
|
||||
},
|
||||
"header": {
|
||||
"title": "Stavové stránky",
|
||||
"description": "Publikujte veřejné stránky, které zákazníkům a zúčastněným stranám zobrazují dostupnost v reálném čase a historii incidentů."
|
||||
},
|
||||
"editorial": {
|
||||
"allUp": "Všechny systémy fungují normálně.",
|
||||
"reportTitle": "Zpráva o službě"
|
||||
},
|
||||
"footer": {
|
||||
"poweredBy": "Provozováno službou"
|
||||
}
|
||||
},
|
||||
"uptime": {
|
||||
|
||||
+123
-7
@@ -73,7 +73,9 @@
|
||||
"paused": "pausiert",
|
||||
"na": "N/A",
|
||||
"resolved": "Gelöst",
|
||||
"responseTime": "Antwortzeit"
|
||||
"responseTime": "Antwortzeit",
|
||||
"idle": "Untätig",
|
||||
"running": "Läuft"
|
||||
},
|
||||
"form": {
|
||||
"role": {
|
||||
@@ -120,6 +122,17 @@
|
||||
"active": "Aktiv",
|
||||
"responseTime": "Antwortzeit"
|
||||
}
|
||||
},
|
||||
"statusCode": {
|
||||
"down": "Ausgefallen",
|
||||
"networkError": {
|
||||
"dns": "Hostname konnte nicht aufgelöst werden (DNS-Auflösung fehlgeschlagen).",
|
||||
"refused": "Der Server hat die Verbindung abgelehnt (Port geschlossen oder Dienst lauscht nicht).",
|
||||
"reset": "Die Verbindung wurde zurückgesetzt, bevor eine Antwort empfangen wurde.",
|
||||
"timeout": "Der Server hat nicht rechtzeitig geantwortet (Zeitüberschreitung der Anfrage).",
|
||||
"tls": "TLS- oder SSL-Handshake fehlgeschlagen (Zertifikats- oder Verschlüsselungsproblem).",
|
||||
"unknown": "Es wurde keine HTTP-Antwort vom Ziel empfangen."
|
||||
}
|
||||
}
|
||||
},
|
||||
"components": {
|
||||
@@ -421,7 +434,11 @@
|
||||
"inviteMember": "Mitglied einladen",
|
||||
"openSite": "Seite öffnen",
|
||||
"pause": "Pausieren",
|
||||
"resume": "Fortsetzen"
|
||||
"resume": "Fortsetzen",
|
||||
"selectAll": "Alle Monitore auswählen",
|
||||
"selectMonitor": "{{name}} auswählen",
|
||||
"bulkSelected_one": "{{count}} Monitor ausgewählt",
|
||||
"bulkSelected_other": "{{count}} Monitore ausgewählt"
|
||||
},
|
||||
"statBoxes": {
|
||||
"activeFor": "Aktiv seit",
|
||||
@@ -448,7 +465,19 @@
|
||||
"optionPagespeed": "PageSpeed",
|
||||
"optionHardware": "Infrastruktur",
|
||||
"optionGrpc": "gRPC",
|
||||
"optionWebSocket": "WebSocket"
|
||||
"optionWebSocket": "WebSocket",
|
||||
"optionDns": "DNS"
|
||||
},
|
||||
"bulkPause": {
|
||||
"paused_one": "{{count}} Monitor pausiert",
|
||||
"paused_other": "{{count}} Monitore pausiert",
|
||||
"resumed_one": "{{count}} Monitor fortgesetzt",
|
||||
"resumed_other": "{{count}} Monitore fortgesetzt",
|
||||
"alreadyPaused_one": "Der ausgewählte Monitor ist bereits pausiert",
|
||||
"alreadyPaused_other": "Alle ausgewählten Monitore sind bereits pausiert",
|
||||
"alreadyRunning_one": "Der ausgewählte Monitor wird bereits ausgeführt",
|
||||
"alreadyRunning_other": "Alle ausgewählten Monitore werden bereits ausgeführt",
|
||||
"partialFailure": "{{successCount}} Monitore aktualisiert, aber {{failedCount}} konnten nicht mit der Job-Warteschlange synchronisiert werden"
|
||||
}
|
||||
}
|
||||
},
|
||||
@@ -534,6 +563,30 @@
|
||||
"wsUrl": {
|
||||
"label": "WebSocket-URL",
|
||||
"placeholder": "wss://example.com/socket"
|
||||
},
|
||||
"captureUrl": {
|
||||
"label": "Capture-Endpunkt",
|
||||
"placeholder": "http://192.168.1.10:5001/api/v1/metrics"
|
||||
},
|
||||
"dnsRecordType": {
|
||||
"label": "DNS-Eintragstyp",
|
||||
"value": {
|
||||
"A": "A",
|
||||
"AAAA": "AAAA",
|
||||
"CNAME": "CNAME",
|
||||
"MX": "MX",
|
||||
"NS": "NS",
|
||||
"TXT": "TXT"
|
||||
}
|
||||
},
|
||||
"dnsServer": {
|
||||
"label": "DNS-Server",
|
||||
"placeholder": "8.8.8.8"
|
||||
},
|
||||
"strategy": {
|
||||
"desktop": "Desktop",
|
||||
"label": "Strategie",
|
||||
"mobile": "Mobil"
|
||||
}
|
||||
},
|
||||
"title": "Allgemeine Einstellungen",
|
||||
@@ -546,7 +599,8 @@
|
||||
"pagespeed": "Verfolgen Sie die Ladezeit, Core Web Vitals und Optimierungswerte Ihrer Website.",
|
||||
"grpc": "Geben Sie den Hostnamen und Port des gRPC-Servers ein, optional einen Dienstnamen für den Health-Check, und fügen Sie einen Anzeigenamen hinzu.",
|
||||
"websocket": "Geben Sie die zu überwachende WebSocket-URL ein (z. B. wss://example.com/socket) und fügen Sie einen Anzeigenamen hinzu.",
|
||||
"hardware": "Überwachen Sie CPU-, Arbeitsspeicher-, Festplattenauslastung und Temperatur Ihrer Infrastruktur."
|
||||
"hardware": "Überwachen Sie CPU-, Speicher-, Festplattenauslastung und Temperatur Ihrer Infrastruktur. Die URL des Capture-Endpunkts muss den vollständigen Pfad /api/v1/metrics enthalten (z. B. http://192.168.1.10:5001/api/v1/metrics). Fügen Sie für das Autorisierungsgeheimnis nur den Token-String ein — geben Sie 'Bearer' nicht mit an.",
|
||||
"dns": "Überwachen Sie, ob ein bestimmter DNS-Server antwortet."
|
||||
}
|
||||
},
|
||||
"ignoreTls": {
|
||||
@@ -583,7 +637,8 @@
|
||||
"optionHttpDescription": "HTTP(S) verwenden, um Ihre Website oder Ihren API-Endpunkt zu überwachen.",
|
||||
"optionPingDescription": "ICMP-Ping verwenden, um zu überwachen, ob ein Server online ist.",
|
||||
"optionPortDescription": "Überwachen, ob ein bestimmter Port auf einem Server geöffnet ist.",
|
||||
"title": "Typ"
|
||||
"title": "Typ",
|
||||
"optionDnsDescription": "Überwachen Sie, ob ein bestimmter DNS-Server antwortet."
|
||||
},
|
||||
"thresholds": {
|
||||
"title": "Alarmschwellenwerte",
|
||||
@@ -891,7 +946,8 @@
|
||||
"lastFinishedAt": "Zuletzt abgeschlossen am",
|
||||
"lastRunTook": "Letzter Lauf dauerte",
|
||||
"lastFailedAt": "Letzter Fehler am",
|
||||
"failReason": "Fehlergrund"
|
||||
"failReason": "Fehlergrund",
|
||||
"state": "Status"
|
||||
}
|
||||
},
|
||||
"queueFallback": {
|
||||
@@ -1081,6 +1137,10 @@
|
||||
"header": {
|
||||
"title": "PageSpeed-Monitore",
|
||||
"description": "Verfolgen Sie Core Web Vitals und Lighthouse-Werte im Zeitverlauf, um Regressionen zu erkennen, bevor Nutzer es tun."
|
||||
},
|
||||
"strategy": {
|
||||
"desktop": "Desktop",
|
||||
"mobile": "Mobil"
|
||||
}
|
||||
},
|
||||
"settings": {
|
||||
@@ -1229,6 +1289,10 @@
|
||||
},
|
||||
"rejectUnauthorized": {
|
||||
"label": "Ungültige Zertifikate ablehnen: Verbindungen mit selbstsignierten oder nicht vertrauenswürdigen Zertifikaten ablehnen"
|
||||
},
|
||||
"displayName": {
|
||||
"label": "Absendername (optional) - Anzeigename im Absenderfeld",
|
||||
"placeholder": "Checkmate-Benachrichtigungen"
|
||||
}
|
||||
}
|
||||
},
|
||||
@@ -1289,6 +1353,20 @@
|
||||
"uptime": {
|
||||
"title": "Verfügbarkeit",
|
||||
"responseTime": "Antwortzeit"
|
||||
},
|
||||
"chart": {
|
||||
"avg": "Ø {{value}}ms",
|
||||
"downTooltip": "Ausgefallen",
|
||||
"heatmapAria": "Heatmap der Antwortzeit",
|
||||
"max": "max. {{value}}ms"
|
||||
},
|
||||
"status": {
|
||||
"breached": "Schwellenwert überschritten",
|
||||
"down": "Ausgefallen",
|
||||
"initializing": "Initialisierung",
|
||||
"maintenance": "Wartung",
|
||||
"paused": "Pausiert",
|
||||
"up": "Betriebsbereit"
|
||||
}
|
||||
},
|
||||
"statusBar": {
|
||||
@@ -1306,7 +1384,9 @@
|
||||
"maintenance": "Einige Systeme befinden sich in Wartung",
|
||||
"partiallyPaused": "Einige Systeme sind pausiert",
|
||||
"initializing": "Einige Systeme werden initialisiert",
|
||||
"noMonitors": "Es wurden keine Monitore konfiguriert"
|
||||
"noMonitors": "Es wurden keine Monitore konfiguriert",
|
||||
"monitoringSummary": "Überwachung von {{count}} Dienst · Aktualisierung alle 10 Sekunden",
|
||||
"monitoringSummary_other": "Überwachung von {{count}} Diensten · Aktualisierung alle 10 Sekunden"
|
||||
},
|
||||
"table": {
|
||||
"headers": {
|
||||
@@ -1397,11 +1477,47 @@
|
||||
"label": "Infrastruktur-Metriken anzeigen"
|
||||
}
|
||||
}
|
||||
},
|
||||
"theme": {
|
||||
"description": "Wählen Sie den visuellen Stil für Ihre öffentliche Statusseite.",
|
||||
"label": "Theme",
|
||||
"options": {
|
||||
"bold": {
|
||||
"description": "Große Schrift und großzügige Abstände. Ideal für markenorientierte Seiten.",
|
||||
"name": "Fett"
|
||||
},
|
||||
"editorial": {
|
||||
"description": "Serifenüberschriften und feine Trennlinien. Markant und ruhig.",
|
||||
"name": "Redaktionell"
|
||||
},
|
||||
"modern": {
|
||||
"description": "SaaS-Niveau mit pulsierendem Statuspunkt und sanft verblassenden Karten.",
|
||||
"name": "Modern"
|
||||
},
|
||||
"refined": {
|
||||
"description": "Sauber, professionell, nah am klassischen Checkmate-Look.",
|
||||
"name": "Verfeinert"
|
||||
}
|
||||
},
|
||||
"title": "Seiten-Theme"
|
||||
},
|
||||
"themeMode": {
|
||||
"auto": "Automatisch (Gerät des Besuchers folgen)",
|
||||
"dark": "Nur dunkel",
|
||||
"label": "Theme-Modus",
|
||||
"light": "Nur hell"
|
||||
}
|
||||
},
|
||||
"header": {
|
||||
"title": "Statusseiten",
|
||||
"description": "Veröffentlichen Sie öffentliche Seiten, die Kunden und Stakeholdern Echtzeit-Verfügbarkeit und Vorfallsverlauf zeigen."
|
||||
},
|
||||
"editorial": {
|
||||
"allUp": "Alle Systeme funktionieren normal.",
|
||||
"reportTitle": "Servicebericht"
|
||||
},
|
||||
"footer": {
|
||||
"poweredBy": "Bereitgestellt von"
|
||||
}
|
||||
},
|
||||
"uptime": {
|
||||
|
||||
+129
-6
@@ -14,6 +14,17 @@
|
||||
}
|
||||
},
|
||||
"appName": "Checkmate",
|
||||
"statusCode": {
|
||||
"down": "Down",
|
||||
"networkError": {
|
||||
"timeout": "The server didn't respond in time (request timed out).",
|
||||
"dns": "Couldn't resolve the hostname (DNS lookup failed).",
|
||||
"refused": "The server refused the connection (port closed or service not listening).",
|
||||
"tls": "TLS or SSL handshake failed (certificate or encryption issue).",
|
||||
"reset": "The connection was reset before a response was received.",
|
||||
"unknown": "No HTTP response was received from the target."
|
||||
}
|
||||
},
|
||||
"breadcrumbs": {
|
||||
"details": "Details",
|
||||
"home": "Home"
|
||||
@@ -32,6 +43,8 @@
|
||||
"pause": "Pause",
|
||||
"resume": "Resume",
|
||||
"save": "Save",
|
||||
"next": "Next",
|
||||
"back": "Back",
|
||||
"sendInvite": "Send invite",
|
||||
"test": "Test",
|
||||
"testNotifications": "Test notifications",
|
||||
@@ -70,7 +83,9 @@
|
||||
},
|
||||
"labels": {
|
||||
"active": "Active",
|
||||
"paused": "paused",
|
||||
"running": "Running",
|
||||
"paused": "Paused",
|
||||
"idle": "Idle",
|
||||
"na": "N/A",
|
||||
"resolved": "Resolved",
|
||||
"responseTime": "Response time"
|
||||
@@ -118,7 +133,8 @@
|
||||
"url": "Url",
|
||||
"interval": "Interval",
|
||||
"active": "Active",
|
||||
"responseTime": "Response time"
|
||||
"responseTime": "Response time",
|
||||
"tags": "Tags"
|
||||
}
|
||||
}
|
||||
},
|
||||
@@ -171,6 +187,7 @@
|
||||
"pagespeed": "Pagespeed",
|
||||
"infrastructure": "Infrastructure",
|
||||
"notifications": "Notifications",
|
||||
"tags": "Tags",
|
||||
"checks": "Checks",
|
||||
"incidents": "Incidents",
|
||||
"statusPages": "Status pages",
|
||||
@@ -421,7 +438,22 @@
|
||||
"inviteMember": "Invite member",
|
||||
"openSite": "Open site",
|
||||
"pause": "Pause",
|
||||
"resume": "Resume"
|
||||
"resume": "Resume",
|
||||
"bulkSelected_one": "{{count}} monitor selected",
|
||||
"bulkSelected_other": "{{count}} monitors selected",
|
||||
"selectAll": "Select all monitors",
|
||||
"selectMonitor": "Select {{name}}"
|
||||
},
|
||||
"bulkPause": {
|
||||
"alreadyPaused_one": "The selected monitor is already paused",
|
||||
"alreadyPaused_other": "All selected monitors are already paused",
|
||||
"alreadyRunning_one": "The selected monitor is already running",
|
||||
"alreadyRunning_other": "All selected monitors are already running",
|
||||
"paused_one": "{{count}} monitor paused",
|
||||
"paused_other": "{{count}} monitors paused",
|
||||
"resumed_one": "{{count}} monitor resumed",
|
||||
"resumed_other": "{{count}} monitors resumed",
|
||||
"partialFailure": "{{successCount}} monitors updated, but {{failedCount}} failed to sync with the job queue"
|
||||
},
|
||||
"statBoxes": {
|
||||
"activeFor": "Active for",
|
||||
@@ -448,7 +480,8 @@
|
||||
"optionPagespeed": "PageSpeed",
|
||||
"optionHardware": "Infrastructure",
|
||||
"optionGrpc": "gRPC",
|
||||
"optionWebSocket": "WebSocket"
|
||||
"optionWebSocket": "WebSocket",
|
||||
"optionDns": "DNS"
|
||||
}
|
||||
}
|
||||
},
|
||||
@@ -534,6 +567,30 @@
|
||||
"wsUrl": {
|
||||
"label": "WebSocket URL",
|
||||
"placeholder": "wss://example.com/socket"
|
||||
},
|
||||
"strategy": {
|
||||
"label": "Strategy",
|
||||
"desktop": "Desktop",
|
||||
"mobile": "Mobile"
|
||||
},
|
||||
"captureUrl": {
|
||||
"label": "Capture endpoint",
|
||||
"placeholder": "http://192.168.1.10:5001/api/v1/metrics"
|
||||
},
|
||||
"dnsServer": {
|
||||
"label": "DNS server",
|
||||
"placeholder": "8.8.8.8"
|
||||
},
|
||||
"dnsRecordType": {
|
||||
"label": "DNS record type",
|
||||
"value": {
|
||||
"A": "A",
|
||||
"AAAA": "AAAA",
|
||||
"CNAME": "CNAME",
|
||||
"MX": "MX",
|
||||
"NS": "NS",
|
||||
"TXT": "TXT"
|
||||
}
|
||||
}
|
||||
},
|
||||
"title": "General settings",
|
||||
@@ -546,7 +603,8 @@
|
||||
"pagespeed": "Track page load performance, Core Web Vitals, and optimization scores for your website.",
|
||||
"grpc": "Enter the hostname and port of the gRPC server, optionally specify a service name for the health check, and add a display name.",
|
||||
"websocket": "Enter the WebSocket URL to monitor (e.g., wss://example.com/socket) and add a display name.",
|
||||
"hardware": "Monitor CPU, memory, disk usage, and temperature for your infrastructure."
|
||||
"hardware": "Monitor CPU, memory, disk usage, and temperature for your infrastructure. The Capture endpoint URL must include the full path /api/v1/metrics (e.g. http://192.168.1.10:5001/api/v1/metrics). For the authorization secret, paste only the token string — don't include 'Bearer'.",
|
||||
"dns": "Monitor if a specific DNS server is responding."
|
||||
}
|
||||
},
|
||||
"ignoreTls": {
|
||||
@@ -574,6 +632,10 @@
|
||||
"description": "Select the notification channels you want to use",
|
||||
"title": "Notifications"
|
||||
},
|
||||
"tags": {
|
||||
"description": "Select the tags you want to apply to this monitor",
|
||||
"title": "Tags"
|
||||
},
|
||||
"type": {
|
||||
"description": "Select the type of check to perform",
|
||||
"optionDockerDescription": "Use Docker to monitor if a container is running.",
|
||||
@@ -583,6 +645,7 @@
|
||||
"optionHttpDescription": "Use HTTP(S) to monitor your website or API endpoint.",
|
||||
"optionPingDescription": "Use ICMP Ping to monitor if a server is online.",
|
||||
"optionPortDescription": "Monitor if a specific port on a server is open.",
|
||||
"optionDnsDescription": "Monitor if a specific DNS server is responding.",
|
||||
"title": "Type"
|
||||
},
|
||||
"thresholds": {
|
||||
@@ -822,6 +885,37 @@
|
||||
"description": "Track server performance, identify bottlenecks, and ensure reliability with real-time infrastructure monitoring."
|
||||
}
|
||||
},
|
||||
"tags": {
|
||||
"header": {
|
||||
"title": "Tags",
|
||||
"description": "Organize your monitors with tags"
|
||||
},
|
||||
"fallback": {
|
||||
"title": "No tags yet",
|
||||
"description": "Organize your monitors with tags. Once you create a tag and assign it to a monitor, you'll be able to filter by that tag across the app and see tag details here.",
|
||||
"actionButton": "Create a tag"
|
||||
},
|
||||
"table": {
|
||||
"headers": {
|
||||
"color": "Color",
|
||||
"appearance": "Appearance"
|
||||
}
|
||||
},
|
||||
"form": {
|
||||
"name": {
|
||||
"title": "Tag name",
|
||||
"description": "Choose a name for your tag",
|
||||
"optionName": "Tag name",
|
||||
"placeholder": "e.g. Group 1"
|
||||
},
|
||||
"color": {
|
||||
"title": "Tag color",
|
||||
"description": "Choose a color for your tag",
|
||||
"optionName": "Tag color",
|
||||
"placeholder": "e.g. #13715B"
|
||||
}
|
||||
}
|
||||
},
|
||||
"logs": {
|
||||
"fallback": {
|
||||
"title": "No logs yet",
|
||||
@@ -860,6 +954,14 @@
|
||||
"memoryCpu": {
|
||||
"title": "Memory & CPU",
|
||||
"description": "How the process is using its allocated memory and host CPU."
|
||||
},
|
||||
"mongoDBStats": {
|
||||
"title": "MongoDB stats",
|
||||
"description": "Snapshot of MongoDB metrics"
|
||||
},
|
||||
"mongoDBCollectionStats": {
|
||||
"title": "MongoDB collection stats",
|
||||
"description": "Stats for MongoDB collections"
|
||||
}
|
||||
},
|
||||
"stats": {
|
||||
@@ -869,6 +971,21 @@
|
||||
"totalHeapSize": "Total heap size",
|
||||
"osMemoryLimit": "OS memory limit"
|
||||
},
|
||||
"mongoDBStats": {
|
||||
"readyState": "Ready state",
|
||||
"host": "Host",
|
||||
"port": "Port",
|
||||
"dbName": "Database name",
|
||||
"storageSize": "Storage size"
|
||||
},
|
||||
"mongoDBCollectionStats": {
|
||||
"documents": "Documents: {{count}}",
|
||||
"bucketCount": "Bucket count: {{count}}",
|
||||
"storageSize": "Storage size: {{size}}",
|
||||
"indexSize": "Index size: {{size}}",
|
||||
"totalSize": "Total size: {{size}}",
|
||||
"dbUsageTooltip": "{{percentage}}% of DB storage"
|
||||
},
|
||||
"gauges": {
|
||||
"heapAllocation": "Heap allocation",
|
||||
"heapUsage": "Heap usage",
|
||||
@@ -883,6 +1000,7 @@
|
||||
},
|
||||
"table": {
|
||||
"headers": {
|
||||
"state": "State",
|
||||
"timestamp": "Timestamp",
|
||||
"level": "Level",
|
||||
"service": "Service",
|
||||
@@ -1052,6 +1170,10 @@
|
||||
}
|
||||
},
|
||||
"pageSpeed": {
|
||||
"strategy": {
|
||||
"desktop": "Desktop",
|
||||
"mobile": "Mobile"
|
||||
},
|
||||
"charts": {
|
||||
"common": {
|
||||
"cls": "Cumulative Layout Shift (CLS)",
|
||||
@@ -1464,7 +1586,8 @@
|
||||
"filters": {
|
||||
"search": {
|
||||
"placeholder": "Search monitors..."
|
||||
}
|
||||
},
|
||||
"activeTags": "Active tags"
|
||||
},
|
||||
"table": {
|
||||
"headers": {
|
||||
|
||||
+123
-21
@@ -47,14 +47,7 @@
|
||||
"exportToJSON": "Exportar a JSON",
|
||||
"importFromJSON": "Importar desde JSON",
|
||||
"clearFilters": "Limpiar filtros",
|
||||
"removeUser": "Eliminar usuario",
|
||||
"testNotification": "Probar notificación",
|
||||
"invite": "Invitar",
|
||||
"copyLink": "Copiar enlace",
|
||||
"regenerateToken": "Regenerar token",
|
||||
"copyToken": "Copiar token",
|
||||
"exportLogs": "Exportar registros",
|
||||
"refresh": "Actualizar"
|
||||
"removeUser": "Eliminar usuario"
|
||||
},
|
||||
"charts": {
|
||||
"labels": {
|
||||
@@ -80,7 +73,9 @@
|
||||
"paused": "pausado",
|
||||
"na": "N/D",
|
||||
"resolved": "Resuelto",
|
||||
"responseTime": "Tiempo de respuesta"
|
||||
"responseTime": "Tiempo de respuesta",
|
||||
"idle": "Inactivo",
|
||||
"running": "En ejecución"
|
||||
},
|
||||
"form": {
|
||||
"role": {
|
||||
@@ -127,6 +122,17 @@
|
||||
"active": "Activo",
|
||||
"responseTime": "Tiempo de respuesta"
|
||||
}
|
||||
},
|
||||
"statusCode": {
|
||||
"down": "Caído",
|
||||
"networkError": {
|
||||
"dns": "No se pudo resolver el nombre de host (la búsqueda DNS falló).",
|
||||
"refused": "El servidor rechazó la conexión (puerto cerrado o servicio inactivo).",
|
||||
"reset": "La conexión se restableció antes de recibir una respuesta.",
|
||||
"timeout": "El servidor no respondió a tiempo (tiempo de espera agotado).",
|
||||
"tls": "Falló el protocolo TLS o SSL (problema de certificado o cifrado).",
|
||||
"unknown": "No se recibió ninguna respuesta HTTP del destino."
|
||||
}
|
||||
}
|
||||
},
|
||||
"components": {
|
||||
@@ -428,7 +434,11 @@
|
||||
"inviteMember": "Invitar miembro",
|
||||
"openSite": "Abrir sitio",
|
||||
"pause": "Pausar",
|
||||
"resume": "Reanudar"
|
||||
"resume": "Reanudar",
|
||||
"selectAll": "Seleccionar todos los monitores",
|
||||
"selectMonitor": "Seleccionar {{name}}",
|
||||
"bulkSelected_one": "{{count}} monitor seleccionado",
|
||||
"bulkSelected_other": "{{count}} monitores seleccionados"
|
||||
},
|
||||
"statBoxes": {
|
||||
"activeFor": "Activo desde hace",
|
||||
@@ -455,7 +465,19 @@
|
||||
"optionPagespeed": "PageSpeed",
|
||||
"optionHardware": "Infraestructura",
|
||||
"optionGrpc": "gRPC",
|
||||
"optionWebSocket": "WebSocket"
|
||||
"optionWebSocket": "WebSocket",
|
||||
"optionDns": "DNS"
|
||||
},
|
||||
"bulkPause": {
|
||||
"paused_one": "{{count}} monitor pausado",
|
||||
"paused_other": "{{count}} monitores pausados",
|
||||
"resumed_one": "{{count}} monitor reanudado",
|
||||
"resumed_other": "{{count}} monitores reanudados",
|
||||
"alreadyPaused_one": "El monitor seleccionado ya está pausado",
|
||||
"alreadyPaused_other": "Todos los monitores seleccionados ya están pausados",
|
||||
"alreadyRunning_one": "El monitor seleccionado ya se está ejecutando",
|
||||
"alreadyRunning_other": "Todos los monitores seleccionados ya se están ejecutando",
|
||||
"partialFailure": "Se actualizaron {{successCount}} monitores, pero {{failedCount}} fallaron al sincronizarse con la cola de trabajos"
|
||||
}
|
||||
}
|
||||
},
|
||||
@@ -541,6 +563,30 @@
|
||||
"wsUrl": {
|
||||
"label": "URL de WebSocket",
|
||||
"placeholder": "wss://example.com/socket"
|
||||
},
|
||||
"captureUrl": {
|
||||
"label": "Endpoint de Capture",
|
||||
"placeholder": "http://192.168.1.10:5001/api/v1/metrics"
|
||||
},
|
||||
"dnsRecordType": {
|
||||
"label": "Tipo de registro DNS",
|
||||
"value": {
|
||||
"A": "A",
|
||||
"AAAA": "AAAA",
|
||||
"CNAME": "CNAME",
|
||||
"MX": "MX",
|
||||
"NS": "NS",
|
||||
"TXT": "TXT"
|
||||
}
|
||||
},
|
||||
"dnsServer": {
|
||||
"label": "Servidor DNS",
|
||||
"placeholder": "8.8.8.8"
|
||||
},
|
||||
"strategy": {
|
||||
"desktop": "Escritorio",
|
||||
"label": "Estrategia",
|
||||
"mobile": "Móvil"
|
||||
}
|
||||
},
|
||||
"title": "Configuración general",
|
||||
@@ -553,7 +599,8 @@
|
||||
"pagespeed": "Rastree el rendimiento de carga de página, Core Web Vitals y puntuaciones de optimización de su sitio web.",
|
||||
"grpc": "Ingrese el nombre de host y puerto del servidor gRPC, opcionalmente especifique un nombre de servicio para la verificación de salud, y agregue un nombre para mostrar.",
|
||||
"websocket": "Ingrese la URL de WebSocket a monitorear (p. ej., wss://example.com/socket) y agregue un nombre para mostrar.",
|
||||
"hardware": "Monitoree el uso de CPU, memoria, disco y temperatura de su infraestructura."
|
||||
"hardware": "Supervisa el uso de CPU, memoria, disco y temperatura de tu infraestructura. La URL del endpoint de Capture debe incluir la ruta completa /api/v1/metrics (p. ej., http://192.168.1.10:5001/api/v1/metrics). Para el secreto de autorización, pega solo la cadena del token — no incluyas 'Bearer'.",
|
||||
"dns": "Monitorea si un servidor DNS específico responde."
|
||||
}
|
||||
},
|
||||
"ignoreTls": {
|
||||
@@ -590,7 +637,8 @@
|
||||
"optionHttpDescription": "Use HTTP(S) para monitorear su sitio web o endpoint de API.",
|
||||
"optionPingDescription": "Use ICMP Ping para monitorear si un servidor está en línea.",
|
||||
"optionPortDescription": "Monitoree si un puerto específico de un servidor está abierto.",
|
||||
"title": "Tipo"
|
||||
"title": "Tipo",
|
||||
"optionDnsDescription": "Monitorea si un servidor DNS específico responde."
|
||||
},
|
||||
"thresholds": {
|
||||
"title": "Umbrales de alerta",
|
||||
@@ -898,7 +946,8 @@
|
||||
"lastFinishedAt": "Última finalización",
|
||||
"lastRunTook": "Última ejecución tomó",
|
||||
"lastFailedAt": "Última falla",
|
||||
"failReason": "Razón de falla"
|
||||
"failReason": "Razón de falla",
|
||||
"state": "Estado"
|
||||
}
|
||||
},
|
||||
"queueFallback": {
|
||||
@@ -1088,6 +1137,10 @@
|
||||
"header": {
|
||||
"title": "Monitores de PageSpeed",
|
||||
"description": "Sigue las Core Web Vitals y las puntuaciones de Lighthouse a lo largo del tiempo para detectar regresiones antes que tus usuarios."
|
||||
},
|
||||
"strategy": {
|
||||
"desktop": "Escritorio",
|
||||
"mobile": "Móvil"
|
||||
}
|
||||
},
|
||||
"settings": {
|
||||
@@ -1236,6 +1289,10 @@
|
||||
},
|
||||
"rejectUnauthorized": {
|
||||
"label": "Rechazar certificados inválidos: Rechazar conexiones con certificados autofirmados o no confiables"
|
||||
},
|
||||
"displayName": {
|
||||
"label": "Nombre del remitente (opcional) - Nombre amigable mostrado en el campo De",
|
||||
"placeholder": "Notificaciones de Checkmate"
|
||||
}
|
||||
}
|
||||
},
|
||||
@@ -1296,6 +1353,20 @@
|
||||
"uptime": {
|
||||
"title": "Tiempo de actividad",
|
||||
"responseTime": "Tiempo de respuesta"
|
||||
},
|
||||
"chart": {
|
||||
"avg": "prom {{value}}ms",
|
||||
"downTooltip": "Caído",
|
||||
"heatmapAria": "Mapa de calor del tiempo de respuesta",
|
||||
"max": "máx {{value}}ms"
|
||||
},
|
||||
"status": {
|
||||
"breached": "Umbral superado",
|
||||
"down": "Caído",
|
||||
"initializing": "Inicializando",
|
||||
"maintenance": "Mantenimiento",
|
||||
"paused": "Pausado",
|
||||
"up": "Operativo"
|
||||
}
|
||||
},
|
||||
"statusBar": {
|
||||
@@ -1313,7 +1384,9 @@
|
||||
"maintenance": "Algunos sistemas están en mantenimiento",
|
||||
"partiallyPaused": "Algunos sistemas están en pausa",
|
||||
"initializing": "Algunos sistemas se están inicializando",
|
||||
"noMonitors": "No se ha configurado ningún monitor"
|
||||
"noMonitors": "No se ha configurado ningún monitor",
|
||||
"monitoringSummary": "Monitoreando {{count}} servicio · Actualizaciones cada 10 segundos",
|
||||
"monitoringSummary_other": "Monitoreando {{count}} servicios · Actualizaciones cada 10 segundos"
|
||||
},
|
||||
"table": {
|
||||
"headers": {
|
||||
@@ -1404,18 +1477,47 @@
|
||||
"label": "Mostrar métricas de infraestructura"
|
||||
}
|
||||
}
|
||||
},
|
||||
"theme": {
|
||||
"description": "Elige el estilo visual para tu página de estado pública.",
|
||||
"label": "Tema",
|
||||
"options": {
|
||||
"bold": {
|
||||
"description": "Tipografía grande y espaciado confiado. Ideal para páginas centradas en la marca.",
|
||||
"name": "Audaz"
|
||||
},
|
||||
"editorial": {
|
||||
"description": "Encabezados con serifa y divisores finos. Distintivo y tranquilo.",
|
||||
"name": "Editorial"
|
||||
},
|
||||
"modern": {
|
||||
"description": "Calidad SaaS con un punto de estado pulsante y tarjetas que se desvanecen suavemente.",
|
||||
"name": "Moderno"
|
||||
},
|
||||
"refined": {
|
||||
"description": "Limpio, profesional, cercano al aspecto clásico de Checkmate.",
|
||||
"name": "Refinado"
|
||||
}
|
||||
},
|
||||
"title": "Tema de la página"
|
||||
},
|
||||
"themeMode": {
|
||||
"auto": "Automático (seguir dispositivo del visitante)",
|
||||
"dark": "Solo oscuro",
|
||||
"label": "Modo de tema",
|
||||
"light": "Solo claro"
|
||||
}
|
||||
},
|
||||
"header": {
|
||||
"title": "Páginas de estado",
|
||||
"description": "Publica páginas públicas que muestren a tus clientes y partes interesadas la disponibilidad en tiempo real y el historial de incidentes."
|
||||
},
|
||||
"publicPage": {
|
||||
"maintenance": {
|
||||
"upcoming": "Mantenimiento programado",
|
||||
"inProgress": "Mantenimiento en curso",
|
||||
"completed": "Mantenimiento completado"
|
||||
}
|
||||
"editorial": {
|
||||
"allUp": "Todos los sistemas funcionan con normalidad.",
|
||||
"reportTitle": "Informe de servicio"
|
||||
},
|
||||
"footer": {
|
||||
"poweredBy": "Desarrollado por"
|
||||
}
|
||||
},
|
||||
"uptime": {
|
||||
|
||||
+160
-44
@@ -73,7 +73,9 @@
|
||||
"paused": "keskeytetty",
|
||||
"na": "Ei saatavilla",
|
||||
"resolved": "Ratkaistu",
|
||||
"responseTime": "Vasteaika"
|
||||
"responseTime": "Vasteaika",
|
||||
"idle": "Toimeton",
|
||||
"running": "Käynnissä"
|
||||
},
|
||||
"form": {
|
||||
"role": {
|
||||
@@ -120,6 +122,17 @@
|
||||
"active": "Aktiivinen",
|
||||
"responseTime": "Vasteaika"
|
||||
}
|
||||
},
|
||||
"statusCode": {
|
||||
"down": "Alhaalla",
|
||||
"networkError": {
|
||||
"dns": "Isäntänimeä ei voitu selvittää (DNS-haku epäonnistui).",
|
||||
"refused": "Palvelin hylkäsi yhteyden (portti suljettu tai palvelu ei kuuntele).",
|
||||
"reset": "Yhteys nollattiin ennen vastauksen vastaanottamista.",
|
||||
"timeout": "Palvelin ei vastannut ajoissa (pyynnön aikakatkaisu).",
|
||||
"tls": "TLS- tai SSL-kättely epäonnistui (sertifikaatti- tai salausongelma).",
|
||||
"unknown": "Kohteesta ei vastaanotettu HTTP-vastausta."
|
||||
}
|
||||
}
|
||||
},
|
||||
"components": {
|
||||
@@ -306,28 +319,28 @@
|
||||
"common": {
|
||||
"passwordRules": {
|
||||
"length": {
|
||||
"beginning": "",
|
||||
"highlighted": ""
|
||||
"beginning": "Vähintään",
|
||||
"highlighted": "8 merkkiä pitkä"
|
||||
},
|
||||
"lowercase": {
|
||||
"beginning": "",
|
||||
"highlighted": ""
|
||||
"beginning": "Sisällettävä vähintään",
|
||||
"highlighted": "yksi pieni kirjain"
|
||||
},
|
||||
"match": {
|
||||
"beginning": "",
|
||||
"highlighted": ""
|
||||
"beginning": "Salasanat",
|
||||
"highlighted": "täytyy täsmätä"
|
||||
},
|
||||
"number": {
|
||||
"beginning": "",
|
||||
"highlighted": ""
|
||||
"beginning": "Sisällettävä vähintään",
|
||||
"highlighted": "yksi numero"
|
||||
},
|
||||
"special": {
|
||||
"beginning": "",
|
||||
"highlighted": ""
|
||||
"beginning": "Sisällettävä vähintään",
|
||||
"highlighted": "yksi erikoismerkki (!?@#$%^&*()-_=+[]{}|;:'\",./\\~`)"
|
||||
},
|
||||
"uppercase": {
|
||||
"beginning": "",
|
||||
"highlighted": ""
|
||||
"beginning": "Sisällettävä vähintään",
|
||||
"highlighted": "yksi iso kirjain"
|
||||
}
|
||||
},
|
||||
"form": {
|
||||
@@ -421,7 +434,11 @@
|
||||
"inviteMember": "Kutsu jäsen",
|
||||
"openSite": "Avaa sivusto",
|
||||
"pause": "Keskeytä",
|
||||
"resume": "Jatka"
|
||||
"resume": "Jatka",
|
||||
"selectAll": "Valitse kaikki näytöt",
|
||||
"selectMonitor": "Valitse {{name}}",
|
||||
"bulkSelected_one": "{{count}} näyttö valittu",
|
||||
"bulkSelected_other": "{{count}} näyttöä valittu"
|
||||
},
|
||||
"statBoxes": {
|
||||
"activeFor": "Aktiivinen",
|
||||
@@ -448,7 +465,19 @@
|
||||
"optionPagespeed": "PageSpeed",
|
||||
"optionHardware": "Infrastruktuuri",
|
||||
"optionGrpc": "gRPC",
|
||||
"optionWebSocket": "WebSocket"
|
||||
"optionWebSocket": "WebSocket",
|
||||
"optionDns": "DNS"
|
||||
},
|
||||
"bulkPause": {
|
||||
"paused_one": "{{count}} näyttö keskeytetty",
|
||||
"paused_other": "{{count}} näyttöä keskeytetty",
|
||||
"resumed_one": "{{count}} näyttö jatkettu",
|
||||
"resumed_other": "{{count}} näyttöä jatkettu",
|
||||
"alreadyPaused_one": "Valittu näyttö on jo keskeytetty",
|
||||
"alreadyPaused_other": "Kaikki valitut näytöt on jo keskeytetty",
|
||||
"alreadyRunning_one": "Valittu näyttö on jo käynnissä",
|
||||
"alreadyRunning_other": "Kaikki valitut näytöt ovat jo käynnissä",
|
||||
"partialFailure": "{{successCount}} monitoria päivitettiin, mutta {{failedCount}} epäonnistui synkronoinnissa työjonon kanssa"
|
||||
}
|
||||
}
|
||||
},
|
||||
@@ -469,9 +498,9 @@
|
||||
},
|
||||
"matchMethod": {
|
||||
"label": "Vertailutapa",
|
||||
"equal": "",
|
||||
"include": "",
|
||||
"regex": ""
|
||||
"equal": "Yhtä suuri",
|
||||
"include": "Sisältää",
|
||||
"regex": "Säännöllinen lauseke"
|
||||
}
|
||||
},
|
||||
"title": "Lisäasetukset"
|
||||
@@ -483,15 +512,15 @@
|
||||
"label": "Tarkistusväli",
|
||||
"value": {
|
||||
"fifteenMinutes": "15 minuuttia",
|
||||
"fifteenSeconds": "",
|
||||
"fifteenSeconds": "15 sekuntia",
|
||||
"fiveMinutes": "5 minuuttia",
|
||||
"fourMinutes": "",
|
||||
"oneMinute": "",
|
||||
"fourMinutes": "4 minuuttia",
|
||||
"oneMinute": "1 minuutti",
|
||||
"tenMinutes": "10 minuuttia",
|
||||
"thirtyMinutes": "30 minuuttia",
|
||||
"thirtySeconds": "",
|
||||
"threeMinutes": "",
|
||||
"twoMinutes": ""
|
||||
"thirtySeconds": "30 sekuntia",
|
||||
"threeMinutes": "3 minuuttia",
|
||||
"twoMinutes": "2 minuuttia"
|
||||
}
|
||||
}
|
||||
},
|
||||
@@ -520,8 +549,8 @@
|
||||
"placeholder": "https://www.google.com"
|
||||
},
|
||||
"game": {
|
||||
"label": "",
|
||||
"placeholder": ""
|
||||
"label": "Valitse peli",
|
||||
"placeholder": "Valitse peli"
|
||||
},
|
||||
"port": {
|
||||
"label": "Monitoroitava portti",
|
||||
@@ -534,19 +563,44 @@
|
||||
"wsUrl": {
|
||||
"label": "WebSocket URL",
|
||||
"placeholder": "wss://example.com/socket"
|
||||
},
|
||||
"captureUrl": {
|
||||
"label": "Capture-päätepiste",
|
||||
"placeholder": "http://192.168.1.10:5001/api/v1/metrics"
|
||||
},
|
||||
"dnsRecordType": {
|
||||
"label": "DNS-tietuetyyppi",
|
||||
"value": {
|
||||
"A": "A",
|
||||
"AAAA": "AAAA",
|
||||
"CNAME": "CNAME",
|
||||
"MX": "MX",
|
||||
"NS": "NS",
|
||||
"TXT": "TXT"
|
||||
}
|
||||
},
|
||||
"dnsServer": {
|
||||
"label": "DNS-palvelin",
|
||||
"placeholder": "8.8.8.8"
|
||||
},
|
||||
"strategy": {
|
||||
"desktop": "Työpöytä",
|
||||
"label": "Strategia",
|
||||
"mobile": "Mobiili"
|
||||
}
|
||||
},
|
||||
"title": "Yleiset asetukset",
|
||||
"description": {
|
||||
"http": "Syötä monitoroitava URL tai IP (esim. https://example.com/ tai 192.168.1.100) ja lisää selkeä näyttönimi, joka näkyy hallintapaneelissa.",
|
||||
"ping": "",
|
||||
"port": "",
|
||||
"docker": "",
|
||||
"ping": "Anna pingattava IP-osoite tai isäntänimi (esim. 192.168.1.100 tai example.com) ja lisää selkeä näyttönimi, joka näkyy hallintapaneelissa.",
|
||||
"port": "Anna palvelimen URL tai IP, portin numero ja selkeä näyttönimi, joka näkyy hallintapaneelissa.",
|
||||
"docker": "Anna Docker-kontin nimi tai tunnus. Voit käyttää joko kontin nimeä (esim. my-app) tai kontin tunnusta (täysi 64-merkkinen tunnus tai lyhyt tunnus).",
|
||||
"game": "Anna IP-osoite tai isäntänimi ja portin numero pingausta varten (esim. 192.168.1.100 tai example.com) ja valitse pelityyppi. Jotkin pelit vaativat palvelinkyselyiden käyttöönoton asetustiedostossaan — tarkista pelipalvelimesi dokumentaatio. Katso protokollatiedot <gamedigLink>tuettujen pelien luettelosta</gamedigLink>.",
|
||||
"pagespeed": "Seuraa sivun latausnopeutta, Core Web Vitals -arvoja ja optimointipisteitä verkkosivustollasi.",
|
||||
"grpc": "Syötä gRPC-palvelimen isäntänimi ja portti, määritä halutessasi palvelun nimi terveystarkistusta varten ja lisää näyttönimi.",
|
||||
"websocket": "Syötä monitoroitava WebSocket URL (esim. wss://example.com/socket) ja lisää näyttönimi.",
|
||||
"hardware": "Monitoroi infrastruktuurisi CPU:n, muistin ja levyn käyttöä sekä lämpötilaa."
|
||||
"hardware": "Seuraa infrastruktuurisi suorittimen, muistin, levyn käyttöä ja lämpötilaa. Capture-päätepisteen URL-osoitteen on sisällettävä koko polku /api/v1/metrics (esim. http://192.168.1.10:5001/api/v1/metrics). Liitä valtuutusavaimeen vain tokenin merkkijono — älä sisällytä sanaa 'Bearer'.",
|
||||
"dns": "Tarkkaile, vastaako tietty DNS-palvelin."
|
||||
}
|
||||
},
|
||||
"ignoreTls": {
|
||||
@@ -583,7 +637,8 @@
|
||||
"optionHttpDescription": "Käytä HTTP(S)-protokollaa verkkosivustosi tai API-päätepisteen monitorointiin.",
|
||||
"optionPingDescription": "Käytä ICMP Ping -komentoa monitoroimaan, onko palvelin verkossa.",
|
||||
"optionPortDescription": "Monitoroi, onko tietty palvelimen portti auki.",
|
||||
"title": "Tyyppi"
|
||||
"title": "Tyyppi",
|
||||
"optionDnsDescription": "Tarkkaile, vastaako tietty DNS-palvelin."
|
||||
},
|
||||
"thresholds": {
|
||||
"title": "Hälytysrajat",
|
||||
@@ -747,7 +802,7 @@
|
||||
"headers": {
|
||||
"endTime": "Päättymisaika",
|
||||
"resolutionType": "Ratkaisun tyyppi",
|
||||
"startTime": "",
|
||||
"startTime": "Aloitusaika",
|
||||
"statusCode": "Tilakoodi"
|
||||
},
|
||||
"resolvedIncidents": "Ratkaistut häiriöt",
|
||||
@@ -791,13 +846,13 @@
|
||||
}
|
||||
},
|
||||
"statBoxes": {
|
||||
"avgCpuTemperature": "",
|
||||
"cpuFrequency": "",
|
||||
"cpuLogical": "",
|
||||
"cpuPhysical": "",
|
||||
"avgCpuTemperature": "Keskimääräinen CPU-lämpötila",
|
||||
"cpuFrequency": "CPU-taajuus",
|
||||
"cpuLogical": "CPU (looginen)",
|
||||
"cpuPhysical": "CPU (fyysinen)",
|
||||
"disk": "Levy",
|
||||
"memory": "Muisti",
|
||||
"os": ""
|
||||
"os": "Käyttöjärjestelmä"
|
||||
},
|
||||
"table": {
|
||||
"headers": {
|
||||
@@ -808,7 +863,7 @@
|
||||
},
|
||||
"tabs": {
|
||||
"labels": {
|
||||
"network": "",
|
||||
"network": "Verkko",
|
||||
"overview": "Yleiskatsaus"
|
||||
}
|
||||
},
|
||||
@@ -891,7 +946,8 @@
|
||||
"lastFinishedAt": "Viimeisin valmistuminen",
|
||||
"lastRunTook": "Viimeisin suoritus kesti",
|
||||
"lastFailedAt": "Viimeisin epäonnistuminen",
|
||||
"failReason": "Epäonnistumisen syy"
|
||||
"failReason": "Epäonnistumisen syy",
|
||||
"state": "Tila"
|
||||
}
|
||||
},
|
||||
"queueFallback": {
|
||||
@@ -911,8 +967,8 @@
|
||||
},
|
||||
"table": {
|
||||
"headers": {
|
||||
"nextWindow": "",
|
||||
"repeat": ""
|
||||
"nextWindow": "Seuraava ikkuna",
|
||||
"repeat": "Toista"
|
||||
}
|
||||
},
|
||||
"form": {
|
||||
@@ -1014,7 +1070,7 @@
|
||||
},
|
||||
"telegram": {
|
||||
"title": "Telegram-määritykset",
|
||||
"description": "",
|
||||
"description": "Määritä Telegram-bottisi lähettämään ilmoituksia.",
|
||||
"optionBotToken": "Bottitunniste",
|
||||
"placeholderBotToken": "123456789:ABCdefGhIJKlmNoPQRsTUVwxyZ",
|
||||
"optionChatId": "Chat-tunnus",
|
||||
@@ -1081,6 +1137,10 @@
|
||||
"header": {
|
||||
"title": "PageSpeed-monitorit",
|
||||
"description": "Seuraa Core Web Vitals -mittareita ja Lighthouse-pisteitä ajan mittaan ja huomaa heikennykset ennen käyttäjiä."
|
||||
},
|
||||
"strategy": {
|
||||
"desktop": "Työpöytä",
|
||||
"mobile": "Mobiili"
|
||||
}
|
||||
},
|
||||
"settings": {
|
||||
@@ -1183,7 +1243,7 @@
|
||||
"email": {
|
||||
"title": "Sähköpostiasetukset",
|
||||
"description": "Määritä järjestelmäsi sähköpostiasetukset. Niitä käytetään ilmoitusten ja hälytysten lähettämiseen.",
|
||||
"descriptionTransport": "",
|
||||
"descriptionTransport": "Tämä rakentaa SMTP-kuljetuksen NodeMailerille",
|
||||
"descriptionTransportLink": "Katso tekniset tiedot täältä",
|
||||
"option": {
|
||||
"host": {
|
||||
@@ -1229,6 +1289,10 @@
|
||||
},
|
||||
"rejectUnauthorized": {
|
||||
"label": "Hylkää virheelliset varmenteet: Hylkää yhteydet itseallekirjoitetuilla tai ei-luotetuilla varmenteilla"
|
||||
},
|
||||
"displayName": {
|
||||
"label": "Lähettäjän nimi (valinnainen) - Lähettäjäkentässä näkyvä ystävällinen nimi",
|
||||
"placeholder": "Checkmate-ilmoitukset"
|
||||
}
|
||||
}
|
||||
},
|
||||
@@ -1289,6 +1353,20 @@
|
||||
"uptime": {
|
||||
"title": "Käytettävyys",
|
||||
"responseTime": "Vasteaika"
|
||||
},
|
||||
"chart": {
|
||||
"avg": "ka {{value}}ms",
|
||||
"downTooltip": "Alhaalla",
|
||||
"heatmapAria": "Vasteajan lämpökartta",
|
||||
"max": "max {{value}}ms"
|
||||
},
|
||||
"status": {
|
||||
"breached": "Kynnys ylittyi",
|
||||
"down": "Alhaalla",
|
||||
"initializing": "Alustetaan",
|
||||
"maintenance": "Huolto",
|
||||
"paused": "Keskeytetty",
|
||||
"up": "Toiminnassa"
|
||||
}
|
||||
},
|
||||
"statusBar": {
|
||||
@@ -1306,7 +1384,9 @@
|
||||
"maintenance": "Jotkin järjestelmät ovat huollossa",
|
||||
"partiallyPaused": "Jotkin järjestelmät on keskeytetty",
|
||||
"initializing": "Jotkin järjestelmät alustuvat",
|
||||
"noMonitors": "Yhtään monitoria ei ole määritetty"
|
||||
"noMonitors": "Yhtään monitoria ei ole määritetty",
|
||||
"monitoringSummary": "Tarkkaillaan {{count}} palvelua · Päivitykset 10 sekunnin välein",
|
||||
"monitoringSummary_other": "Tarkkaillaan {{count}} palvelua · Päivitykset 10 sekunnin välein"
|
||||
},
|
||||
"table": {
|
||||
"headers": {
|
||||
@@ -1397,11 +1477,47 @@
|
||||
"label": "Näytä infrastruktuurin mittarit"
|
||||
}
|
||||
}
|
||||
},
|
||||
"theme": {
|
||||
"description": "Valitse julkisen tilasivusi visuaalinen tyyli.",
|
||||
"label": "Teema",
|
||||
"options": {
|
||||
"bold": {
|
||||
"description": "Suuri typografia ja itsevarma välistys. Sopii brändilähtöisille sivuille.",
|
||||
"name": "Rohkea"
|
||||
},
|
||||
"editorial": {
|
||||
"description": "Antiikvaotsikot ja ohuet erottimet. Erottuva ja rauhallinen.",
|
||||
"name": "Toimituksellinen"
|
||||
},
|
||||
"modern": {
|
||||
"description": "SaaS-tasoa sykkivällä tilapisteellä ja pehmeästi haalistuvilla korteilla.",
|
||||
"name": "Moderni"
|
||||
},
|
||||
"refined": {
|
||||
"description": "Siisti, ammattimainen, lähellä klassista Checkmate-ilmettä.",
|
||||
"name": "Hienostunut"
|
||||
}
|
||||
},
|
||||
"title": "Sivun teema"
|
||||
},
|
||||
"themeMode": {
|
||||
"auto": "Automaattinen (seuraa vierailijan laitetta)",
|
||||
"dark": "Vain tumma",
|
||||
"label": "Teematila",
|
||||
"light": "Vain vaalea"
|
||||
}
|
||||
},
|
||||
"header": {
|
||||
"title": "Tilasivut",
|
||||
"description": "Julkaise julkisia sivuja, jotka näyttävät asiakkaille ja sidosryhmille reaaliaikaisen käytettävyyden ja tapaushistorian."
|
||||
},
|
||||
"editorial": {
|
||||
"allUp": "Kaikki järjestelmät toimivat normaalisti.",
|
||||
"reportTitle": "Palveluraportti"
|
||||
},
|
||||
"footer": {
|
||||
"poweredBy": "Tarjoaa"
|
||||
}
|
||||
},
|
||||
"uptime": {
|
||||
|
||||
+126
-10
@@ -73,7 +73,9 @@
|
||||
"paused": "en pause",
|
||||
"na": "N/A",
|
||||
"resolved": "Résolu",
|
||||
"responseTime": "Temps de réponse"
|
||||
"responseTime": "Temps de réponse",
|
||||
"idle": "Inactif",
|
||||
"running": "En cours d'exécution"
|
||||
},
|
||||
"form": {
|
||||
"role": {
|
||||
@@ -120,6 +122,17 @@
|
||||
"active": "Actif",
|
||||
"responseTime": "Temps de réponse"
|
||||
}
|
||||
},
|
||||
"statusCode": {
|
||||
"down": "Hors service",
|
||||
"networkError": {
|
||||
"dns": "Impossible de résoudre le nom d'hôte (échec de la recherche DNS).",
|
||||
"refused": "Le serveur a refusé la connexion (port fermé ou service non à l'écoute).",
|
||||
"reset": "La connexion a été réinitialisée avant la réception d'une réponse.",
|
||||
"timeout": "Le serveur n'a pas répondu à temps (délai d'attente dépassé).",
|
||||
"tls": "Échec de la négociation TLS ou SSL (problème de certificat ou de chiffrement).",
|
||||
"unknown": "Aucune réponse HTTP reçue de la cible."
|
||||
}
|
||||
}
|
||||
},
|
||||
"components": {
|
||||
@@ -421,7 +434,11 @@
|
||||
"inviteMember": "Inviter un membre",
|
||||
"openSite": "Ouvrir le site",
|
||||
"pause": "Pause",
|
||||
"resume": "Reprendre"
|
||||
"resume": "Reprendre",
|
||||
"selectAll": "Sélectionner tous les moniteurs",
|
||||
"selectMonitor": "Sélectionner {{name}}",
|
||||
"bulkSelected_one": "{{count}} moniteur sélectionné",
|
||||
"bulkSelected_other": "{{count}} moniteurs sélectionnés"
|
||||
},
|
||||
"statBoxes": {
|
||||
"activeFor": "Actif depuis",
|
||||
@@ -448,7 +465,19 @@
|
||||
"optionPagespeed": "PageSpeed",
|
||||
"optionHardware": "Infrastructure",
|
||||
"optionGrpc": "gRPC",
|
||||
"optionWebSocket": "WebSocket"
|
||||
"optionWebSocket": "WebSocket",
|
||||
"optionDns": "DNS"
|
||||
},
|
||||
"bulkPause": {
|
||||
"paused_one": "{{count}} moniteur en pause",
|
||||
"paused_other": "{{count}} moniteurs en pause",
|
||||
"resumed_one": "{{count}} moniteur repris",
|
||||
"resumed_other": "{{count}} moniteurs repris",
|
||||
"alreadyPaused_one": "Le moniteur sélectionné est déjà en pause",
|
||||
"alreadyPaused_other": "Tous les moniteurs sélectionnés sont déjà en pause",
|
||||
"alreadyRunning_one": "Le moniteur sélectionné est déjà en cours d'exécution",
|
||||
"alreadyRunning_other": "Tous les moniteurs sélectionnés sont déjà en cours d'exécution",
|
||||
"partialFailure": "{{successCount}} moniteurs mis à jour, mais {{failedCount}} n'ont pas pu se synchroniser avec la file d'attente des tâches"
|
||||
}
|
||||
}
|
||||
},
|
||||
@@ -520,8 +549,8 @@
|
||||
"placeholder": "https://www.google.com"
|
||||
},
|
||||
"game": {
|
||||
"label": "",
|
||||
"placeholder": ""
|
||||
"label": "Choisir un jeu",
|
||||
"placeholder": "Sélectionner un jeu"
|
||||
},
|
||||
"port": {
|
||||
"label": "Port à surveiller",
|
||||
@@ -534,6 +563,30 @@
|
||||
"wsUrl": {
|
||||
"label": "URL WebSocket",
|
||||
"placeholder": "wss://example.com/socket"
|
||||
},
|
||||
"captureUrl": {
|
||||
"label": "Point de terminaison Capture",
|
||||
"placeholder": "http://192.168.1.10:5001/api/v1/metrics"
|
||||
},
|
||||
"dnsRecordType": {
|
||||
"label": "Type d'enregistrement DNS",
|
||||
"value": {
|
||||
"A": "A",
|
||||
"AAAA": "AAAA",
|
||||
"CNAME": "CNAME",
|
||||
"MX": "MX",
|
||||
"NS": "NS",
|
||||
"TXT": "TXT"
|
||||
}
|
||||
},
|
||||
"dnsServer": {
|
||||
"label": "Serveur DNS",
|
||||
"placeholder": "8.8.8.8"
|
||||
},
|
||||
"strategy": {
|
||||
"desktop": "Bureau",
|
||||
"label": "Stratégie",
|
||||
"mobile": "Mobile"
|
||||
}
|
||||
},
|
||||
"title": "Paramètres généraux",
|
||||
@@ -546,7 +599,8 @@
|
||||
"pagespeed": "Suivez les performances de chargement, les Core Web Vitals et les scores d'optimisation de votre site web.",
|
||||
"grpc": "Saisissez le nom d'hôte et le port du serveur gRPC, spécifiez éventuellement un nom de service pour le bilan de santé, et ajoutez un nom d'affichage.",
|
||||
"websocket": "Saisissez l'URL WebSocket à surveiller (ex. wss://example.com/socket) et ajoutez un nom d'affichage.",
|
||||
"hardware": "Surveillez l'utilisation du CPU, de la mémoire, du disque et la température de votre infrastructure."
|
||||
"hardware": "Surveillez l'utilisation du processeur, de la mémoire, du disque et la température de votre infrastructure. L'URL du point de terminaison Capture doit inclure le chemin complet /api/v1/metrics (par ex. http://192.168.1.10:5001/api/v1/metrics). Pour le secret d'autorisation, collez uniquement la chaîne du jeton — n'incluez pas 'Bearer'.",
|
||||
"dns": "Surveillez si un serveur DNS spécifique répond."
|
||||
}
|
||||
},
|
||||
"ignoreTls": {
|
||||
@@ -583,7 +637,8 @@
|
||||
"optionHttpDescription": "Utilisez HTTP(S) pour surveiller votre site web ou point de terminaison API.",
|
||||
"optionPingDescription": "Utilisez le Ping ICMP pour surveiller si un serveur est en ligne.",
|
||||
"optionPortDescription": "Surveillez si un port spécifique sur un serveur est ouvert.",
|
||||
"title": "Type"
|
||||
"title": "Type",
|
||||
"optionDnsDescription": "Surveillez si un serveur DNS spécifique répond."
|
||||
},
|
||||
"thresholds": {
|
||||
"title": "Seuils d'alerte",
|
||||
@@ -808,7 +863,7 @@
|
||||
},
|
||||
"tabs": {
|
||||
"labels": {
|
||||
"network": "",
|
||||
"network": "Réseau",
|
||||
"overview": "Aperçu"
|
||||
}
|
||||
},
|
||||
@@ -891,7 +946,8 @@
|
||||
"lastFinishedAt": "Dernière fin",
|
||||
"lastRunTook": "Durée dernière exécution",
|
||||
"lastFailedAt": "Dernier échec",
|
||||
"failReason": "Raison de l'échec"
|
||||
"failReason": "Raison de l'échec",
|
||||
"state": "État"
|
||||
}
|
||||
},
|
||||
"queueFallback": {
|
||||
@@ -1081,6 +1137,10 @@
|
||||
"header": {
|
||||
"title": "Moniteurs PageSpeed",
|
||||
"description": "Suivez les Core Web Vitals et les scores Lighthouse au fil du temps pour détecter les régressions avant vos utilisateurs."
|
||||
},
|
||||
"strategy": {
|
||||
"desktop": "Bureau",
|
||||
"mobile": "Mobile"
|
||||
}
|
||||
},
|
||||
"settings": {
|
||||
@@ -1229,6 +1289,10 @@
|
||||
},
|
||||
"rejectUnauthorized": {
|
||||
"label": "Rejeter les certificats invalides : refuser les connexions avec des certificats auto-signés ou non fiables"
|
||||
},
|
||||
"displayName": {
|
||||
"label": "Nom de l'expéditeur (facultatif) - Nom convivial affiché dans le champ De",
|
||||
"placeholder": "Notifications Checkmate"
|
||||
}
|
||||
}
|
||||
},
|
||||
@@ -1289,6 +1353,20 @@
|
||||
"uptime": {
|
||||
"title": "Disponibilité",
|
||||
"responseTime": "Temps de réponse"
|
||||
},
|
||||
"chart": {
|
||||
"avg": "moy {{value}}ms",
|
||||
"downTooltip": "Hors service",
|
||||
"heatmapAria": "Carte thermique des temps de réponse",
|
||||
"max": "max {{value}}ms"
|
||||
},
|
||||
"status": {
|
||||
"breached": "Seuil dépassé",
|
||||
"down": "Hors service",
|
||||
"initializing": "Initialisation",
|
||||
"maintenance": "Maintenance",
|
||||
"paused": "En pause",
|
||||
"up": "Opérationnel"
|
||||
}
|
||||
},
|
||||
"statusBar": {
|
||||
@@ -1306,7 +1384,9 @@
|
||||
"maintenance": "Certains systèmes sont en maintenance",
|
||||
"partiallyPaused": "Certains systèmes sont en pause",
|
||||
"initializing": "Certains systèmes sont en cours d'initialisation",
|
||||
"noMonitors": "Aucun moniteur n'a été configuré"
|
||||
"noMonitors": "Aucun moniteur n'a été configuré",
|
||||
"monitoringSummary": "Surveillance de {{count}} service · Mises à jour toutes les 10 secondes",
|
||||
"monitoringSummary_other": "Surveillance de {{count}} services · Mises à jour toutes les 10 secondes"
|
||||
},
|
||||
"table": {
|
||||
"headers": {
|
||||
@@ -1397,11 +1477,47 @@
|
||||
"label": "Afficher les métriques d'infrastructure"
|
||||
}
|
||||
}
|
||||
},
|
||||
"theme": {
|
||||
"description": "Choisissez le style visuel de votre page de statut publique.",
|
||||
"label": "Thème",
|
||||
"options": {
|
||||
"bold": {
|
||||
"description": "Grande typographie et espacement assuré. Idéal pour les pages axées sur la marque.",
|
||||
"name": "Audacieux"
|
||||
},
|
||||
"editorial": {
|
||||
"description": "Titres avec serif et séparateurs fins. Distinctif et calme.",
|
||||
"name": "Éditorial"
|
||||
},
|
||||
"modern": {
|
||||
"description": "Qualité SaaS avec un point de statut pulsant et des cartes qui s'estompent doucement.",
|
||||
"name": "Moderne"
|
||||
},
|
||||
"refined": {
|
||||
"description": "Propre, professionnel, proche du look classique de Checkmate.",
|
||||
"name": "Raffiné"
|
||||
}
|
||||
},
|
||||
"title": "Thème de la page"
|
||||
},
|
||||
"themeMode": {
|
||||
"auto": "Automatique (selon l'appareil du visiteur)",
|
||||
"dark": "Sombre uniquement",
|
||||
"label": "Mode de thème",
|
||||
"light": "Clair uniquement"
|
||||
}
|
||||
},
|
||||
"header": {
|
||||
"title": "Pages de statut",
|
||||
"description": "Publiez des pages publiques montrant à vos clients et parties prenantes la disponibilité en temps réel et l'historique des incidents."
|
||||
},
|
||||
"editorial": {
|
||||
"allUp": "Tous les systèmes fonctionnent normalement.",
|
||||
"reportTitle": "Rapport de service"
|
||||
},
|
||||
"footer": {
|
||||
"poweredBy": "Propulsé par"
|
||||
}
|
||||
},
|
||||
"uptime": {
|
||||
|
||||
+134
-18
@@ -73,7 +73,9 @@
|
||||
"paused": "一時停止中",
|
||||
"na": "N/A",
|
||||
"resolved": "解決済み",
|
||||
"responseTime": "応答時間"
|
||||
"responseTime": "応答時間",
|
||||
"idle": "アイドル",
|
||||
"running": "実行中"
|
||||
},
|
||||
"form": {
|
||||
"role": {
|
||||
@@ -120,6 +122,17 @@
|
||||
"active": "アクティブ",
|
||||
"responseTime": "応答時間"
|
||||
}
|
||||
},
|
||||
"statusCode": {
|
||||
"down": "ダウン",
|
||||
"networkError": {
|
||||
"dns": "ホスト名を解決できませんでした(DNSルックアップに失敗)。",
|
||||
"refused": "サーバーが接続を拒否しました(ポートが閉じているか、サービスがリッスンしていません)。",
|
||||
"reset": "応答を受信する前に接続がリセットされました。",
|
||||
"timeout": "サーバーがタイムアウト内に応答しませんでした(リクエストタイムアウト)。",
|
||||
"tls": "TLSまたはSSLハンドシェイクに失敗しました(証明書または暗号化の問題)。",
|
||||
"unknown": "ターゲットからのHTTP応答がありませんでした。"
|
||||
}
|
||||
}
|
||||
},
|
||||
"components": {
|
||||
@@ -421,7 +434,11 @@
|
||||
"inviteMember": "メンバーを招待",
|
||||
"openSite": "サイトを開く",
|
||||
"pause": "一時停止",
|
||||
"resume": "再開"
|
||||
"resume": "再開",
|
||||
"selectAll": "すべてのモニターを選択",
|
||||
"selectMonitor": "{{name}} を選択",
|
||||
"bulkSelected_one": "{{count}} 個のモニターが選択されました",
|
||||
"bulkSelected_other": "{{count}} 個のモニターが選択されました"
|
||||
},
|
||||
"statBoxes": {
|
||||
"activeFor": "稼働期間",
|
||||
@@ -448,7 +465,19 @@
|
||||
"optionPagespeed": "PageSpeed",
|
||||
"optionHardware": "インフラストラクチャ",
|
||||
"optionGrpc": "gRPC",
|
||||
"optionWebSocket": "WebSocket"
|
||||
"optionWebSocket": "WebSocket",
|
||||
"optionDns": "DNS"
|
||||
},
|
||||
"bulkPause": {
|
||||
"paused_one": "{{count}} 個のモニターを一時停止しました",
|
||||
"paused_other": "{{count}} 個のモニターを一時停止しました",
|
||||
"resumed_one": "{{count}} 個のモニターを再開しました",
|
||||
"resumed_other": "{{count}} 個のモニターを再開しました",
|
||||
"alreadyPaused_one": "選択したモニターはすでに一時停止されています",
|
||||
"alreadyPaused_other": "選択したすべてのモニターはすでに一時停止されています",
|
||||
"alreadyRunning_one": "選択したモニターはすでに実行中です",
|
||||
"alreadyRunning_other": "選択したすべてのモニターはすでに実行中です",
|
||||
"partialFailure": "{{successCount}} 個のモニターが更新されましたが、{{failedCount}} 個はジョブキューとの同期に失敗しました"
|
||||
}
|
||||
}
|
||||
},
|
||||
@@ -469,9 +498,9 @@
|
||||
},
|
||||
"matchMethod": {
|
||||
"label": "マッチ方法",
|
||||
"equal": "",
|
||||
"include": "",
|
||||
"regex": ""
|
||||
"equal": "等しい",
|
||||
"include": "含む",
|
||||
"regex": "正規表現"
|
||||
}
|
||||
},
|
||||
"title": "詳細設定"
|
||||
@@ -483,15 +512,15 @@
|
||||
"label": "チェック頻度",
|
||||
"value": {
|
||||
"fifteenMinutes": "15分",
|
||||
"fifteenSeconds": "",
|
||||
"fifteenSeconds": "15秒",
|
||||
"fiveMinutes": "5分",
|
||||
"fourMinutes": "",
|
||||
"oneMinute": "",
|
||||
"fourMinutes": "4分",
|
||||
"oneMinute": "1分",
|
||||
"tenMinutes": "10分",
|
||||
"thirtyMinutes": "30分",
|
||||
"thirtySeconds": "",
|
||||
"thirtySeconds": "30秒",
|
||||
"threeMinutes": "3分",
|
||||
"twoMinutes": ""
|
||||
"twoMinutes": "2分"
|
||||
}
|
||||
}
|
||||
},
|
||||
@@ -520,8 +549,8 @@
|
||||
"placeholder": "https://www.google.com"
|
||||
},
|
||||
"game": {
|
||||
"label": "",
|
||||
"placeholder": ""
|
||||
"label": "ゲームを選択",
|
||||
"placeholder": "ゲームを選択"
|
||||
},
|
||||
"port": {
|
||||
"label": "監視するポート",
|
||||
@@ -534,6 +563,30 @@
|
||||
"wsUrl": {
|
||||
"label": "WebSocket URL",
|
||||
"placeholder": "wss://example.com/socket"
|
||||
},
|
||||
"captureUrl": {
|
||||
"label": "Capture エンドポイント",
|
||||
"placeholder": "http://192.168.1.10:5001/api/v1/metrics"
|
||||
},
|
||||
"dnsRecordType": {
|
||||
"label": "DNSレコードタイプ",
|
||||
"value": {
|
||||
"A": "A",
|
||||
"AAAA": "AAAA",
|
||||
"CNAME": "CNAME",
|
||||
"MX": "MX",
|
||||
"NS": "NS",
|
||||
"TXT": "TXT"
|
||||
}
|
||||
},
|
||||
"dnsServer": {
|
||||
"label": "DNSサーバー",
|
||||
"placeholder": "8.8.8.8"
|
||||
},
|
||||
"strategy": {
|
||||
"desktop": "デスクトップ",
|
||||
"label": "ストラテジー",
|
||||
"mobile": "モバイル"
|
||||
}
|
||||
},
|
||||
"title": "一般設定",
|
||||
@@ -546,7 +599,8 @@
|
||||
"pagespeed": "Webサイトのページ読み込みパフォーマンス、Core Web Vitals、最適化スコアを追跡します。",
|
||||
"grpc": "gRPCサーバーのホスト名とポートを入力し、必要に応じてヘルスチェック用のサービス名を指定し、表示名を追加してください。",
|
||||
"websocket": "監視するWebSocket URLを入力し(例: wss://example.com/socket)、表示名を追加してください。",
|
||||
"hardware": "インフラストラクチャのCPU、メモリ、ディスク使用量、温度を監視します。"
|
||||
"hardware": "インフラの CPU、メモリ、ディスク使用率、温度を監視します。Capture エンドポイント URL には完全なパス /api/v1/metrics を含める必要があります (例: http://192.168.1.10:5001/api/v1/metrics)。認証シークレットにはトークン文字列のみを貼り付けてください — 'Bearer' は含めないでください。",
|
||||
"dns": "特定のDNSサーバーが応答しているかを監視します。"
|
||||
}
|
||||
},
|
||||
"ignoreTls": {
|
||||
@@ -583,7 +637,8 @@
|
||||
"optionHttpDescription": "HTTP(S)を使用してWebサイトまたはAPIエンドポイントを監視します。",
|
||||
"optionPingDescription": "ICMP Pingを使用してサーバーがオンラインかどうかを監視します。",
|
||||
"optionPortDescription": "サーバーの特定のポートが開いているかどうかを監視します。",
|
||||
"title": "タイプ"
|
||||
"title": "タイプ",
|
||||
"optionDnsDescription": "特定のDNSサーバーが応答しているかを監視します。"
|
||||
},
|
||||
"thresholds": {
|
||||
"title": "アラートしきい値",
|
||||
@@ -808,7 +863,7 @@
|
||||
},
|
||||
"tabs": {
|
||||
"labels": {
|
||||
"network": "",
|
||||
"network": "ネットワーク",
|
||||
"overview": "概要"
|
||||
}
|
||||
},
|
||||
@@ -891,7 +946,8 @@
|
||||
"lastFinishedAt": "最終完了日時",
|
||||
"lastRunTook": "最終実行時間",
|
||||
"lastFailedAt": "最終失敗日時",
|
||||
"failReason": "失敗理由"
|
||||
"failReason": "失敗理由",
|
||||
"state": "状態"
|
||||
}
|
||||
},
|
||||
"queueFallback": {
|
||||
@@ -1081,6 +1137,10 @@
|
||||
"header": {
|
||||
"title": "PageSpeed監視",
|
||||
"description": "Core Web VitalsとLighthouseスコアを継続的に追跡し、ユーザーが気付く前に劣化を発見します。"
|
||||
},
|
||||
"strategy": {
|
||||
"desktop": "デスクトップ",
|
||||
"mobile": "モバイル"
|
||||
}
|
||||
},
|
||||
"settings": {
|
||||
@@ -1229,6 +1289,10 @@
|
||||
},
|
||||
"rejectUnauthorized": {
|
||||
"label": "無効な証明書を拒否: 自己署名または信頼されていない証明書の接続を拒否"
|
||||
},
|
||||
"displayName": {
|
||||
"label": "送信者名(任意)- 差出人フィールドに表示されるわかりやすい名前",
|
||||
"placeholder": "Checkmate通知"
|
||||
}
|
||||
}
|
||||
},
|
||||
@@ -1289,6 +1353,20 @@
|
||||
"uptime": {
|
||||
"title": "稼働時間",
|
||||
"responseTime": "応答時間"
|
||||
},
|
||||
"chart": {
|
||||
"avg": "平均 {{value}}ms",
|
||||
"downTooltip": "ダウン",
|
||||
"heatmapAria": "応答時間のヒートマップ",
|
||||
"max": "最大 {{value}}ms"
|
||||
},
|
||||
"status": {
|
||||
"breached": "しきい値超過",
|
||||
"down": "ダウン",
|
||||
"initializing": "初期化中",
|
||||
"maintenance": "メンテナンス",
|
||||
"paused": "一時停止中",
|
||||
"up": "稼働中"
|
||||
}
|
||||
},
|
||||
"statusBar": {
|
||||
@@ -1306,7 +1384,9 @@
|
||||
"maintenance": "一部のシステムがメンテナンス中です",
|
||||
"partiallyPaused": "一部のシステムが一時停止中です",
|
||||
"initializing": "一部のシステムが初期化中です",
|
||||
"noMonitors": "モニターが設定されていません"
|
||||
"noMonitors": "モニターが設定されていません",
|
||||
"monitoringSummary": "{{count}}サービスを監視中 · 10秒ごとに更新",
|
||||
"monitoringSummary_other": "{{count}}サービスを監視中 · 10秒ごとに更新"
|
||||
},
|
||||
"table": {
|
||||
"headers": {
|
||||
@@ -1397,11 +1477,47 @@
|
||||
"label": "インフラストラクチャメトリクスを表示"
|
||||
}
|
||||
}
|
||||
},
|
||||
"theme": {
|
||||
"description": "公開ステータスページの視覚スタイルを選択します。",
|
||||
"label": "テーマ",
|
||||
"options": {
|
||||
"bold": {
|
||||
"description": "大きな書体と自信のある間隔。ブランド中心のページに最適です。",
|
||||
"name": "ボールド"
|
||||
},
|
||||
"editorial": {
|
||||
"description": "セリフ見出しと細い区切り線。独特で落ち着いています。",
|
||||
"name": "エディトリアル"
|
||||
},
|
||||
"modern": {
|
||||
"description": "脈動するステータスドットと柔らかくフェードするカードを備えたSaaS品質。",
|
||||
"name": "モダン"
|
||||
},
|
||||
"refined": {
|
||||
"description": "クリーンでプロフェッショナル、Checkmateのクラシックな外観に近い。",
|
||||
"name": "リファインド"
|
||||
}
|
||||
},
|
||||
"title": "ページテーマ"
|
||||
},
|
||||
"themeMode": {
|
||||
"auto": "自動(訪問者のデバイスに従う)",
|
||||
"dark": "ダークのみ",
|
||||
"label": "テーマモード",
|
||||
"light": "ライトのみ"
|
||||
}
|
||||
},
|
||||
"header": {
|
||||
"title": "ステータスページ",
|
||||
"description": "顧客と関係者にリアルタイムの稼働状況とインシデント履歴を表示する公開ページを公開します。"
|
||||
},
|
||||
"editorial": {
|
||||
"allUp": "すべてのシステムは正常に動作しています。",
|
||||
"reportTitle": "サービスレポート"
|
||||
},
|
||||
"footer": {
|
||||
"poweredBy": "提供元"
|
||||
}
|
||||
},
|
||||
"uptime": {
|
||||
|
||||
Loaded 100 of 209 files, more files were not shown because too many files have changed in this diff.
Show more
Reference in new issue
Block a user